AQA A level Bio 3.7.4 Populations in Ecosystem
 Call Kai
 Learn
Learn Practice Test
 Spaced Repetition
 Match
Match Flashcards
 Knowt Play
1/31

Earn XP
Description and Tags
Name | Mastery | Learn | Test | Matching | Spaced | Call with Kai | Chat |
|---|
No analytics yet
Send a link to your students to track their progress
32 Terms
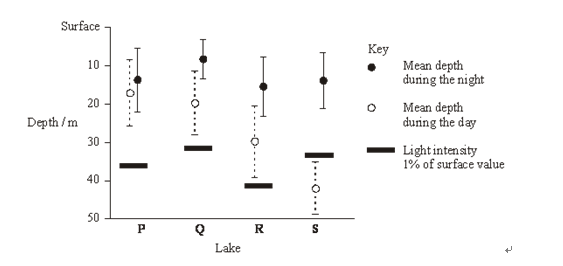
Zooplankton are very small animals which feed on algae (green protoctists) found in lakes. The chart shows the mean depth of zooplankton populations in four lakes, P to S, during the day and the night. It also shows the standard deviations of the means. The depth at which the light intensity is 1% of the surface light intensity is also shown.
Explain the evidence that the zooplankton feed at night (3)
Zooplankton nearer surface at night (1)
Algae only found at surface (1)
little light below 30/40 m (1)
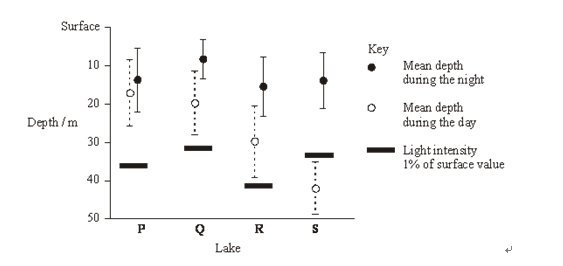
Zooplankton are very small animals which feed on algae (green protoctists) found in lakes. The chart shows the mean depth of zooplankton populations in four lakes, P to S, during the day and the night. It also shows the standard deviations of the means. The depth at which the light intensity is 1% of the surface light intensity is also shown.
Predatory fish, which hunt by sight, are present in some of the lakes. These fish have been present in the lakes for different lengths of time.
Lake | Estimated length of time predatory fish have been present / years |
P | 0 |
Q | 5 |
R | 25 |
S | Over 1000 |
Describe the relationship between the depth of the zooplankton during the day and the length of time predators have been present in the lake (1)
With increasing time predators have been present in the lake,
the greater the depth at which zooplanton are found (1)
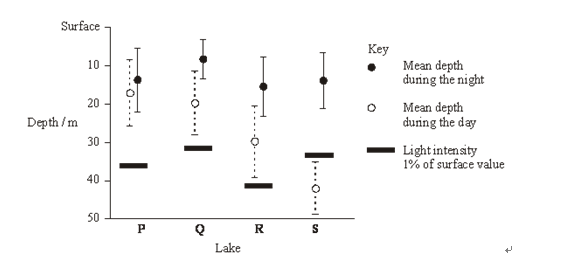
Zooplankton are very small animals which feed on algae (green protoctists) found in lakes. The chart shows the mean depth of zooplankton populations in four lakes, P to S, during the day and the night. It also shows the standard deviations of the means. The depth at which the light intensity is 1% of the surface light intensity is also shown.
Suggest how the differences in behaviour of the zooplankton populations in the four lakes might have evolved. (3)
Variation in migration behaviour (1)
Vertical migration reduces chance of predation (1)
Those that migrated are more likely to reproduce (1)
Ecologists investigated predation by 555 domestic cats whose owners lived in different types of housing. They asked cat owners to record the number of mammals, birds and frogs that their cats brought home over a five-month period.
The graph shows their results.
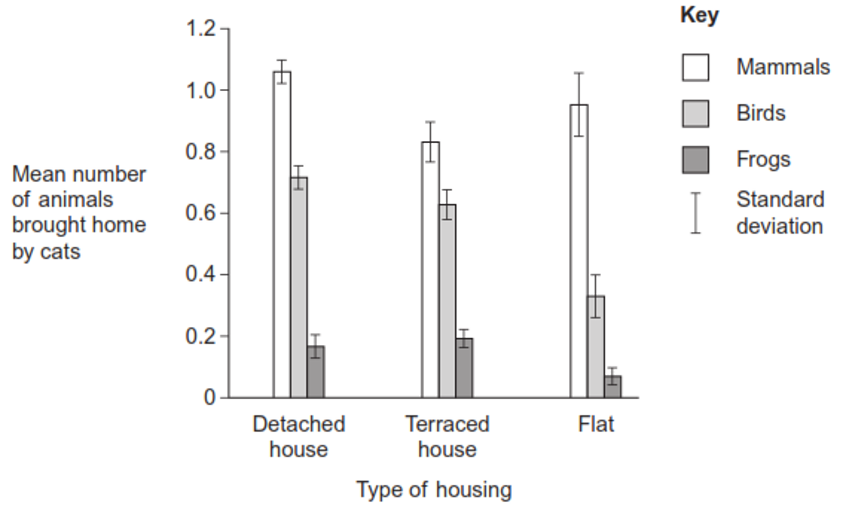
Some scientists thought that results of this investigation were not very reliable. Suggest one reason why they might have thought that the results were not reliable (2)
Cats may kill other animals (1)
But don’t bring them home (1)
What is meant by a community?
Populations of different species (1)
living in the same environment/habitat (1)
Explain the meaning of population (1)
number of organisms of a species in a given geological area (1)
Mayflies are insects which lay their eggs in streams and rivers. The nymphs which hatch from the eggs live in the water for several years.
Mayfly nymphs were collected by disturbing the gravel of a stream bed. A net placed immediately downstream caught any animals which were washed out of the gravel. Eight samples were collected from shallow, fast-flowing parts of the stream and eight from deeper, slow-flowing parts. Nymphs from two different families of mayfly were found. The results are given in the table.
| Family Caenidae | Family Baetidae | ||
| Shallow water | Deep water | Shallow water | Deep water |
Mean number of nymphs | 2.38 | 12.88 | 24.50 | 6.00 |
Standard deviation | 1.51 | 7.92 | 6.72 | 1.51 |
Describe how you would have collected the samples in order to ensure they were representative of the habitats being investigated and could be compared with each other. (3)
Random sampling (1)
Generate grid coordinates using a random number generator (1)
Use the same size of quadrat (1)
What is meant by the term ecological niche? (1)
An organism’s role in the community/ecosystem (1)
Mayflies are insects which lay their eggs in streams and rivers. The nymphs which hatch from the eggs live in the water for several years.
Mayfly nymphs were collected by disturbing the gravel of a stream bed. A net placed immediately downstream caught any animals which were washed out of the gravel. Eight samples were collected from shallow, fast-flowing parts of the stream and eight from deeper, slow-flowing parts. Nymphs from two different families of mayfly were found. The results are given in the table.
| Family Caenidae | Family Baetidae | ||
| Shallow water | Deep water | Shallow water | Deep water |
Mean number of nymphs | 2.38 | 12.88 | 24.50 | 6.00 |
Standard deviation | 1.51 | 7.92 | 6.72 | 1.51 |
Describe the evidence in the table which suggests that the two families of mayflies occupy different ecological niches. (1)
Caenidae found mainly in deep water and baetidae in shallow water (1)
Explain the advantage to these two families of mayflies of occupying different ecological niches. (2)
reduces competition for food (1)
Ensure both types survive (1)
Scientists recorded the number of water beetle species in 30 lakes. In each lake, they measured the pH of the water and recorded whether there were any fish present.
The graph shows their results.
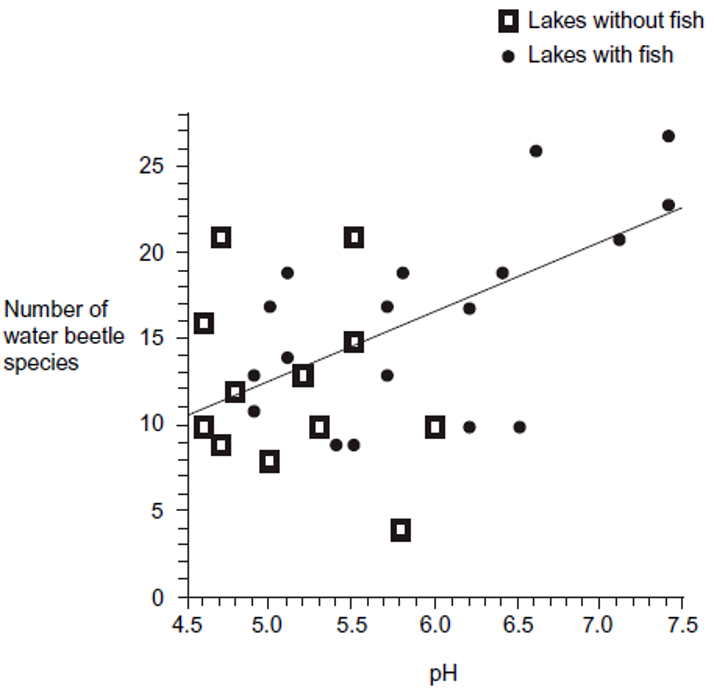
A student concluded that a decrease in acidity caused an increase in the number of water beetle species.
Evaluate this conclusion. (3)
Results are spread out /variation in numbers of beetles species at same/similar particular pH (1)
Correlation but does not mean a casual effect (1)
Large sample (1)
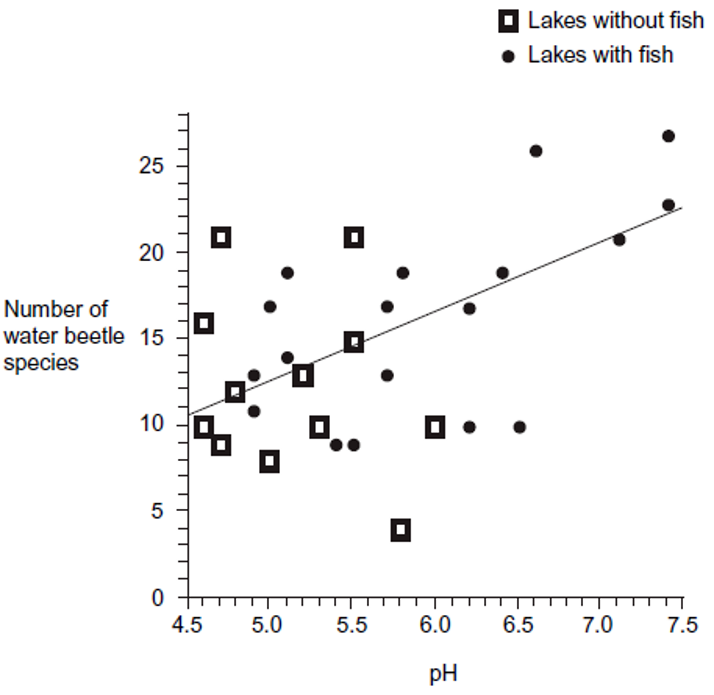
Scientists recorded the number of water beetle species in 30 lakes. In each lake, they measured the pH of the water and recorded whether there were any fish present.
The graph shows their results.
Explain how the presence of fish in a lake could cause an increase in the number of water beetle species (1)
Fish feed on predator of water beetles (1)
The young of frogs and toads are called tadpoles. Ecologists investigated the effect of predation on three species of tadpole. They set up four artificial pond communities.
Each community contained
• 200 spadefoot toad tadpoles
• 300 spring peeper frog tadpoles
• 300 southern toad tadpoles.
The ecologists then added a different number of newts to each pond. Newts are predators. Figure 1 shows the effect of increasing the number of newts on the percentage survival of the tadpoles of each species.
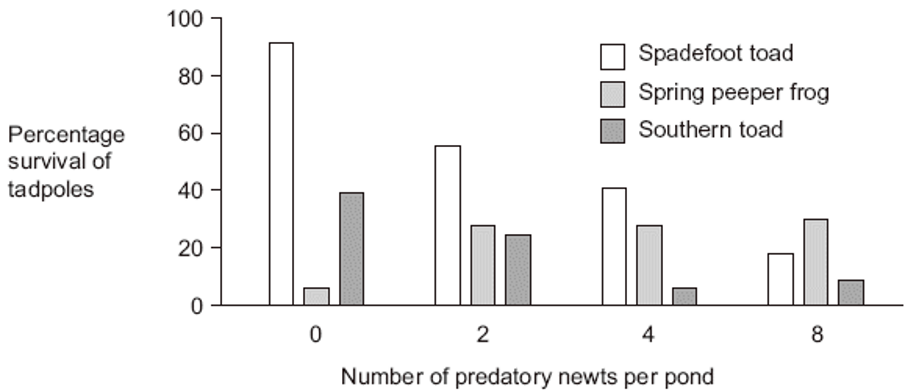
Suggest an explanation for the effect of an increase in the number of newts on the percentage survival of the tadpoles of spring peeper frogs. (2)
Newts eat/prey on toad (1)
less competition so more food/fewer toads feeding on frogs (1)
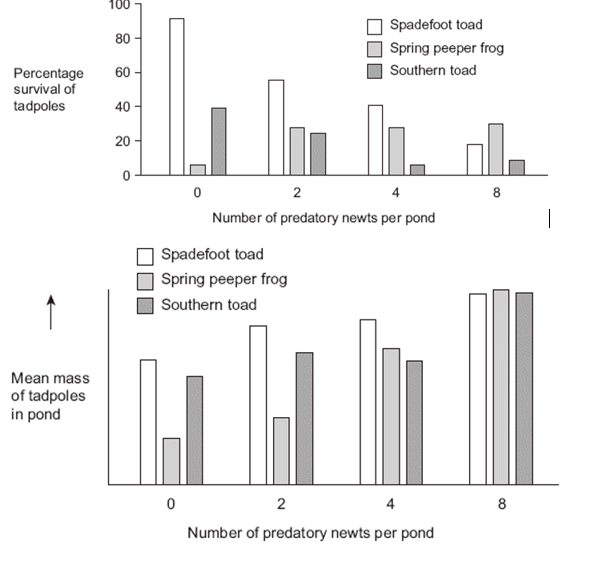
The young of frogs and toads are called tadpoles. Ecologists investigated the effect of predation on three species of tadpole. They set up four artificial pond communities.
Each community contained
• 200 spadefoot toad tadpoles
• 300 spring peeper frog tadpoles
• 300 southern toad tadpoles.
The ecologists then added a different number of newts to each pond. Newts are predators. Figure 1 shows the effect of increasing the number of newts on the percentage survival of the tadpoles of each species.
Figure 2 shows how the masses of the tadpoles were affected in each pond during the investigation.
Using the information provided in Figure 1 explain the results obtained in Figure 2 (2)
Fewer tadpoles as number of predators increases in Figure 1 (1)
More food, so are larger (1)
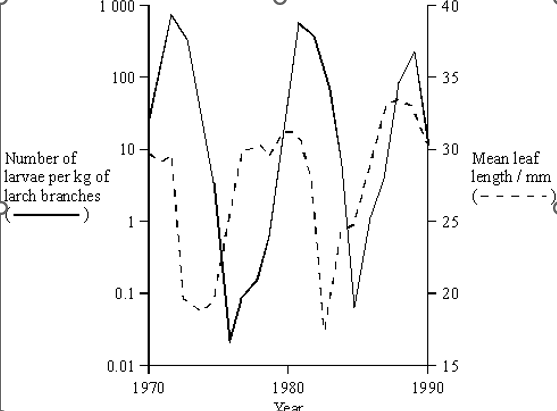
A species of moth occurs in forests in Switzerland. The moth larvae feed on the needle-shaped leaves of larch trees that grow in the forests. The graph shows the numbers of larvae and the mean length of leaves over a period of 20 years.
Larch trees lose their leaves in autumn. When numbers of larvae are large in one year, the leaves in the following year are shorter. Suggest an explanation for this.(2)
Reduction in leaf area (1)
Less food resources available for production of new needles (1)
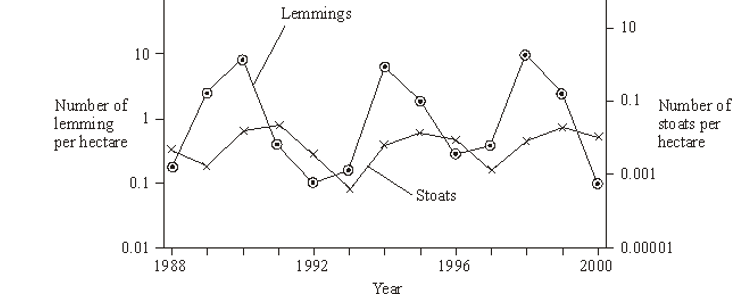
Lemmings are small mammals which live in the Arctic. Their main predator is the stoat, a small carnivorous mammal, which feeds almost entirely on lemmings. The graph shows the changes in the numbers of lemmings and stoats from 1988 to 2000.
Describe and explain the changes which occur in the lemming and stoat populations. (6)
4 year cycles (1)
Predator peaks after preys (1)
Lemmings increase due to low number of stoats (1)
More food for stoats so number increases (1)
Increased predation reduces number of lemmings(1)
Number of stoats decrease due to lack of food (1)
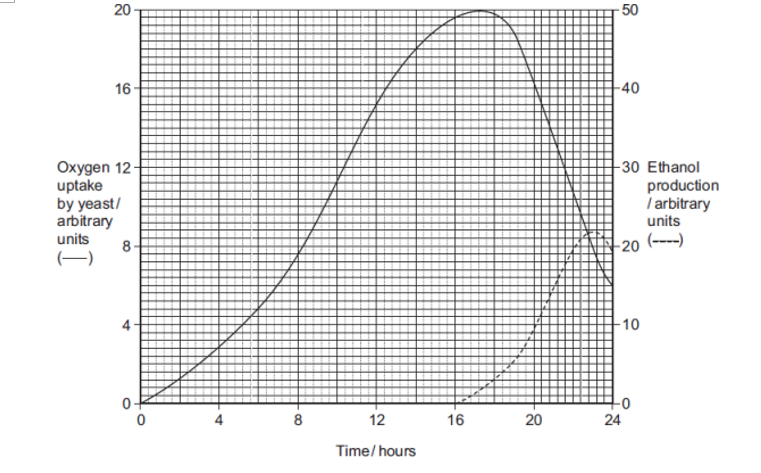
Yeast is a single-celled organism. A student investigated respiration in a population of yeast growing in a sealed container. His results are shown in the graph.
Use the information provided to explain the changes in oxygen uptake during this investigation. (3)
Aerobic respiration (1)
Increase in uptake (of oxygen) with growth/reproduction of yeast cells (1)
oxygen becomes limiting (1)
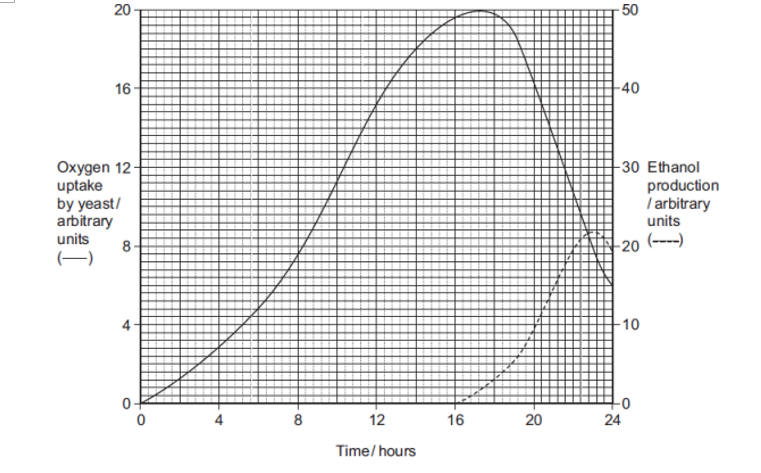
Yeast is a single-celled organism. A student investigated respiration in a population of yeast growing in a sealed container. His results are shown in the graph.
Use the information provided to explain the changes in production of ethanol during this investigation. (2)
Ethanol is produced from anaerobic respiration (1)
Ethanol increases as oxygen decreases (1)
Lettuce is classified in the same family as dandelions. Dandelions commonly grow on roadside verges and may accidentally by sprayed with salt when salt is added to the road in water.
Describe how you could use a transect to investigate whether the distribution of dandelions changed with increased distance from the road (4)
Lay rope at right angle (1)
Take samples at regular/stated intervals (1)
Using a quadrat (1)
Count numbers/percentage cover of dandelions (1)
Describe how you would use the necessary data to estimate the size of a population by the mark-release-recapture technique (3)
Capture, count and release (1)
Carefully mark to avoid detection (1)
Recapture, count marked and unmarked (1)
In recent years some hedgerows have been replanted. Ground beetles, which are unable to fly, are predators of crop pests. The beetles overwinter in the shelter of grasses at the base of the hedgerow. In some large fields, a permanent strip of grass is left as shown in the diagram.
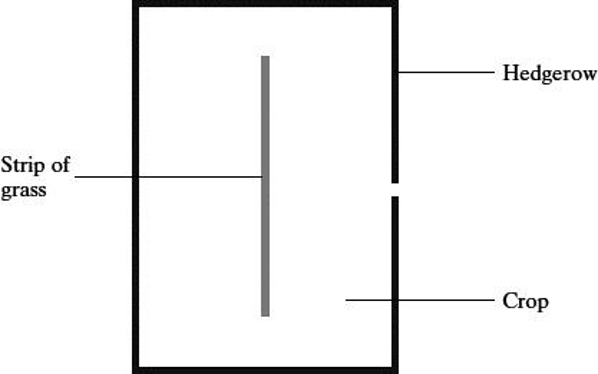
Suggest and explain the advantage of leaving the strip of grass in the middle of the field.(2)
It allows beetles to survive over winter in the middle of the field (1)
The grass strip allows the beetles to reach all parts of the field (improving their distribution (since they can’t fly) (1)
In recent years some hedgerows have been replanted. Ground beetles, which are unable to fly, are predators of crop pests. The beetles overwinter in the shelter of grasses at the base of the hedgerow. In some large fields, a permanent strip of grass is left as shown in the diagram.
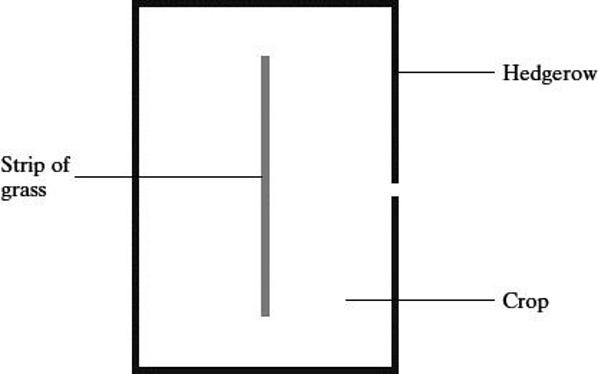
Apart from providing a habitat for predators of crop pests, give two biological benefits of replanting hedgerows. (2)
increases biodiversity (1)
source of food for animals (1)
The National Vegetable Research Station stores a collection of seeds from many species and varieties of vegetables. These include old and rare varieties.
Why is it important to keep seeds from old and rare varieties of vegetables? (2)
greater genetic diversity in old varieties (1)
old varieties useful for future breeding programmes (1)
The National Vegetable Research Station stores a collection of seeds from many species and varieties of vegetables. These include old and rare varieties.
Every few years, seeds of each variety in the collection are germinated and grown into mature plants. New seeds obtained from these plants are added to the collection.
Suggest why it is necessary to obtain new seeds every few years. (1)
Seeds lose viability after long storage(1)
Ecologists investigated succession in some abandoned crop fields. The data that they collected are shown in the graph. The curves show the trends that occurred over a period of 60 years
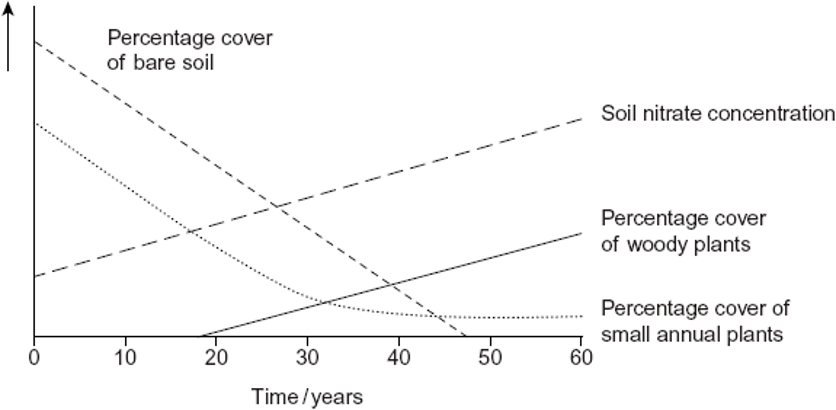
The pioneer plants had different characteristics from the plants that colonised the fields after 50 years. The pioneer plants had seeds that germinate better when the temperature fluctuates.
Explain the advantage of this to these pioneer plants.(2)
Bare soil temperatures fluctuate (1)
More bare soil at the start of succession (1)
Explain the advantage to a plant that colonises after 50 years of having a high rate of photosynthesis at low light intensities (1)
They can survive in the shade (1)
Ecologists investigated succession in some abandoned crop fields. The data that they collected are shown in the graph. The curves show the trends that occurred over a period of 60 years
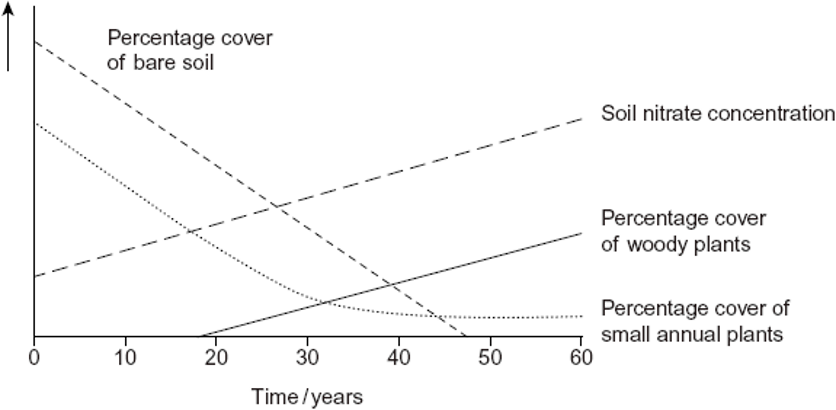
Conservation of grassland habitats involves management of succession. Use the data in the graph to explain why.(2)
Grassland consists of small annual plants which will be outcompeted by woody plants (1)
So these woody plants must be removed (1)
Explain what is meant by succession (2)
Change in community over time (1)
due to change in abiotic factors (1)
Explain what is meant by a climax community (1)
stable community (1)
The diagram shows a number of stages in an ecological succession in a lake.
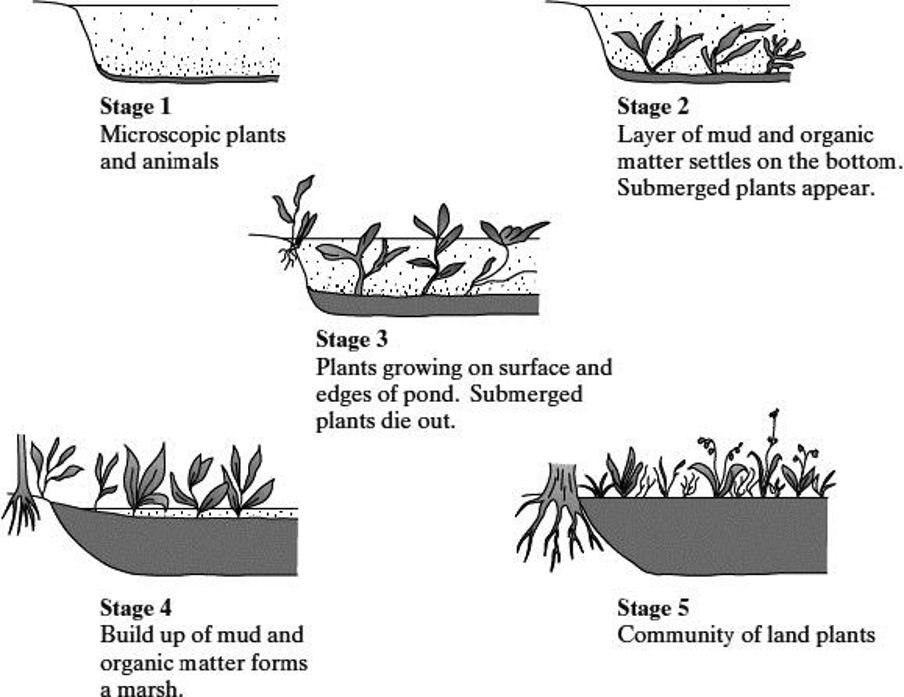
Explain how the diagrams illustrate the features of an ecological succession. (6)
colonisation/pioneering (1)
microscopic plants at start (1)
death/decomposition (1)
increase in organic matter (1)
New species colonise once there is a change (1)
Increase in number of species/increase in total amount of living material (1)
Several small rivers flow into this lake. These rivers flow through forested areas.
Explain how deforestation might affect the process of succession in the lake. (2)
soil erosion occurs due to removal of forest cover (1)
more nutrients for plants to grow in lake (1)
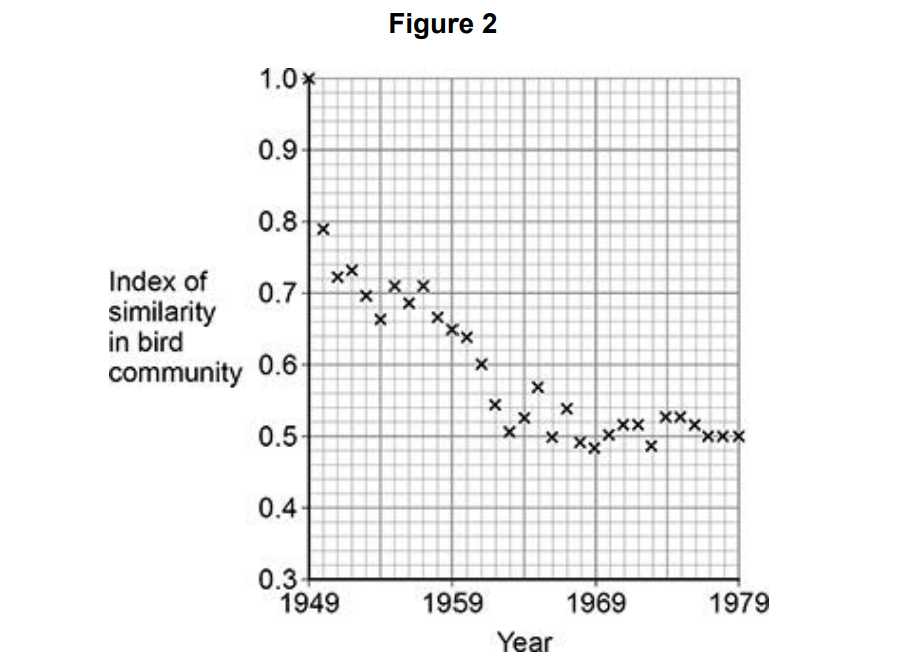
In this woodland, the ecologists measured the similarity in the bird community by comparing each year to 1949 using an index of similarity. This index ranges from 1.0 for total similarity to 0.0 for total dissimilarity. Figure 2 shows their results.
Suggest how the changes in the index of similarity in the bird community provide evidence for the process of succession. (2)
(the bird community) becomes less similar (to the first year) (1)
(suggesting) biodiversity has increased due to changes in the woodland (1)