Lecture 6: Preferences, Identity, Social Norms, and Occupations
 Call Kai
 Learn
 Practice Test
 Spaced Repetition
 Match
 Flashcards
 Knowt Play
1/29

There's no tags or description
Looks like no tags are added yet.
30 Terms
Section 1: 4 studies Identity and social norms
Study 1: Akerlof & Kranton (2002)- how does identity fit into economic theory?
Claim of paper
Identity can account for phenomena that current economic models can’t explain (why would someone opt into a higher paying job versus a lower paying one?)
social norm
a pattern of standard behavior within a society, shared belief of what is “normal.” non-outcome oriented.
identity
“sense of self”
Gender utility function and identity self image function

Variables within the above function and their meaning

How do people maximize their utility in this model?

3 examples/illustrations of identity playing a role in utility

Study 2: Gneezy, Niederle, and Rustichini (2003) Are there differences between men and women in how they perform under competition?
Context for the study
asks the simple question: do women perform worse than men in competitive settings? If they indeed do perform worse, then that could translate into women having lower-profile jobs, lower-paying jobs, or both. In this way, any differences in “competitiveness” may explain part of the observed gender gap in earnings.Compared college aged men versus women while solving puzzles on a computer first in a noncompetitive environment, then in single sex and mixed tournaments
Conclusion from study
men do equally well whether they are in a single sex or mixed tournament, gender composition did not seem to affect them.
Women do better when they compete but only when competing against other females (composition effects them!)
Inadequacies in this study
1) relatively small sample size
2) task may be gender biased (in this time periods men were predominately the ones indulging in computer games).
3) Does performance on this task necessarily equal performance (?)
4) stereotype threat (psychological phenomenon where the anxiety of accidentally confirming a negative stereotype about one's social group causes an individual to underperform.)
Follow up on the study attempting to assess if type of task mattered (Gunther et al. 2010)
go to office hours and fill in

Study 3: Gneezy & Rustichini (2004)- At what age do the differences emerge?
Basics of the study
setting: elementary school in Israel
Task: running in regular gym class
R1: run by yourself, R2A: Run by self again (control)m R2B: Run in matched pairs.
Results

Conclusion of the study and pros and cons of this experiment style
Conclusion: This research confirms that competition improves performance of boys but worsens that of girls.
Pros of this experiment: children did not know it was an experiment, no prize offered and based on “intrinsic” motivation, early age makes social norms and stereotype have less of an effect.
Cons: competitiveness versus outcomes, no incentive, not strong enough to completely rule our socialization!
Study 4: Anderson et al. (2013) Is this driven by “nature” or the society?
Context of the study
is social context important to shaping performance? Do women shy away from competition due to the patriarchal structures in place?
Analyzed if individuals opted into a competition of throwing a ball into hoop amongst 2 Indian tribes
Khasi tribe= matrilineal
Kharbi tribe= patriarchal
Results
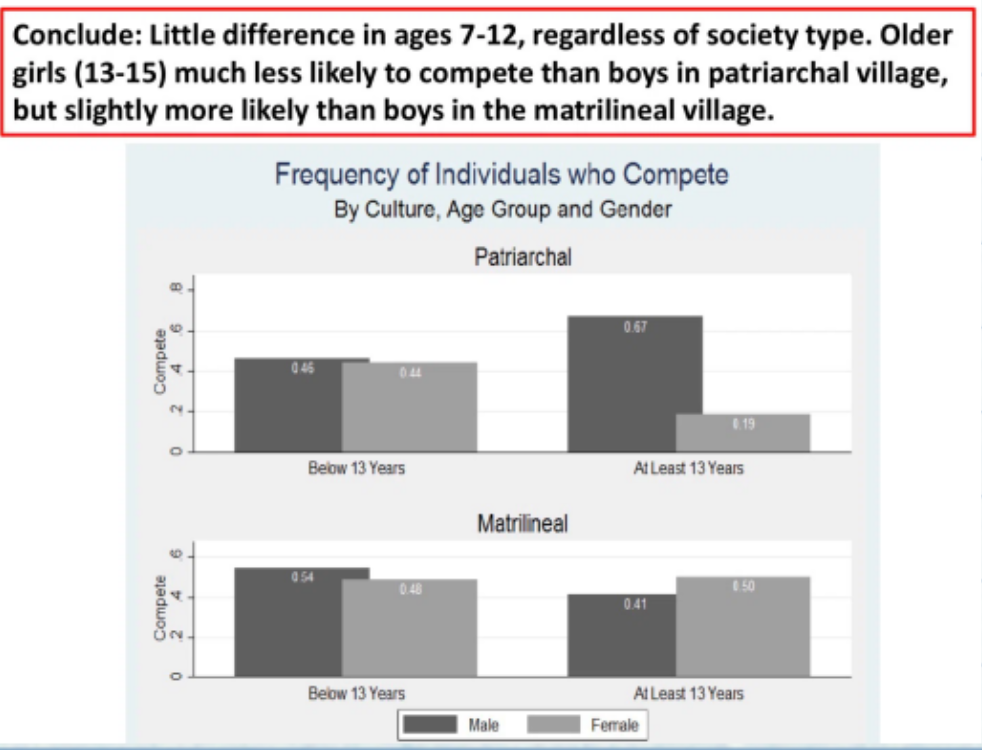
Conclusion
Boys were more likely to choose the competitive option after age 13 in the patriarchal environment whereas girls were less likely to do so. This discrepancy does not happen in the matrilineal environment.
Indicated strong role of socialization & culture.
TOPIC 2: OCCUPATIONAL SEGREGATION
Occupational Segregation
Describes the division of male vs. female intensive occupations (eg. carpenters vs. teachers).
Men are more likely to be in professional occupations(teachers, nurses, social workers) and administrative occupations.
This has changed overtime, now women are entering managerial and professional positions to a much greater extent than before the 1970s.
figures

Measuring occupation segregation- Duncan Index of Segregation (SI)
(formula in the image is aggregated across 400 occupations)
SI= 0 if occupational distribution of men and women is identical
SI= 100 if all occupations are completely male or female
Mi= % of men in occupation i
Fi= % of women in occupation i

What does SI tell you intuitively
SI tells you what percent of workers from one group (men or women) would have to change occupations to achieve equal distributions.
What 2 factors causes the index to shift?
1) change in sex composition of occupations
2) Shiftin occupation mix of the whole economy
How does SI change for broadly defined versus narrowly defined labor categories?
Narrowly defined labor categories are preferred so important heterogeneity is not masked (more precise and less prone to "aggregation bias.")
SI is larger
Graphical representation
Note: the index of segregaition began to stagnate around 50% in the 2000s roughly
