hbs 301 exam 2
 Call Kai
 Learn
 Practice Test
 Spaced Repetition
 Match
 Flashcards
 Knowt Play
1/93

There's no tags or description
Looks like no tags are added yet.
94 Terms
literature
a body of related work on a topic that is transmissible
literature review
a systematic examination and interpretation of literature for the purpose of informing further work on the topic; uses existing research to understand what new research is going to explore
peer review
process by which experts in a field evaluate a scholarly work to assess its quality, validity, and contributions before it is published or funded
mechanism for “vetting” the quality of work and enables the cumulative nature of science
types of peer review: blind review (single blind)
reviewers know who the author is, but the author does not know who the reviewers are
types of peer review: double-blind review
neither the author nor the reviewers know each other’s identities (most common in academia)
types of peer review: triple-blind review
in addition to author and reviewer anonymity, the editor handling the submission also does not know the author’s identity during the review process
research database
an organized collection of scholarly sources (journals, articles, and books) that can be searched electronically to find reliable info for academic or professional research
research question
a clear, focused, and specific inquiry that identifies the main issue a study seeks to answer, guides the research design, determines what data to collect, and shapes the analysis to gain new understanding or insights
theories
when we put concepts together and specify the way they fit together
specifying an explanation with fariables
independent variable x, dependent variable f(x) = y
operationalization
deciding how to record empirical observations of the occurrence of an attribute or a behavior using numerals or scores
substantive view of democracy
classify political regimes in terms of the outcomes they produce
procedural or minimalist view of democracy
classify political regimes in terms of their institutions or procedures (dahl’s view — multidimensional concept)
conditions: democracy-dictatorship
a country is a democracy if:
a chief executive is elected
the legislature is elected
there is more than one party competing in elections (“contestation”)
there has been an alternation in power under identical electoral rules
if these conditions are not satisfied, the country is a dictatorship
measure of democracy: democracy-dictatorship
dichotomous variable, minimalist
retrospective measure of democracy — cannot observe many of the conditions in real time
contestation
occurs when there is an opposition that has some chance of winning office as a consequence of elections
conditions for contestation
ex ante uncertainty: outcome of the election is unknown before it takes place
ex post irreversibility: the winner of the election actually takes office
repeatability: elections occur at regular and known intervals
conditions: polity
provides an annual evaluation of democracy and autocracy in a 10-point scale
democracy score minus autocracy score = polity score
score of 6 to 10 = democracy
score of -5 to 5 = mixed regime
score of -6 to -10 = dictatorship
attributes measuring polity
competitiveness of executive recruitment
openness of executive recruitment
executive constraints/decision rules
regulation of political participation
competitiveness of participation
anocracy
a form of government that mixes democratic and autocratic features, functioning as a partial democracy or hybrid regime located between democracy and dictatorship
open (1 to 5): democratic features outweigh autocratic
closed (-5 to 0): autocratic features outweigh democratic
conditions: freedom house
annual evaluation of the state of “global freedom”, not democracy
political rights — ability to vote and compete for office, etc
civil rights — free speech, etc
measures of democracy: freedom house
classifies countries as free, partly free, and not free
ordinal variable
levels of measurement
describe the amount of precision associated with a variable and the mathematical properties of the variable
nominal
describes variables that indicate a difference between categories
implies a difference in “kind” or “type”
very little precision, cannot be used with many statistical tools
example: marital status, eye color
dichotomous
subset of nominal, only two outcomes
example: gender (male / female)
ordinal
categories may be ranked in order, in addition to indicating differences between categories
implies a difference in “rank” or “order”
more precision and can be used with more statistical tools
example: education levels, likert scale
interval
includes all information of the preceding levels and adds meaningful intervals between values of the variable, but does not use a meaningful zero; cannot multiple or divide them
adds precision and can be used with most statistical tools
example: temperature (F) — 80 degrees is not “twice as hot” as 40 degrees
ratio
includes all information of the preceding levels and adds meaningful intervals between values of the variable, including a meaningful zero
most precise, can be used with most statistical tools
example: weight, age
nominal and ordinal variables
should be exhaustive and exclusive
exhaustive
all possible categories accounted for
exclusive
a single value can only fit into one category at a time, categories are distinct and do not overlap
experimental research design
good for isolating causal factors (does the independent var. actually impact the dependent var.?)
limitations to public affairs experiments
expensive, trying to study things that can’t be tested experimentally — ethical tensions / constraints or something else
often suffer from weak external validity
advantages of public affairs experiments
excellent internal validity
allows causal inferences to be made with a higher level of confidence — control over exposure to an experimental treatment
high degree of confidence in replicability, accurate representation of relationships
internal validity
the degree to which changes in the outcome are caused exclusively by the independent variable rather than outside factors
external validity
the degree to which study findings can generalize to other people, settings, and real-life environments
basic features of experimental design
at least one experimental group and one control group
randomly assigned individuals to each group, avoiding self-selection
controlled administration of treatment, including circumstances under which the experimental group is exposed
measurement of dependent variable before and after the treatment is administers (pre and post test)
pre-test averages should be the same for control and experimental groups if true randomization was sued
controls the environment from the experiment (time, location, and other physical aspects)
impacts to internal validity
history: events (other than treatment) that occur between pre and post test
maturation: change in subjects over time that might produce differences in experimental and control groups
test-subject interaction: process of measuring the dependent var. prior to the experimental stimulus may affect posttreatment scores
selection bias: volunteers differ from nonvolunteers
experimental mortality: dropouts are likely not randomly distributed
demand characteristics: participants may guess the investigator’s goals
alternative experimental designs: post-test
shares the characteristics of the classical randomized experiment, except no pre-test is used; sample is truly random and sufficiently large that one can assume control/experimental groups are equivalent
alternative experimental designs: repeated measurement
adds additional pre-tests, post-tests, or both in an effort to measure long-term effects of experimental treatments
alternative experimental designs: multiple groups
a modification of the classic example where more than one experimental group is created to compare the effects of different treatments
alternative experimental designs: field experiments
experiment is in a natural setting in which the investigator does not have control over group membership but does have control over one or more independent variables
research design
a plan of action for executiving a research project, specifying:
a theory or hypothesis to be tested
unit of analysis
necessary observable data
research designs attempt to
establish a relationship between one or more variables
establish whether one phenomenon precedes another in time
eliminate as many alternative designs as possible
demonstrate that the results are generally true
characteristics of causal relationships
covariation: alleged cause varies with the supposed effect
time order: cause precedes the effect in time
isolation: elimination of alternative explanations isolate the causation to one factor
correlation
two things are related, but variation in one may not lead to variation in another
causation
implies that variation in one variable leads to variation in the other
spuriousness
two things are related, but variation in one does not lead to variation in another
Z causes X, Z causes Y —> X and Y trend together (therefore they are related), but they are not causal
validity in measurement
accuracy results
example: bullseye
reliability in measurement
likelihood of someone with the same information to reach the same conclusion
valid and reliable
centered on the bullseye
clustered on the bullseye over multiple attempts or trials
valid but not reliable
no cluster
one or few are centered
reliable but not valid
tight cluster
off-center
measures of central tendency
mean: average value
median: middle value
mode: most frequently occuring value
median
describes middle value in an ordered set of values, order of observations is important
resistant to outliers
only includes one value
mean
describes the average value
not resistant to outliers
computed using all values
mean notation
population: μ
sample: x bar
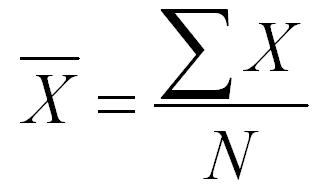
x bar (sample mean) = sum (sigma) of all values in a dataset (X) divided by the number of values (N)
mean
dispersion
how data is distributed over a range of possible outcomes
univariate (descriptive) statistics
look at one variable at a time
skewness
determines whether the mean or median is an appropriate measure of central tendency
how “lopsided” a sample distribution is compared to normal
outliers
values that do not need to go with the others
concentration
relative frequency of occurrence of a score
average deviation
0
graph is undefined at zero

standard deviation formula
STATA command: kdensity variable
displays kurtosis
STATA command: clear
clears the current dataset
STATA command: cd
changes working directory
STATA command: di
display
prints text, numbers, or results of a calculation in the Results window
STATA command: dir
lists the files in current working directory
STATA command: exit, clear
closes stata, discards any unsaved data in memory
STATA command: help
opens documentation for the command, shows syntax and options
STATA command: import delimited
reads a delimited text file into stata — like a .csv
STATA command: log
opens a log file
ex: log using filename
STATA command: log close
stops recording commands/output and saves the log file
STATA command: set obs
sets the number of observations (rows) in an empty dataset
STATA command: use
loads an existing dataset (.dta) into memory
STATA command: append
stacks another dataset beneath the current one, adding more obs.
STATA command: drop
removes variables or observations from the dataset
STATA command: generate
creates a new variable
STATA command: label variable
attaches descriptive label to a variable
STATA command: merge
joins one dataset to another by matching observations with a key variable and adding more variables (columns)
STATA command: rename
changes a variable name
STATA command: replace
changes the value(s) of an existing variable
STATA command: correlate
calculates the correlation coefficients between two or more variables
STATA command: describe
shows the structure of a dataset
STATA command: graph twoway
creates two-variable graphs like scatterplots and line plots
STATA command: histogram
draws a histogram showing distribution of a single variable
STATA command: summarize
reports summary statistics for numeric variables like mean, s.d., min, max
STATA command: tab
tabulate
produces a frequency table for one variable or a cross-tabulation for two
STATA command: ttest
tests whether a mean differs from a given value or whether two group means differ from each other
.smcl
log file
.dta
data file, data frame, data matrix
.do
do file, script file, replication file