AP Stats Unit 2
 Call Kai
 Learn
 Practice Test
 Spaced Repetition
 Match
 Flashcards
 Knowt Play
1/25

There's no tags or description
Looks like no tags are added yet.
26 Terms
Two Way Table/Contingency Table
A table of counts describing two categorical variables

Joint Relative frequency
An individual cell frequency divided by the table total
For example: 45/150
Marginal relative frequency
A proportion describing a category from one variable (one table margin)
Calculated by dividing a column or row total by table total
For example: 70/150
Side by Side Charts
Allows you to compare the frequencies or relative frequencies of categories between two groups
Conditional Relative Frequency
A proportion of a subgroup that meets a certain condition
Calculated by dividing an individual cell by a row total or column total
For example: 30/75
Segmented Bar Charts & Mosaic Plots
Compare proportions or percentages between groups
See how the distribution of one variable changes depending on the other
Identify patterns and differences among categories
Describing Associations
Make a claim (there is/isn’t an association)
Support by comparing percentages between groups
Include context (mention variables)
Sample Space
Set of all possible outcomes
Event
A collection of outcomes
Probability formula
Probability = # of outcomes in an event/# of total possible outcomes
Probability
The relative frequency of an out come after many trials
Probabilities are between 01
P(R)+ P(B) = 1
Law of large numbers
After many trials, the relative frequency of outcomes will approach their probability
Simulation with replacement
Adding back a possibility.
For example: Picking out a marble and putting it back
Simulation without replacement
Taking away a possibility.
For example: Picking out a marble and leaving it out
The probability of an Event Not Happening Equation
(P(E)+P(E^c)=1
Ven diagrams
Upside Down (U): And
C: Probability of event … not occurring
Upper Case (U): Or
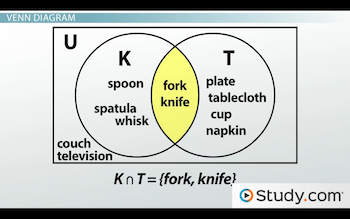
Mutually Exclusive Events/Disjoint events
When events cannot occur at the same time.
Condition
A “given” in a problem
Conditional Probability Formula
Probability that … will occur given that … has already occurred

Multiplication Rule Formula
Before going straight to the formulas, first try solving using you reasoning skills and the Keys to Probability

Keys to Probability
Draw it first
Divide by givens
Multiply by the ‘ands’
Add the ‘ors’
Tree Diagrams
Show all possible outcomes of events
Calculate the probability of different outcomes

Independence
Two events (A&B) are independent if knowing the outcome of one event does not affect the probability of the other event
Addition Rule Formula

Associtation
Two variables are related
Association does not mean CAUSATION
Causation
One variable directly causes a change in another