BIO 180 Quiz 1
 Call Kai
 Learn
Learn Practice Test
 Spaced Repetition
 Match
Match Flashcards
 Knowt Play
1/45

There's no tags or description
Looks like no tags are added yet.
Name | Mastery | Learn | Test | Matching | Spaced | Call with Kai | Chat |
|---|
No analytics yet
Send a link to your students to track their progress
46 Terms
What are some advantages of the bar chart over the histogram?
bar charts allow for easier comparison
cleaner
standard deviation (how close the data is)
test 80% if the standard error is +/2 then the average test scores is from 78%-82%
What are some advantages of the histogram over the bar chart?
see + understand data better
showing more data when graphing is always improtant
What is a null hypothes?
There is no statistical difference between the groups being studied
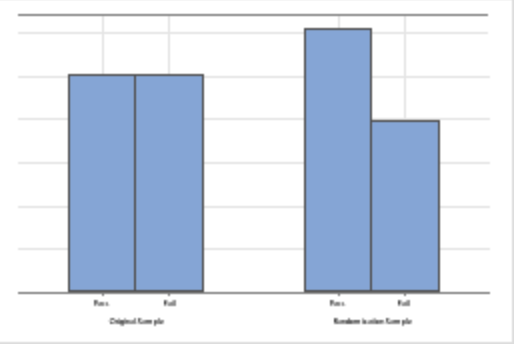
What does cannot reject the null hypothesis mean?
What does can reject the null hypothesis mean?
There is no statistical difference between the data of the groups being studied
There is enough statistical difference between the data of the groups being studied
p-value
Likelihood of obtaining your results
p-value < 0.05: the data is significant (a smaller # means there is a smaller chance of confounds)
Reject the null

What do overlapping standard error bars mean?
overlapping: cannot reject the null
non-overlapping: can reject the null
Standard Error calculations
p = sample proportion (percent)
ex: .36 = 36"%
n = number of individuals being tested

How does sample size effect standard error?
as sample size goes up, standard error always goes down
Graphing tips:
Show as much data as possible (histograms)
If a bar graph is used, add points
Simplify when appropriate; provide enough information for the general audience to understand
Dependent variable: y-axis
Independent variable: x-axis
Darwin’s Theory of Natural Selection (4 Postulates)
Variation: individuals in a population are variable
Inheritance: some of this variation are passed on to offspring
excess reproduction: not all individuals produce the same number of offspring
Differential success: individuals with certain heritable traits produce the most offspring
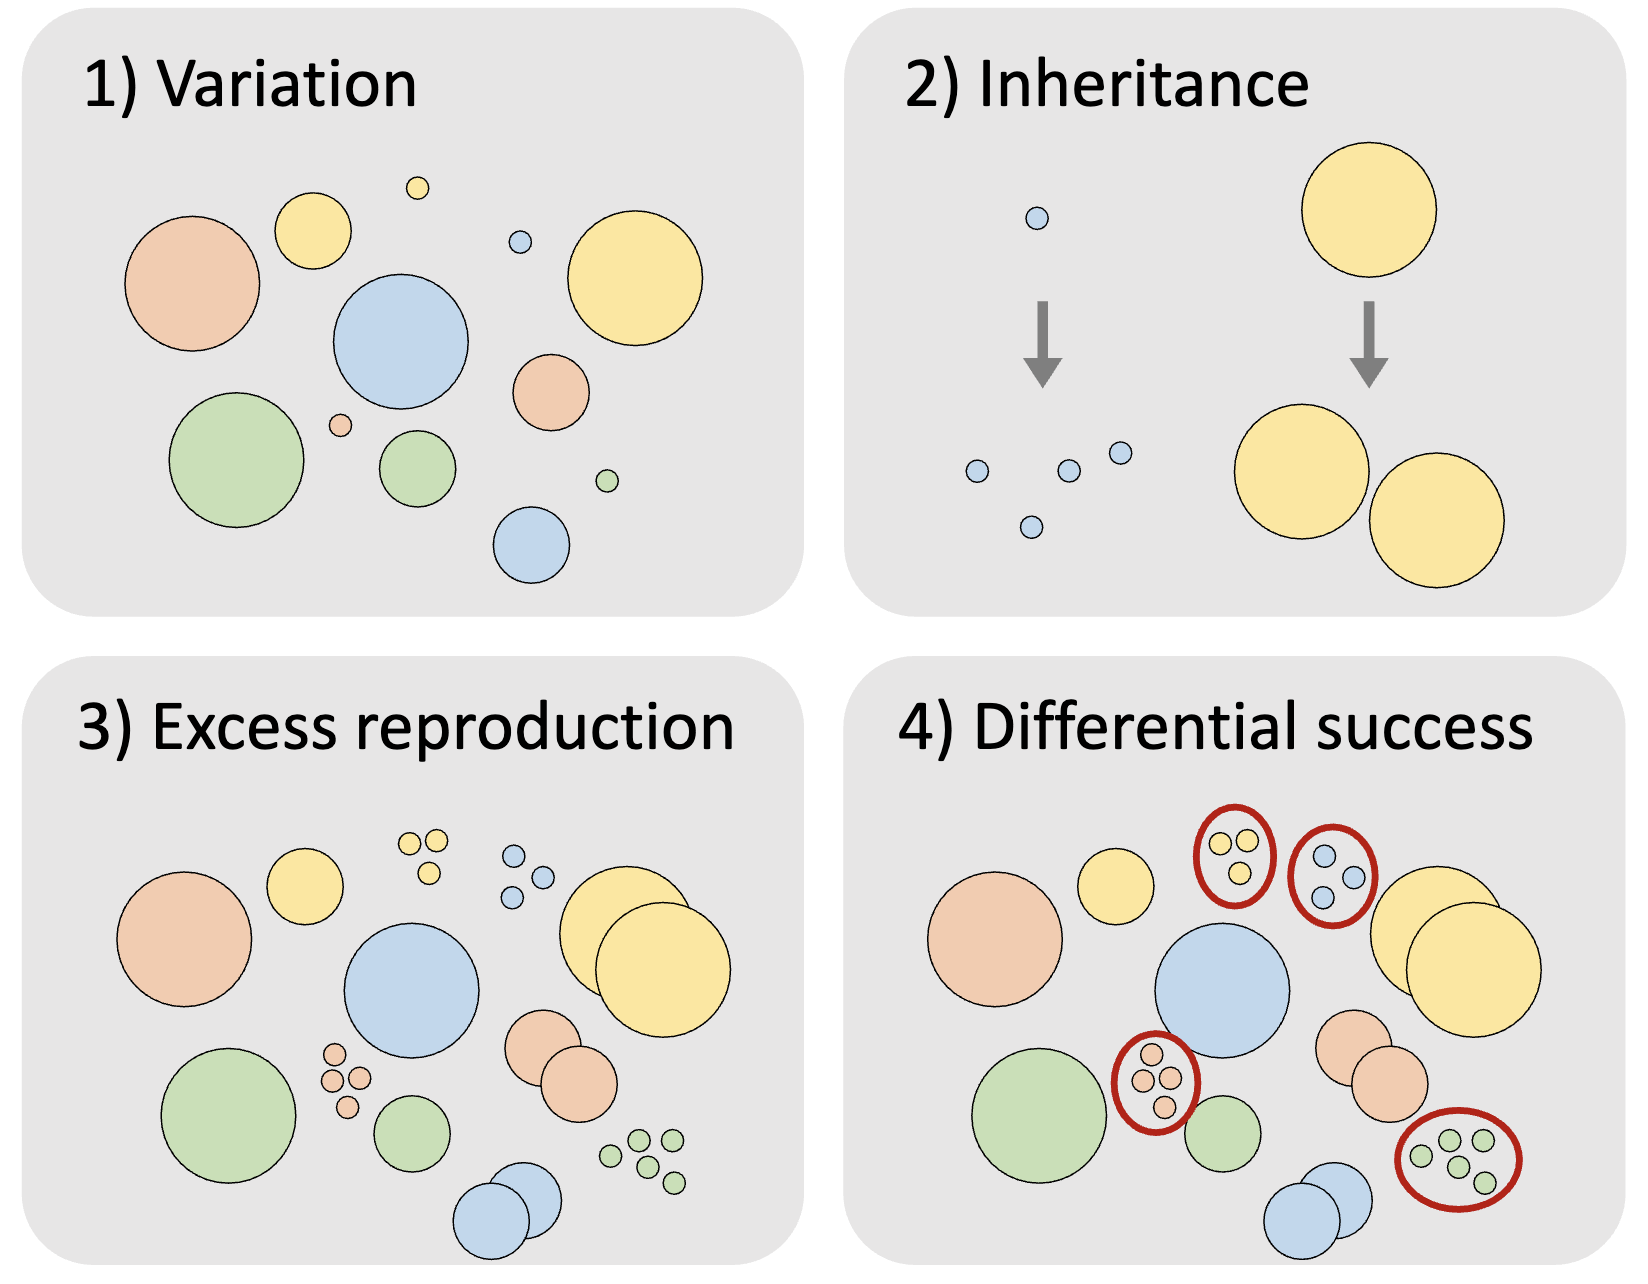
Natural selection occurs when 1. leads to 2.
heritable variation
differential reproductive success
the outcome of this process is evolution: a change in frequencies across generations
Blending inheritance vs Mendelian inheritance
Blending inheritance: crossing a black bunny with a white bunny results in a grey bunny
Mendelian inheritance: certain biological traits are passed down from parents to offspring through a single gene
Proves genes are particulate: genes act like individual, independent particles passed completely intact
How did Gregor Medal discover that blending inheritance wasn’t correct?
After crossing a tall pea plant with a dwarf pea plant, the entire generation was tall pea plants
50% HH 50% Hh
After crossing the F2 generation, 75% of the offspring were tall, and 25% of the offspring were short
AA, Aa, Aa, aa
The reappearance of the dwarf pea gene was evidence that genes were particulate and were passed as independent particles
Homozygote, heterozygote
Describe the combination of alleles an organism inherits from its parents
Homozygous: same XX
Heterozygous: Xx
Explain: Each individual has two copies of each gene?
Every offspring gets one variant of a gene from the mother and one from the father
BB
Bb
bb
One allele from either parent: B vs b
What is a quantitative trait?
Traits that don’t fall into discrete categories but are measured on a continuum (continuous variation)
Skin color, height, IQ + cognitive ability
phenotype and genotype
Genotype: the genes
TT
Phenotype: physical appearance
TT: tall
What does a haploid number mean?
What does ploidy mean?
The number of different types of chromosomes
diploid (2), triploid (3)
The number of copies of chromosomes

1.blank n = 2.blank
1 = ploidy
n = haploid
2 = total number of chromosomes
Mitosis
a process of cell division where a single cell divides to form two genetically identical daughter cells
Prophase, Metaphase, Anaphase, Telophase (Mitosis)
DNA packs tightly together into visible chromosomes
The chromosomes line up perfectly down the middle of the cell
The matching chromosome pairs are pulled apart and move towards opposite sides of the cell
Two new nuclei form around the separated sets of DNA
Which of the following has properly labelled DNA?
3
The chromosomes are identical, and the alleles on both sides of the chromatid are the same
sister chromatids must be identical
Draw: Original cell is 2n=4 with genotype AaBb
2 identical diploid cells
Meiosis
a type of cell division that reduces the chromosome number by half to create four genetically unique haploid cells
Prophase I, Metaphase I, Anaphase I, Telophase I (Meiosis I)
Prophase I: the most crucial step for genetic diversity
Crossing over: homologous chromosome pairs find each other and trade random chunks of DNA
This shuffles the alleles so that a single chromatid might end up with a mix of maternal and paternal traits
Metaphase I: the chromosomes line up down the center of the cell in pairs
Random assortment: the chromosomes randomly line up down the middle of the cell
Anaphase I: the pairs are pulled apart. The blue chromosome goes to one side, and the red chromosome goes to the other
segregation (separation): the parent cell separates its two copies of a gene so that each sperm or egg receives one allele
Telophase & Cytokinesis I: the cell splits; you now have two haploid cells, but the chromosomes inside them are still duplicated X shapes
Prophase II, Metaphase II, Anaphase II, Telophase II (Meiosis II)
Meiosis II is similar to meiosis I, except there is no DNA replication
Metaphase II: The individual X chromosomes line up down the middle of the cell
Anaphase II: the identical sister chromatids are finally pulled apart
segregation (separation): the parent cell separates its two copies of a gene so that each sperm or egg receives one allele
Telophase & Cytokinesis: both cells split right down the middle
What is non-disjunction?
Nondisjunction is when the chromosomes fail to separate correctly during anaphase
Instead of pulling apart neatly so that each gets an equal share, chromosomes get stuck together
down syndrome
Genetic variation is a result of?
independent assortment and crossing over
autosomal (unlinked):
Genes located on non-sex chromosomes (autosomes) that either reside on different chromosomes or are far apart on the same chromosome
allowing them to segregate independently
AaBbEe


Linked chromosomes:
Different genes that are physically located close to each other on the same chromosome
They are inherited together
Ae//eE Bb or Ae//aE Bb
The slash represents linked genes
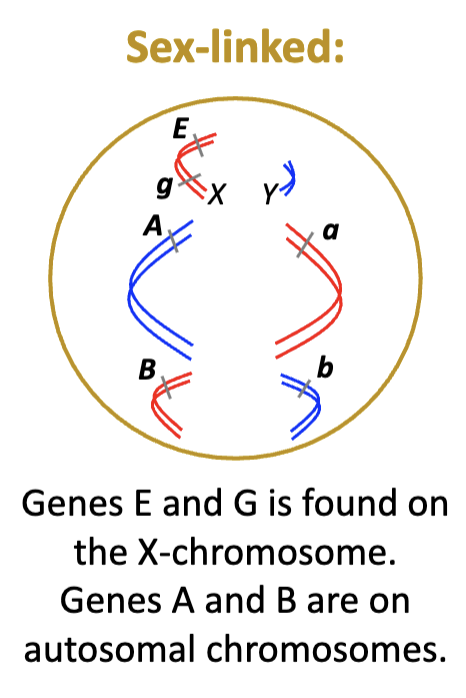
Sex-linked chromosomes:
The specific chromosomes that determine the biological sex of an organism and carry genes that dictate sex-specific traits as well as non-sex traits
XEg XeGAa Bb
XEg Y Aa Bb
Assuming NO crossing over, this fly can create which of the following gametes? BD//bd kk XRY
B D k XR (not showing they are linked)
B d k Y (not showing they are linked)
Bd/ k XR/Y (XR/Y gametes done get both)
Bd/ k Y (Bd never linked)
bd/ k XR (correct)
Describe
State relative features, characteristics, or changes
Stick to what the evidence SHOWS, not why it’s happening
The data shows that
as X increases, Y decreases
Explain
Connect a biological mechanism or cause to an outcome
Why or how does it happen?
This occurs because
Compare/Relate
Discuss both things using the same feature or criterion
If the question asks how two processes differ, merely describing one is not enough
MUST DESCRIBE BOTH
Identify a pattern
What relationship appears in the data
How do the variables change together
There is a positive relationship between X and Y
The groups differ in… with… showing …
Define
give the precise meaning of a term
X is…
State
Give a direct fact or answer, usually brief
X is..
Identify
name the relevant structure, process, variable or result
Predict
state a expected result, often using a biological principle
Justify
support a claim with evidence and reasoning
Interpret
explain what data or a result means biologically
Evaluate
asses strengths, weaknesses, or how well evidence supports a claim
One strength… but a limitation is
Answering questions about patterns and data
Name the variables
Describe the trend
Does the measured variable increase, decrease, or remain stable
Include a meaningful comparison
Explain the biology only if asked