HSCI190 Mod5
 Call Kai
 Learn
 Practice Test
 Spaced Repetition
 Match
 Flashcards
 Knowt Play
1/49

There's no tags or description
Looks like no tags are added yet.
50 Terms
ANOVA is associated with which terms?
Analysis of variance
F test
uses F ratio and F distribution to compare means of multiple groups
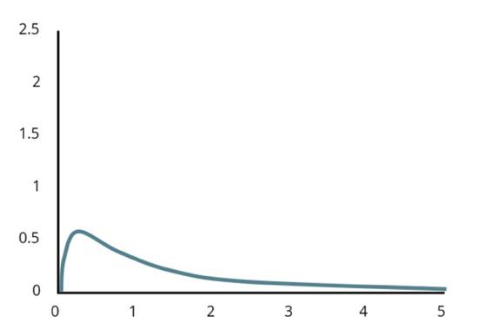
Key characteristics of F distribution?
are right/positive skewed
has only positive values
area under curve = 1
its shape is defined by df
there are 2 values for df, e.g. 5 and 2
How many df exists for F distribution? why?
one is related to the total number of groups being compared (k) minus 1, another is the total number of observations (n) minus number of groups (k)
How does df impact shape of F distribution?
as df increases, F distribution becomes less skewed (approximates normal distribution)
Define F ratio? How is it generally calculated?
the standardized value/test statistic of ANOVA
calculated by analyzing amount of variation between and within groups
What are 2 types of variation for ANOVA?
between groups
spread between sample means
within groups
variation inside each group due to sampling variability (random chance)
also called vairation due to error
the denominator for F ratio
Describe how F ratio is calculated
takes 2 sources of variance
between group variation/within group variation (error)
identifies if groups are actually different from one another or if differences are due to random chance
if variation between groups = variation within groups, it gives F = 1. This means that all samples belong to same population
if variation between groups > variation within groups, F>1.
the greater the F value…
the more variation exists between groups than within groups
likely a meaningful difference exists between the groups we’re comparing, beyond differences due to random chance/sampling variability
How are the 2 types of variation represented?
between group variation = mean square (group)
within group variation (error) = mean square (Error)

describe MS group
numerator of F ratio
made of 2 terms:
sum of squares (group): amount of variation between groups, obtained by multiplying # observations in a sample (n1) by sample mean (Xi) minus grand mean (X) squared
first degrees of freedom term: k-1

Describe MS error
denominator of F ratio
made of 2 terms:
sum of squares (within): variation within groups, obtained by multiplying the variance of that sample (s2) by the number of observations (n) in a sample minus 1.
df2: n-k

Describe ANOVA table
First column:
source of variation
second column:
shows the df for each source
third column:
sum of squares for group = variation between groups
sum of squares error = variation within groups
add these 2 together to get total sum of squares
fourth column:
mean squares
sum of the sum of squares/df
last column:
the F ratio
equivalent to mean square group/mean square error
Compare small vs. large F ratio
small: likely no differences between groups beyond random chance/accounted by sampling variability
large: more between group differences than within group differences = groups are likely different
F chart has…
2 df
columns = df1
rows = df2
critical values associated with significance level of 0.05
*different F distribution charts exist for different significance levels
*You don’t need to multiply anything by 2 since this chart gives you the critical value, not p value
*if calculated critical value > critical value in table, reject null hypothesis

Why not use multiple T tests?
with 2 groups, t tests and ANOVA give same results
with more than 2 groups:
doing too many t tests is complex (increases exponentially)
inflates type I error risk
How do ANOVAs control error?
You only do the test once, regardless of # groups
risk of type I errors remain as 5%
in ANOVAs, independent variables are also called…
grouping factors which are split into levels (number of groups within each factor)
In ANOVAs, the hypotheses are…
called the omnibus hypotheses = overall null hypothesis of no difference, alternative hypothesis of atleast 1 difference
null: all group means are equal
e.g mean hours of sleep each student gets in each year of study is equal
alternative: atleast 1 group mean is different from the others
e.g. the amount of sleep students in 1st year get is different from 2nd year
What are assumptions of one-way ANOVA?
dependent variable is scale data
data is from independent random samples
e.g. amount of sleep first year students get doesn’t impact sleep of second year students
all groups are approximately normally distributed (use Shapiro-Wilk, or visualization)
must be equal variance in each group (use Levene’s test)

How to interpret this
Shapiro wilk
all p>0.05, fail to reject null/accept null = assumptions were met = normality exists
Leven'e’s
p>0.05 = is equal variance
The null hypothesis for Levene’s and Shapiro-wilk is…
that assumptions (for normality/variance) has been met
thus, if p>0.05, you fail to reject null (retain null) = it is normal/equal variance
Unlike t tests, ANOVAs are…
robust with violations to normality and equal variance
if data is approximately normal, can still proceed with one-way ANOVA
which assumptions can never be broken with one-way ANOVA?
assumption of independence
since the probabilities for independent/dependent events are calculated differently
assumption of scale data
How would you normally calculate one-way ANOVA by hand?
find F ratio
Look up degrees of freedom using F distribution chart
compare if F value in chart to the F value you calculated
if F ratio > chart value, you reject the null and claim there are likely differences between groups. If F ratio < chart value, you fail to reject null and claim likely no differences.
What does a one-way ANOVA table not tell you?
where differences are
When to use post-hoc comparisons?
when F value calculated>F value in distribution chart, or if p<0.05
conclude there are likely differences between groups
must do post-hoc comparisons to find where
e.g. is it between all groups, group 1 vs 2. group 2 vs. 3
How do post-hoc comparisons work?
compare each group with every other group in ANOVA to identify where differences are
also called pairwise comparisons
similar to t tests, but control for type I error
examples: Bonferroni’s correction, Tukey’s HSD
What is most common post-hoc comparisons for one-way ANOVAs? how does it work?
Tukey’s HSD
merges t test and F test
compares 2 means while controlling for multiple comparisons
calculated by absolute difference between 2 group means divided by square root of mean square error, divided by number of observations


Describe the different parts of the multiple comparisons table
pairs
rows
p values are compared to a = 0.05 to determine if there’s a significant difference between each pair
in this case, a significant difference exists between years 3 and 1
95% CI may or may not contain 0
if doesn’t have 0, suggests groups are different
What is the non-parametric equivalent of one-way ANOVA?
Kruskal Wallis, repeated measures ANOVA, 2 way ANOVA
Describe Kruskal Wallis (H test)
non-parametric test
uses medians or mean ranks to compare data
distribution can be determined by median/mean rank
the type it uses depends on shape of distributions of groups being compared —> use visualization
if groups are same shape = use medians
if groups are different shapes = use mean ranks
*this doesn’t impact your results but interpretation
*always check histograms first
What are assumptions of Kruskal Wallis?
independent variable with 2+ independent groups
dependent variable can be scale/ordinal
data can be normal or skewed
How is Kruskal Wallis calculated?
2 key points:
median/mean rank
H statistic
since its similar to X2, sometimes it reports it as this
when p<0.05, you reject null
also tests the omnibus null hypothesis —> similarly, doesn’t tell you where differences are located (use Mann-Whitney U)
When to use RM ANOVA?
when you want to measure the same group multiple times or multiple dependent groups
the independent variable (e.g. student year) is comprised of dependent groups (e.g. measuring ssame students in year 1, 2, 3)
its nonparametric equivalent is Friedman
example: you measure the sleep of subjects in year 1, year 2, year 3 (same group of people)
what are 2 types of grouping factors?
between subjects
for one-way ANOVA, when there are independent groups
Example: looking at students in 1st, 2nd, 3rd year
within subjects
for one way RM ANOVA, there are dependent groups
Example: looking at same subjects in 1st, 2nd, 3rd year
How to arrange RM ANOVA data?

assumptions for one way RM ANOVA?
dependent variable is scale
observations between individuals must be independent (the amount of sleep one participant gets can have no impact on the amount of sleep of another participant)
normality must exist
sphericity: variances of differences between all combos of related groups must be equal
what is sphericity?
looks at variances of differences between groups in one way RM ANOVA
means that these are equal
use Mauchly’s test of sphericity: tests the null hypothesis that the assumption was met
p>0.05, fail to reject null = assume sphericity
For a one-way RM ANOVA, how to interpret?
you interpret F ratio in the same way
test normality
check within-subjects factors
do Mauchly’s test
look at the within-subjects effects table
what happens if sphericity is broken?
still use within-subjects effecst table
however, you present values in “greenhouse geisser” row instead
How to find where the differences are in RM ANOVA?
use Tukey’s HSD
interpreted for same way in one-way ANOVA and one-way RM ANOVA
What is Friedman test?
nonparametric equivalent for one-way RM ANOVA
also rank based
does not have assumptions on levels of measurement, normality, sphericity
What is a 2 way ANOVA?
has 2 independent variables (grouping factors) which each may have multiple levels
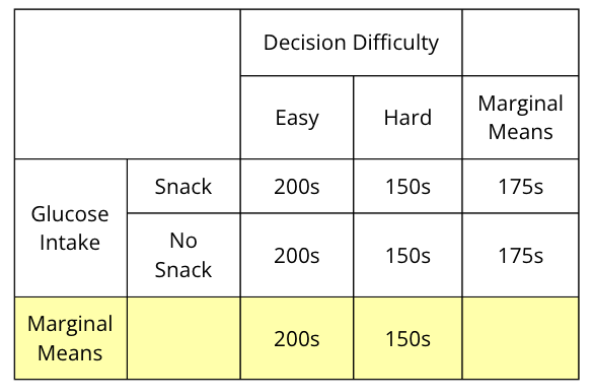
example: the difficulty of decisions and glucose intake
a 2 × 2 design
benefits: can look at impact of several different factors in 1 dataset without increasing error
What are effects in relation to 2 way ANOVAs?
2 way ANOVAs allow you to look at the effects of multiple factors on the same dataset
categorized as main or interaction effects
Main: a significant difference between groups on one factor, irrespective of other factor
Interaction effects: when 1 factor is different across the levels of another factor. the combination of factors impacts the outcome
calculated using 2 × 2 table
what does the ANOVA table show?
means, not proportions
How are main effects calculated?
look at averages across rows and columns
1. row effects
for calculating impact of first independent variable
look at differences between 2 groups on average (ignore other independent variable)
find the marginal means for the rows
no difference = likely no main effect of glucose intake
2. column effects
to calculate impact of 2nd independent variable
look at difference between 2 groups on average (ignore other independent variable)
find marginal means for columns
a difference = main effect
describe interaction effects
identified by looking at all combinations of variables and levels
if patterns of differences are equal = likely no interaction effect
no interaction effect
differences between decision groups is 50 for both snack conditions = no interactions
interaction effect
the hard, no snack combo has a different result than the rest of the combinations, suspecting an interaction effect


what effects does this show?
there is a main effect of decision difficulty and snack
no interaction effect, parallel
when is 1 way ANOVA used?
when there is an independent variable (with 3+ groups/levels) and a dependent variable (outcome measurement)
summarize when one way ANOVA, one way RM ANOVA, 2 way ANOVA, 2 way RM ANOVA, 2 way mixed ANOVA
1 way anova:
compare multiple independent groups across one grouping factor
1 way RM anova:
compare multiple dependent groups across one grouping factor
2 way anova:
compare independent groups across 2 grouping factors
there are 4 total groups (snack/easy, snack/hard, no snack/easy, no snack/hard)
2 way RM anova:
2 independent variables, both are within subject grouping factors
1 group of participants undergo 4 conditions
no nonparametric equivalent
2 way mixed anova:
1 independent variable is a between subjects grouping factor (placebo vs drug) and other independent variable is a within subjects grouping factor (prepost)