mri
 Call Kai
 Learn
Learn Practice Test
 Spaced Repetition
 Match
Match Flashcards
 Knowt Play
1/64

There's no tags or description
Looks like no tags are added yet.
Name | Mastery | Learn | Test | Matching | Spaced | Call with Kai | Chat |
|---|
No analytics yet
Send a link to your students to track their progress
65 Terms
کنترا اندیکاسیون های ام ار ای
aneurysm clips
automatic defibrillators
pacemakers generally are not approved for MR
first-trimester pregnancy
intravascular stents
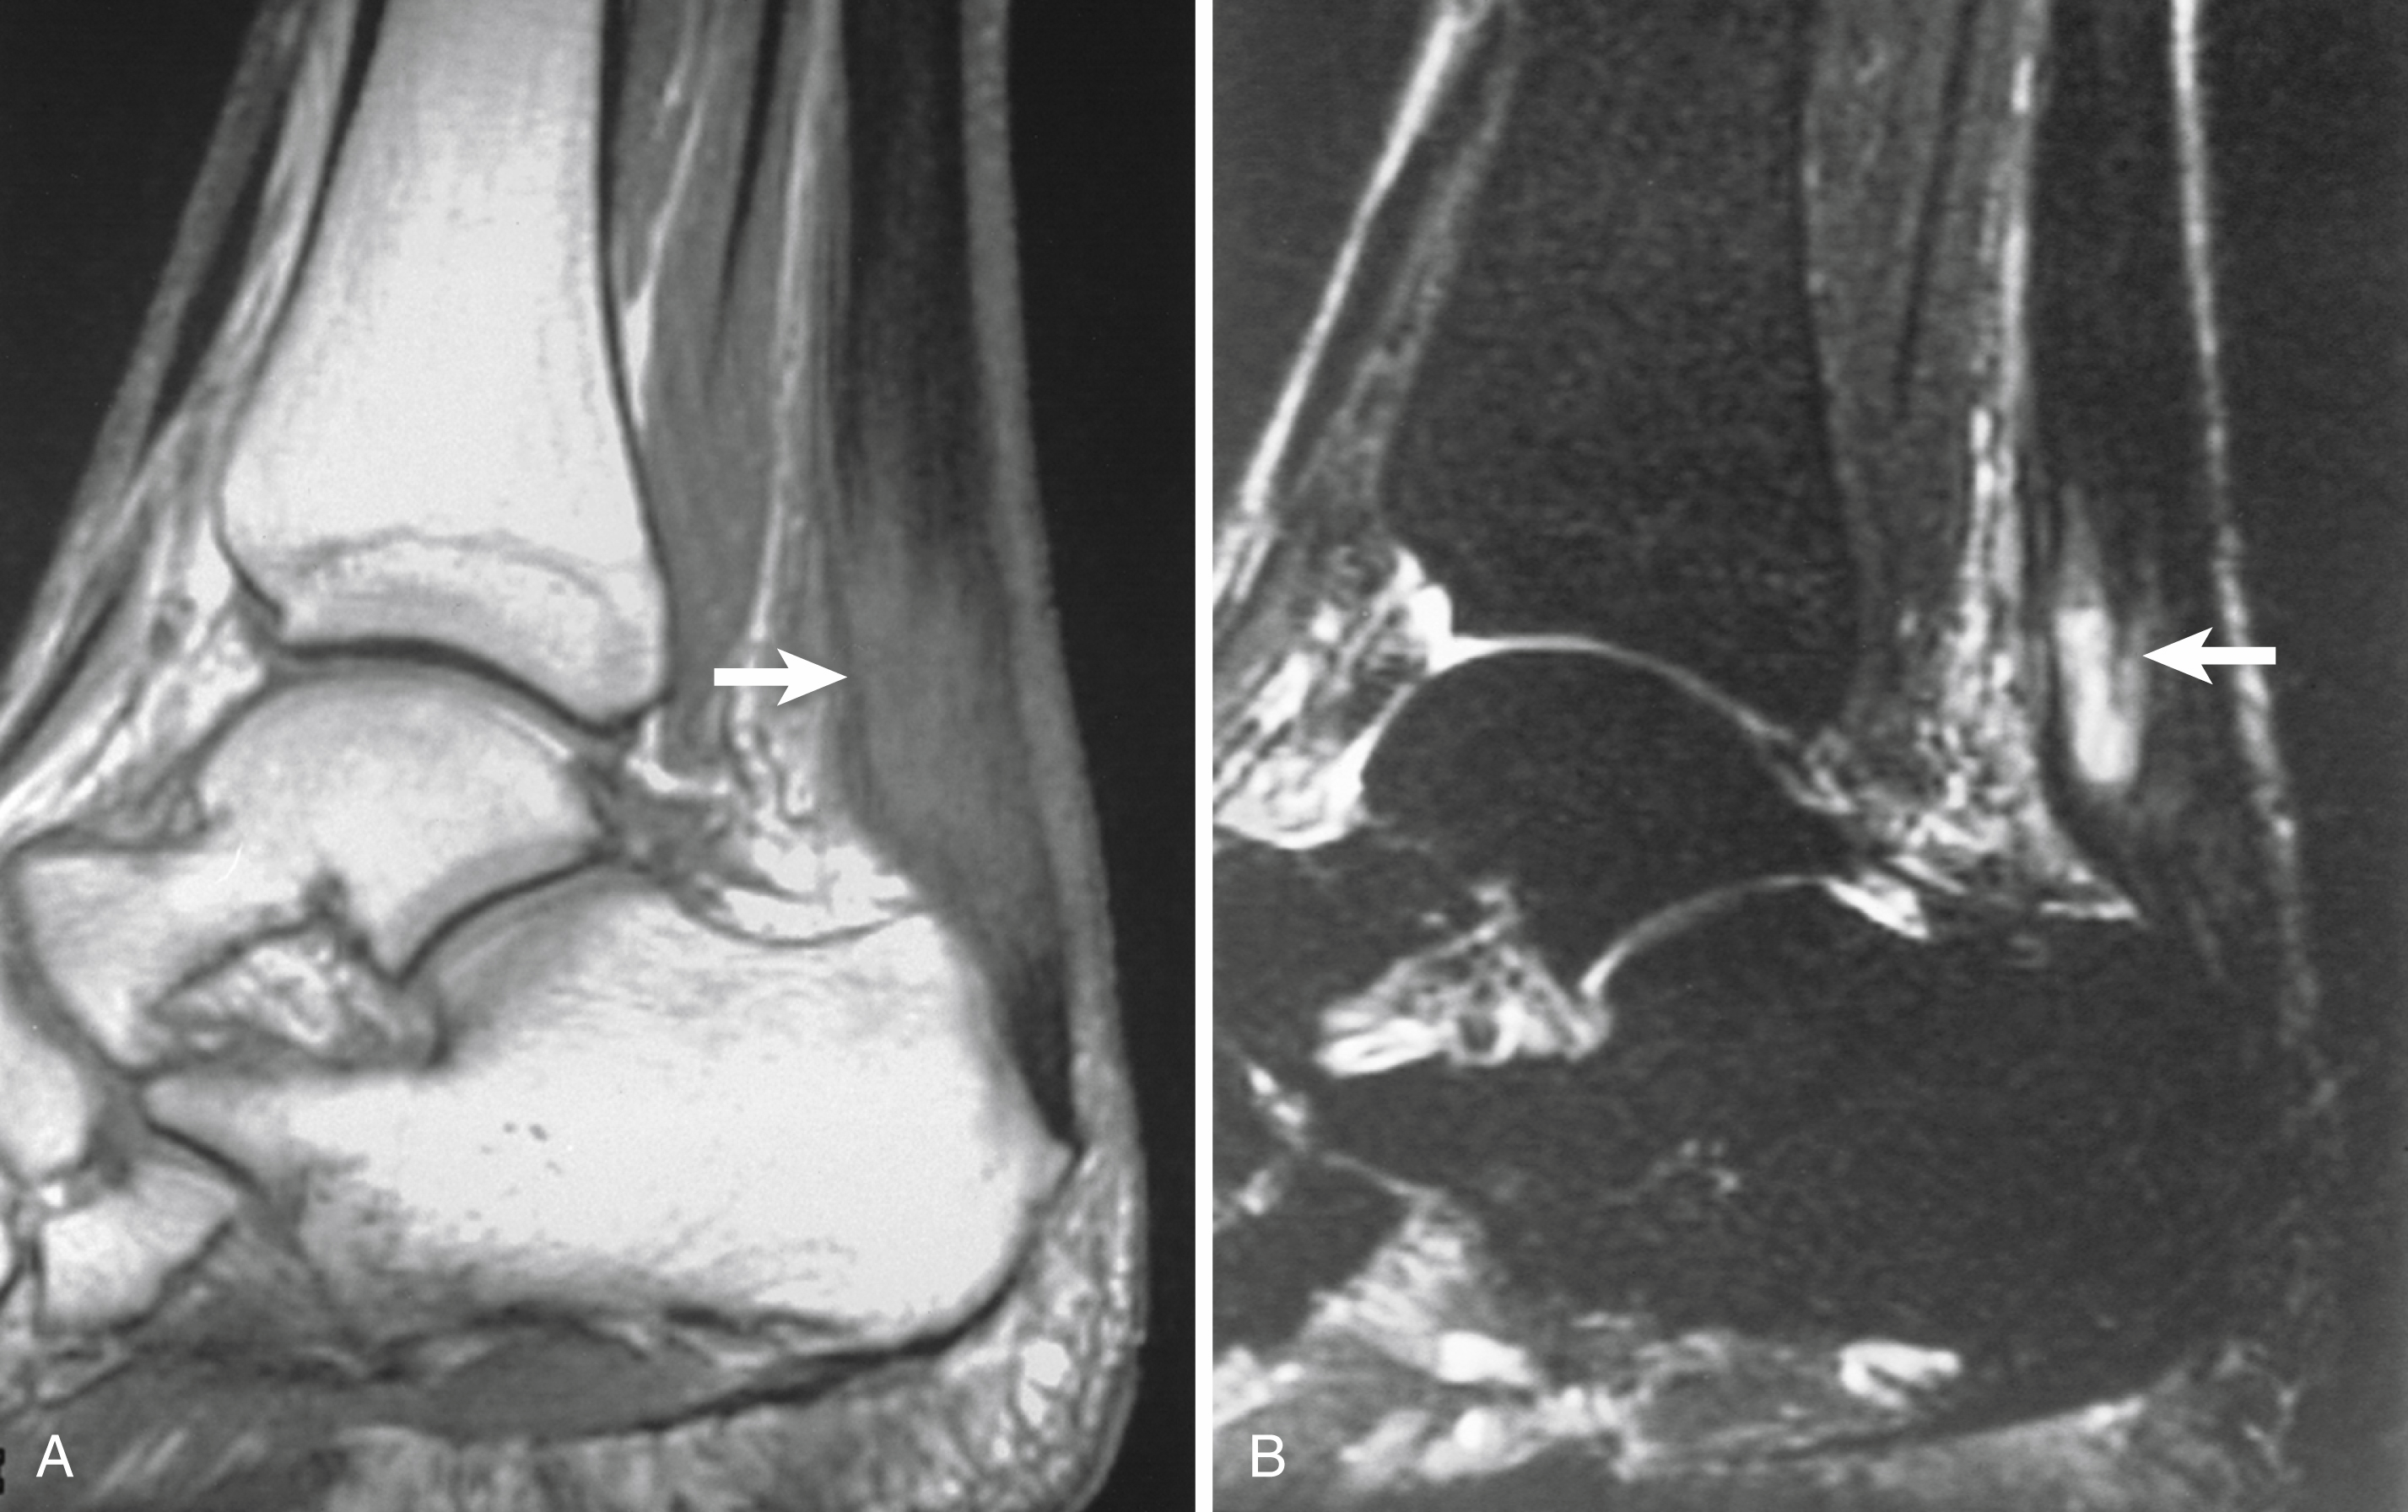
Partial tear of calcaneal tendon. A, Sagittal T1-weighted image demonstrates markedly thickened calcaneal tendon containing areas of intermediate signal (arrow). B, Sagittal fat-suppressed, T2-weighted image exhibits fluid within tendon substance, indicating partial tear

Posterior tibial tendon tear. A, Axial T1-weighted image reveals swollen, ill-defined region of intermediate signal intensity, representing fluid and abnormal tendon (arrow). B, Axial fat-suppressed, T2-weighted image shows thickened tendon (arrow) surrounded by hyperintense fluid

Peroneus longus tendon rupture. A, Coronal T1-weighted image through midfoot shows increased diameter of peroneus longus tendon (arrows). B, Coronal fat-suppressed, T2-weighted image reveals fluid signal within ruptured tendon (arrow

Longitudinal split tear of the peroneus brevis tendon.
T1-weighted axial image at the level of the ankle joint shows a longitudinal split of the peroneus brevis tendon (arrow) between the lateral malleolus anteriorly and the peroneus longus tendon posteriorly

Calcaneal stress fracture.
A, Sagittal fat-suppressed T2-weighted image through the hindfoot shows hyperintense marrow edema in the calcaneal tuberosity. B, Sagittal T1-weighted image at the same location clearly demonstrates a linear hypointense fracture line

Coronal view at the Chopart joint line. Nav, tarsal navicular bone; Cub, cuboid bone;
1, medial compartment = M. abductor hallucis; 2, deep central compartment = M. quadrates plantae; 3, superficial plantar compartment = M. flexor digitorum brevis; 4, lateral compartment = M. abductor digiti minimi; 5, M. extensor digiti brevis.
B:Coronal view at the bases of the metatarsals. MT 1–5: metatarsals 1 to 5. 1, M. abductor hallucis; 2, M. flexor hallucis brevis; 3, M. adductor hallucis, oblique head; 4, tendons of M. flexor digitorum longus and brevis, and Mm. lumbricales; 5, Mm interossei plantaris 4 and 5; 6, M. abductor digiti minimi.

Osteochondritis dissecans of talus in college football player.
A, Coronal T1-weighted image shows osteochondral fragment in medial talar dome. Loss of fat signal suggests sclerosis or fibrosis (arrow). B, Coronal fat-suppressed, T2-weighted image demonstrates fluid signal between lesion and host bone (arrowheads), indicating unstable fragment. C, Coronal fat-suppressed, spoiled gradient-echo technique reveals abnormal decreased signal (arrow) in overlying articular cartilage, indicating defect confirmed by arthroscopy
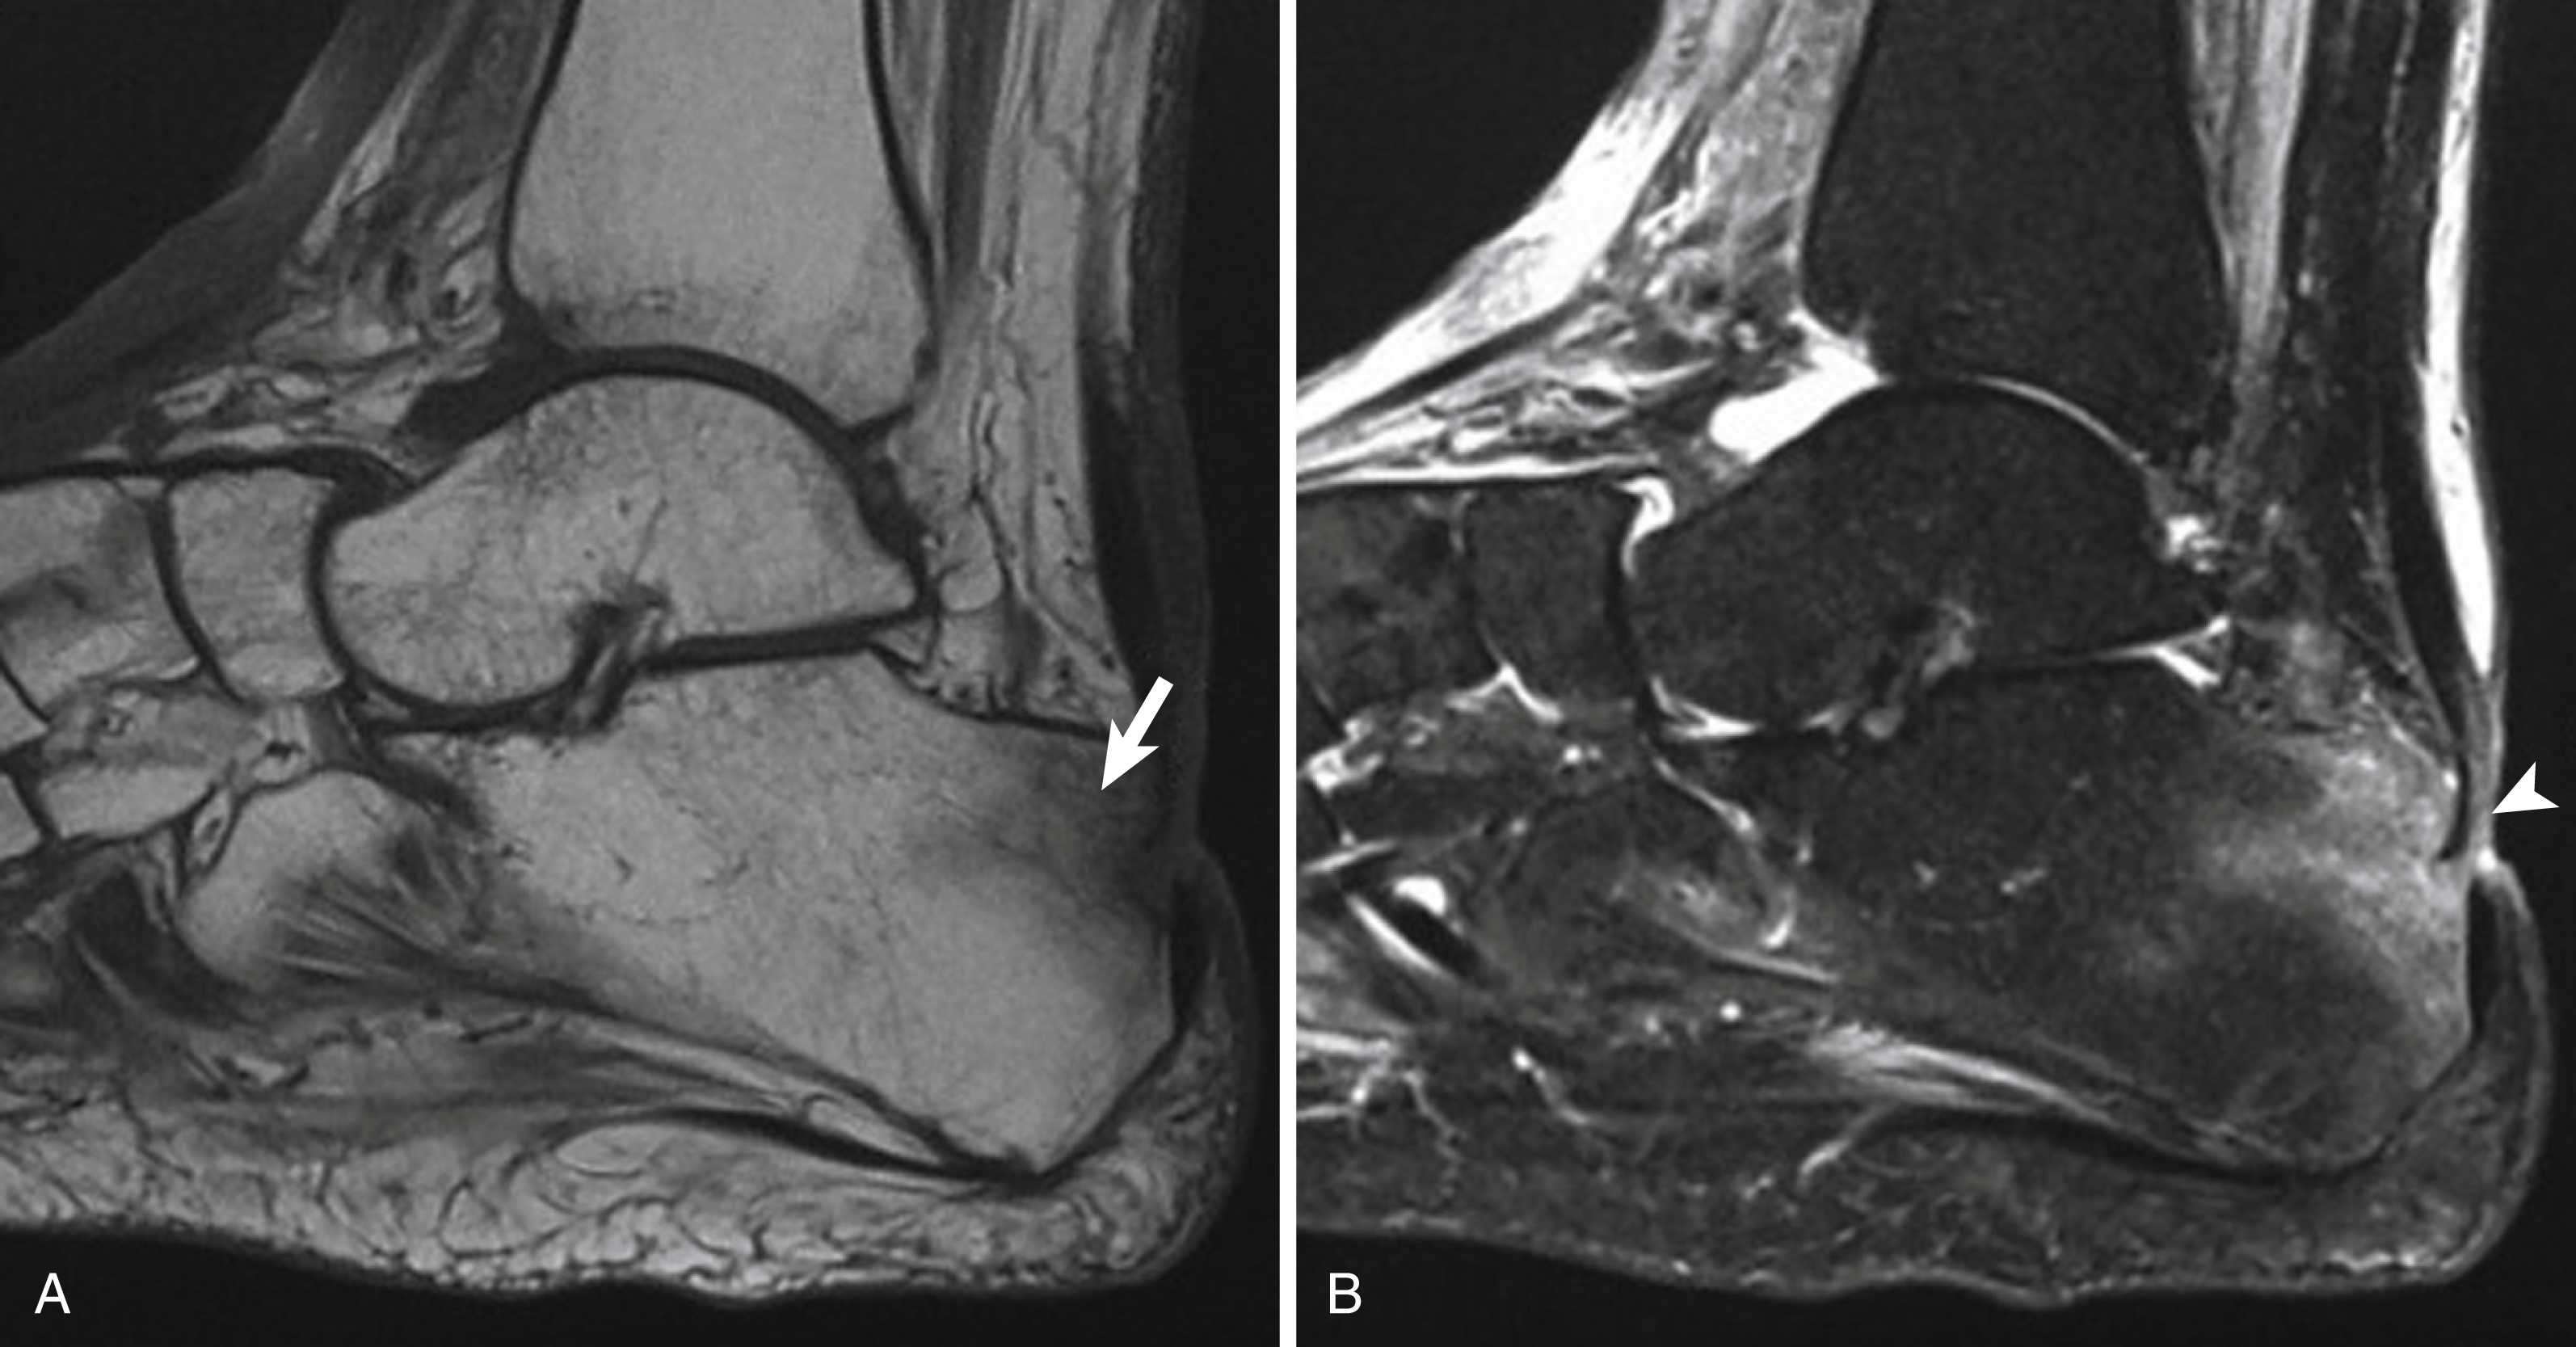
Osteomyelitis of calcaneus.
A, Sagittal T1-weighted image shows abnormal hypointense marrow signal throughout the posterior calcaneus (arrow). B, Sagittal fat-suppressed T2-weighted image shows subcortical marrow edema consistent with osteomyelitis. Note the overlying soft-tissue ulcer (arrowhead) .

Meniscal tear.
Sagittal fat-suppressed proton density–weighted image demonstrates linear increased signal traversing posterior horn of medial meniscus, indicating horizontal oblique tear (arrow).

Meniscal tear.
Sagittal proton density–weighted image reveals small defect in free edge of body of lateral meniscus, indicating radial tear (arrow)

Meniscal cyst.
Sagittal fat-suppressed, proton density–weighted image of knee shows a hyperintense meniscal cyst (straight arrow) adjacent to medial meniscus. Associated tear is present in inferior articular surface of meniscus (curved arrow).

Root ligament tear of the posterior horn of the medial meniscus.
Coronal fat-suppressed proton density-weighted image demonstrates a fluid-filled defect (arrow) in the posterior horn of the medial meniscus at the root ligament.

Bucket handle tear of medial meniscus.
Coronal
(A) and axial (B) fat-suppressed, proton density-weighted images demonstrate centrally displaced portion of medial meniscus (arrows)

Inferiorly displaced medial meniscal fragment.
Fat-suppressed, proton density–weighted image demonstrates portion of medial meniscus displaced inferiorly and deep to medial collateral ligament (arrow)

Discoid meniscus in 3-year-old boy.
A, Sagittal proton density–weighted image reveals abnormally thick lateral meniscus (arrow). B, Coronal fat-suppressed, proton density–weighted image demonstrates extension of discoid meniscus centrally (arrow) into weight-bearing portion of lateral compartment.

Acute anterior cruciate ligament tear.
A, Fat-suppressed, proton density–weighted sagittal image shows edema throughout abnormally oriented anterior cruciate ligament fibers (arrow) . B, Fat-suppressed proton density–weighted image demonstrates typical associated bone contusion in the lateral femoral condyle (arrow) .

Posterior cruciate ligament tear.
Sagittal fat-suppressed proton density-weighted image shows abnormal increased signal (arrow) within the disorganized fibers of the distal posterior cruciate ligament
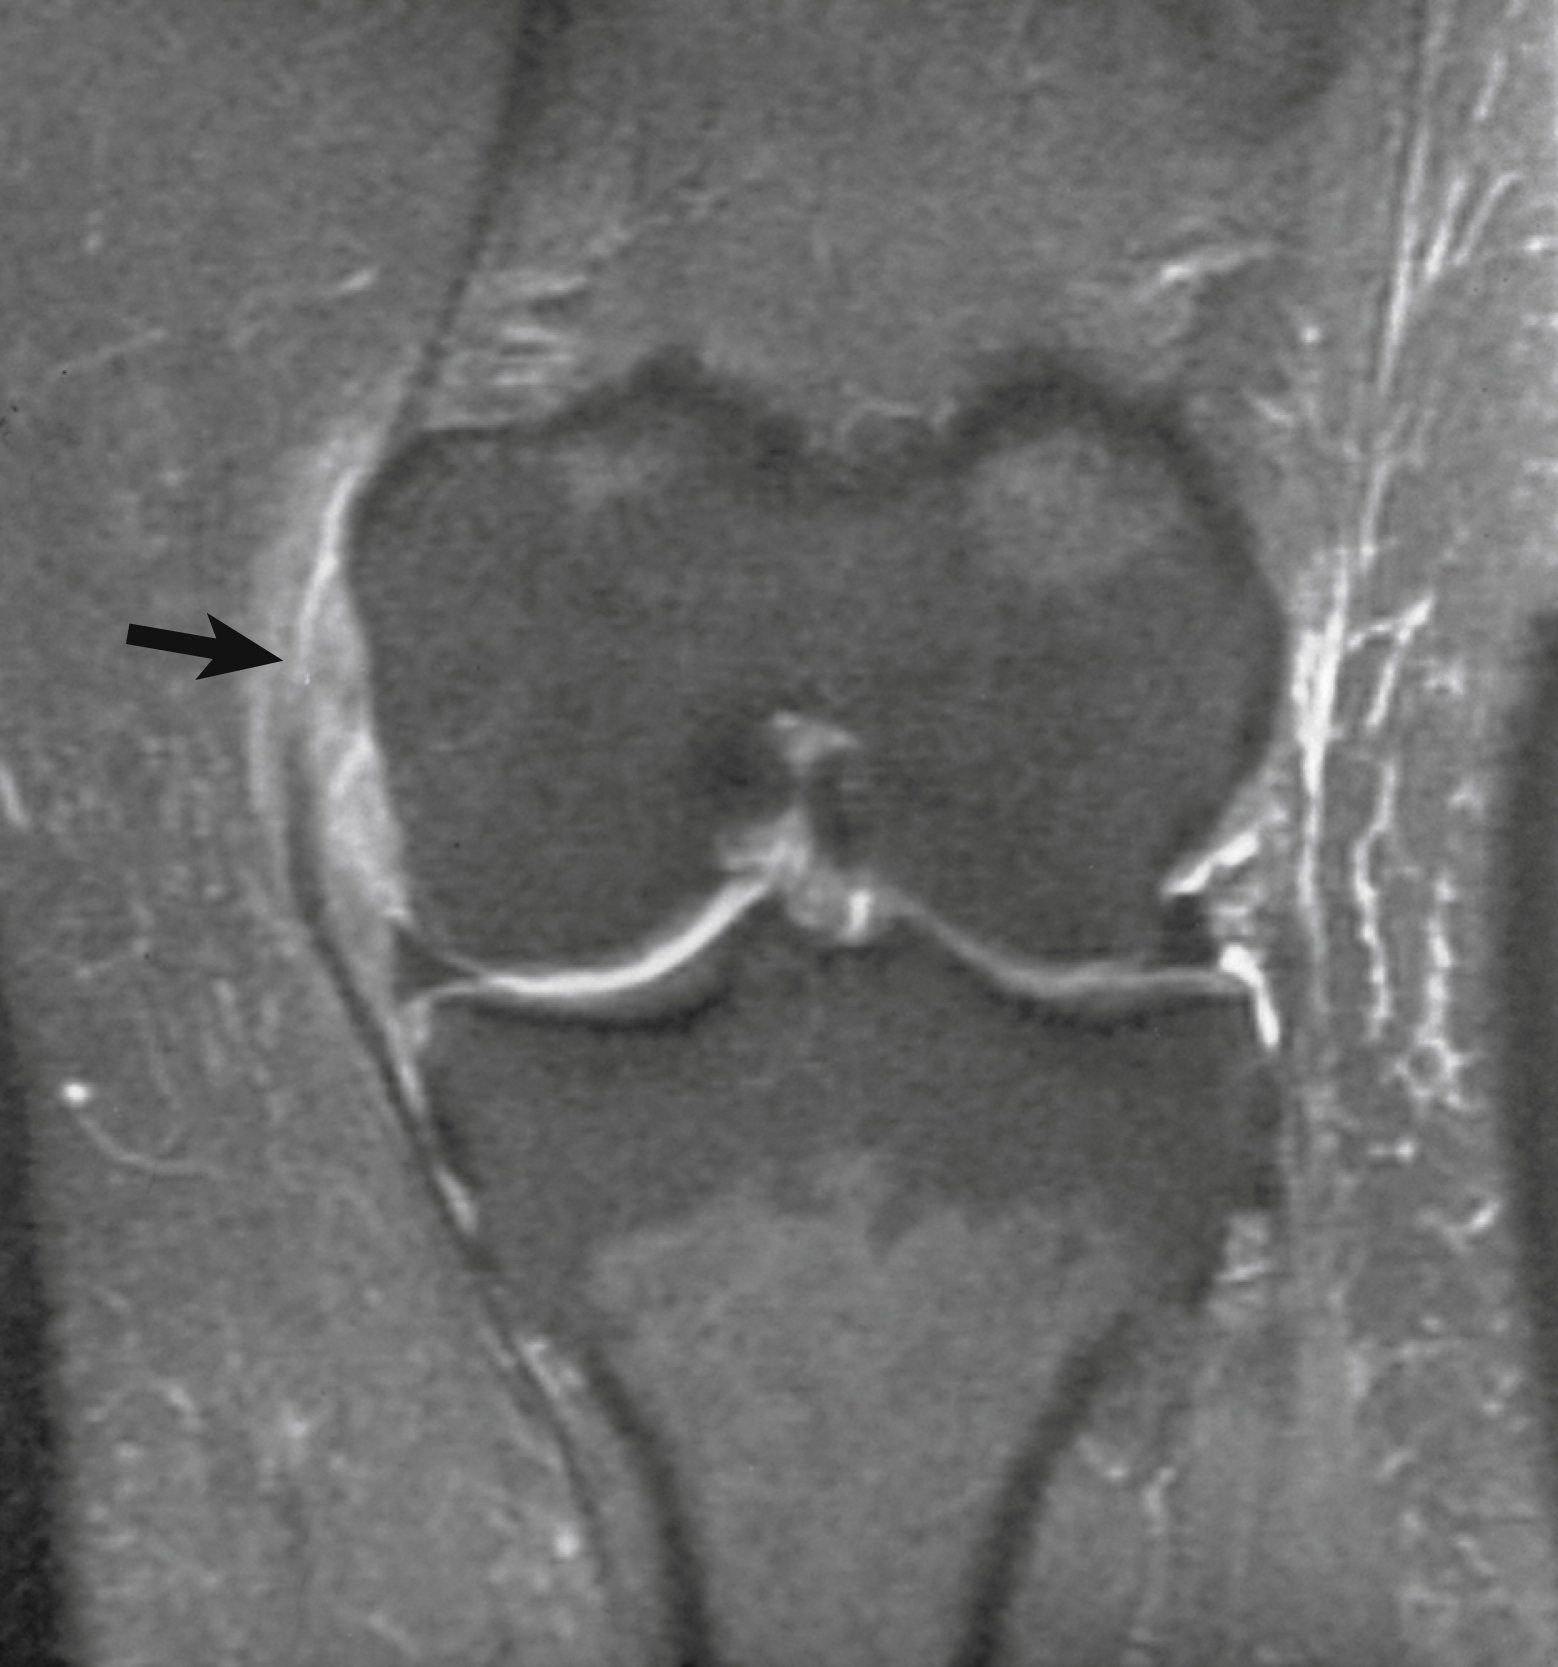
Medial collateral ligament tear.
Complete disruption of proximal medial collateral ligament (arrow) is demonstrated in coronal fat-suppressed, proton density–weighted image; this appearance suggests grade 3 medial collateral ligament injury

Popliteal fossa cyst.
Axial proton density–weighted image demonstrates hyperintense fluid extending from knee joint into popliteal fossa between semimembranosus tendon (straight arrow), and medial gastrocnemius tendon (curved arrow).

Patellar dislocation.
A and B, Axial fat-suppressed, proton density–weighted images through patellofemoral joint show regions of increased signal, representing marrow edema beneath medial facet of patella (long arrow) and in lateral aspect of lateral femoral condyle (thick arrow). This pattern of osseous contusion indicates recent lateral patellar dislocation. Note hematocrit level in joint effusion (arrowheads).

Occult Salter II fracture
of distal femur in 14-year-old boy. A, Coronal T1-weighted image reveals ill-defined reduced signal in medial distal femoral metaphysis. B, Fat-suppressed, T2-weighted image demonstrates irregular hypointense fracture (arrow) surrounded by hyperintense marrow edema. Edema continues along lateral physis, indicating extension of fracture

Physeal bar in 12-year-old boy.
Gradient-echo sagittal image of knee demonstrates interruption of posterior extent of distal femoral physis (arrow). Osseous bridge has resulted in posterior angulation of articular surface of distal femur. Articular and physeal cartilage exhibits increased signal with most gradient-echo techniques.

Osteochondritis dissecans.
Coronal fat-suppressed proton density-weighted image of the knee demonstrates hyperintense fluid signal (arrow) surrounding an unstable osteochondral fragment.
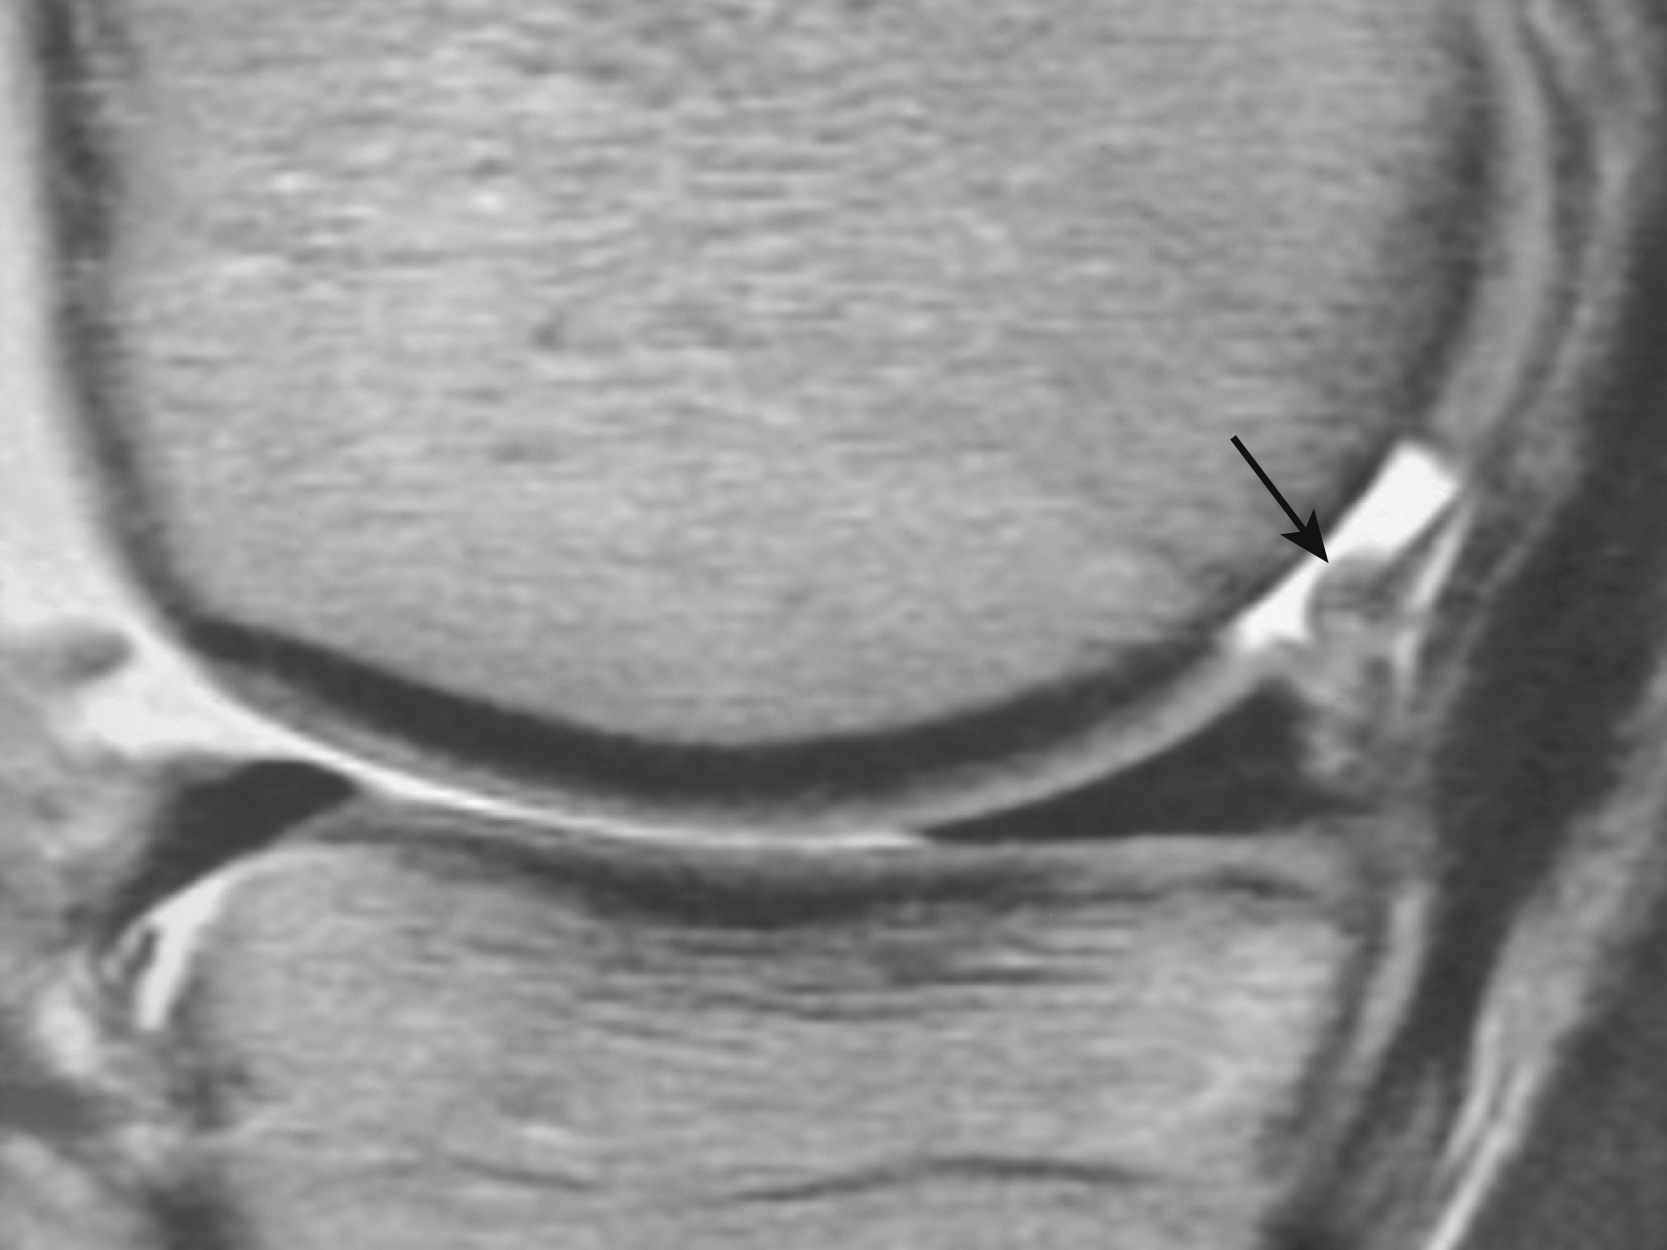
Chondral lesion
Fat-suppressed proton density weighted sagittal image of knee reveals a small, well-defined fluid filled full-thickness defect in the articular cartilage of the posteromedial femoral condyle (arrow)

Corticosteroid-induced bilateral osteonecrosis of femoral head
. A and B, Coronal T1-weighted and inversion recovery images through both hips reveals geographic focus of marrow replacement in weight-bearing aspect of left femoral head, indicating osteonecrosis (solid arrows). More advanced disease is seen in right femoral head with collapse of articular surface, adjacent marrow edema (open arrows), and effusion.

Transient osteoporosis of hip
in 30-year-old man. A, Coronal T1-weighted image reveals diminished signal intensity within right femoral head and neck. B, Coronal inversion recovery sequence demonstrated hyperintense bone marrow edema in more diffuse pattern than seen in osteonecrosis.

Radiographically occult proximal femoral fracture in elderly woman. A, Questionable cortical disruption is noted on radiograph of left hip obtained after fall. B, Coronal T1-weighted image confirms greater trochanter fracture manifested as vertically oriented band of reduced signal (curved arrow) within normal bright fat signal of femoral neck. C, Coronal inversion recovery sequence shows edema at fracture.

Cervical disc extrusion (herniation). A, T2-weighted sagittal image of the cervical spine reveals extruded C6-C7 disc (arrow). B, Gradient-echo sagittal image demonstrates displaced disc material isointense to nucleus pulposus. Note the absence of cerebrospinal fluid pulsation artifact seen on the T2-weighted image. C, Gradient-echo axial image shows left eccentric extrusion compressing the cervical cord and filling the left neuroforamen (arrow)

Thoracic discitis.
A, Sagittal T1-weighted image exhibits reduced marrow signal (arrows) adjacent to the irregular and collapsed lower thoracic interspace. B, Sagittal T2-weighted image reveals corresponding hyperintense areas of marrow edema (arrows). C, After administration of gadolinium, sagittal T1-weighted image exhibits enhancement of the intervertebral disc (arrow) .

Full-thickness rotator cuff tear.
A, Oblique coronal T1-weighted image poorly differentiates normal tendon from pathologic condition. B, At same location, oblique coronal fat-suppressed, T2-weighted image clearly shows fluid-filled, full-thickness tear (arrow) in supraspinatus tendon

Anterior labral tear
. Axial gradient-echo image through glenohumeral joint shows anterior displacement of avulsed anterior labral fragment (curved arrow). Hypointense middle glenohumeral ligament (arrowhead) lies between labral fragment and subscapularis tendon and should not be mistaken for portion of labrum
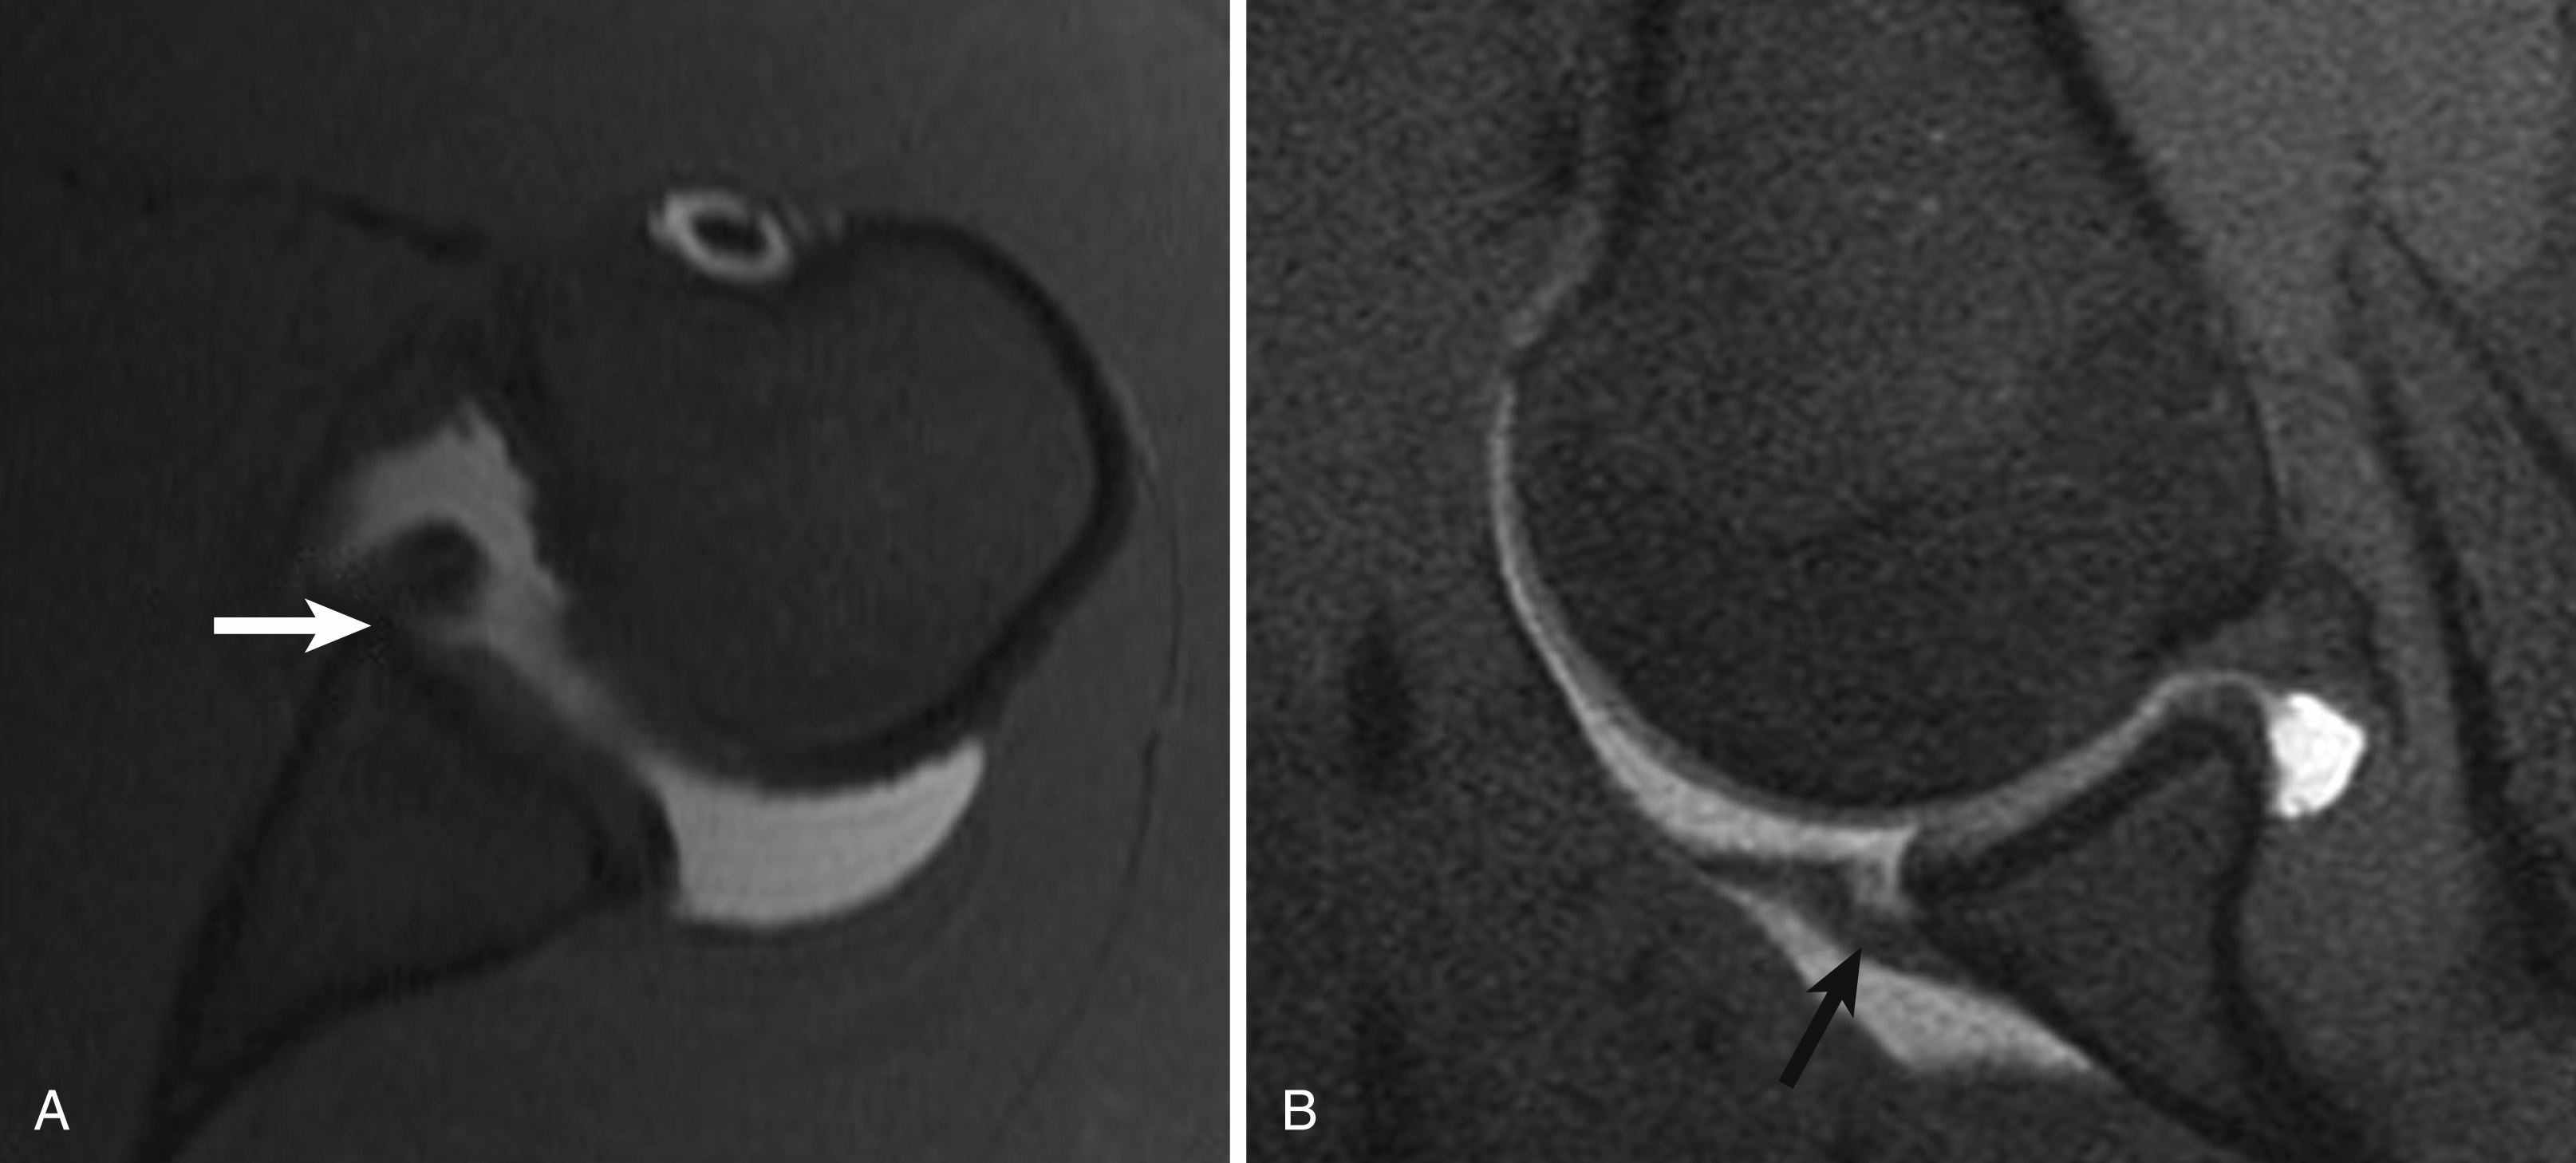
Anterior labral tear
. A, Postarthrogram fat-suppressed T1-weighted axial image of the shoulder shows a small defect in the anteroinferior labrum (arrow) . B, Oblique axial imaging in abduction/external rotation places tension on the inferior glenohumeral ligament, better demonstrating the tear (arrow) .

Superior labral anterior posterior tear
. A, Fat-suppressed T1-weighted oblique coronal image from MR arthrogram shows contrast opacifying a defect in the long head biceps anchor (arrow) . B, Fat-suppressed T1-weighted axial image shows extension of the tear into the anterior and posterior labrum (arrows) .
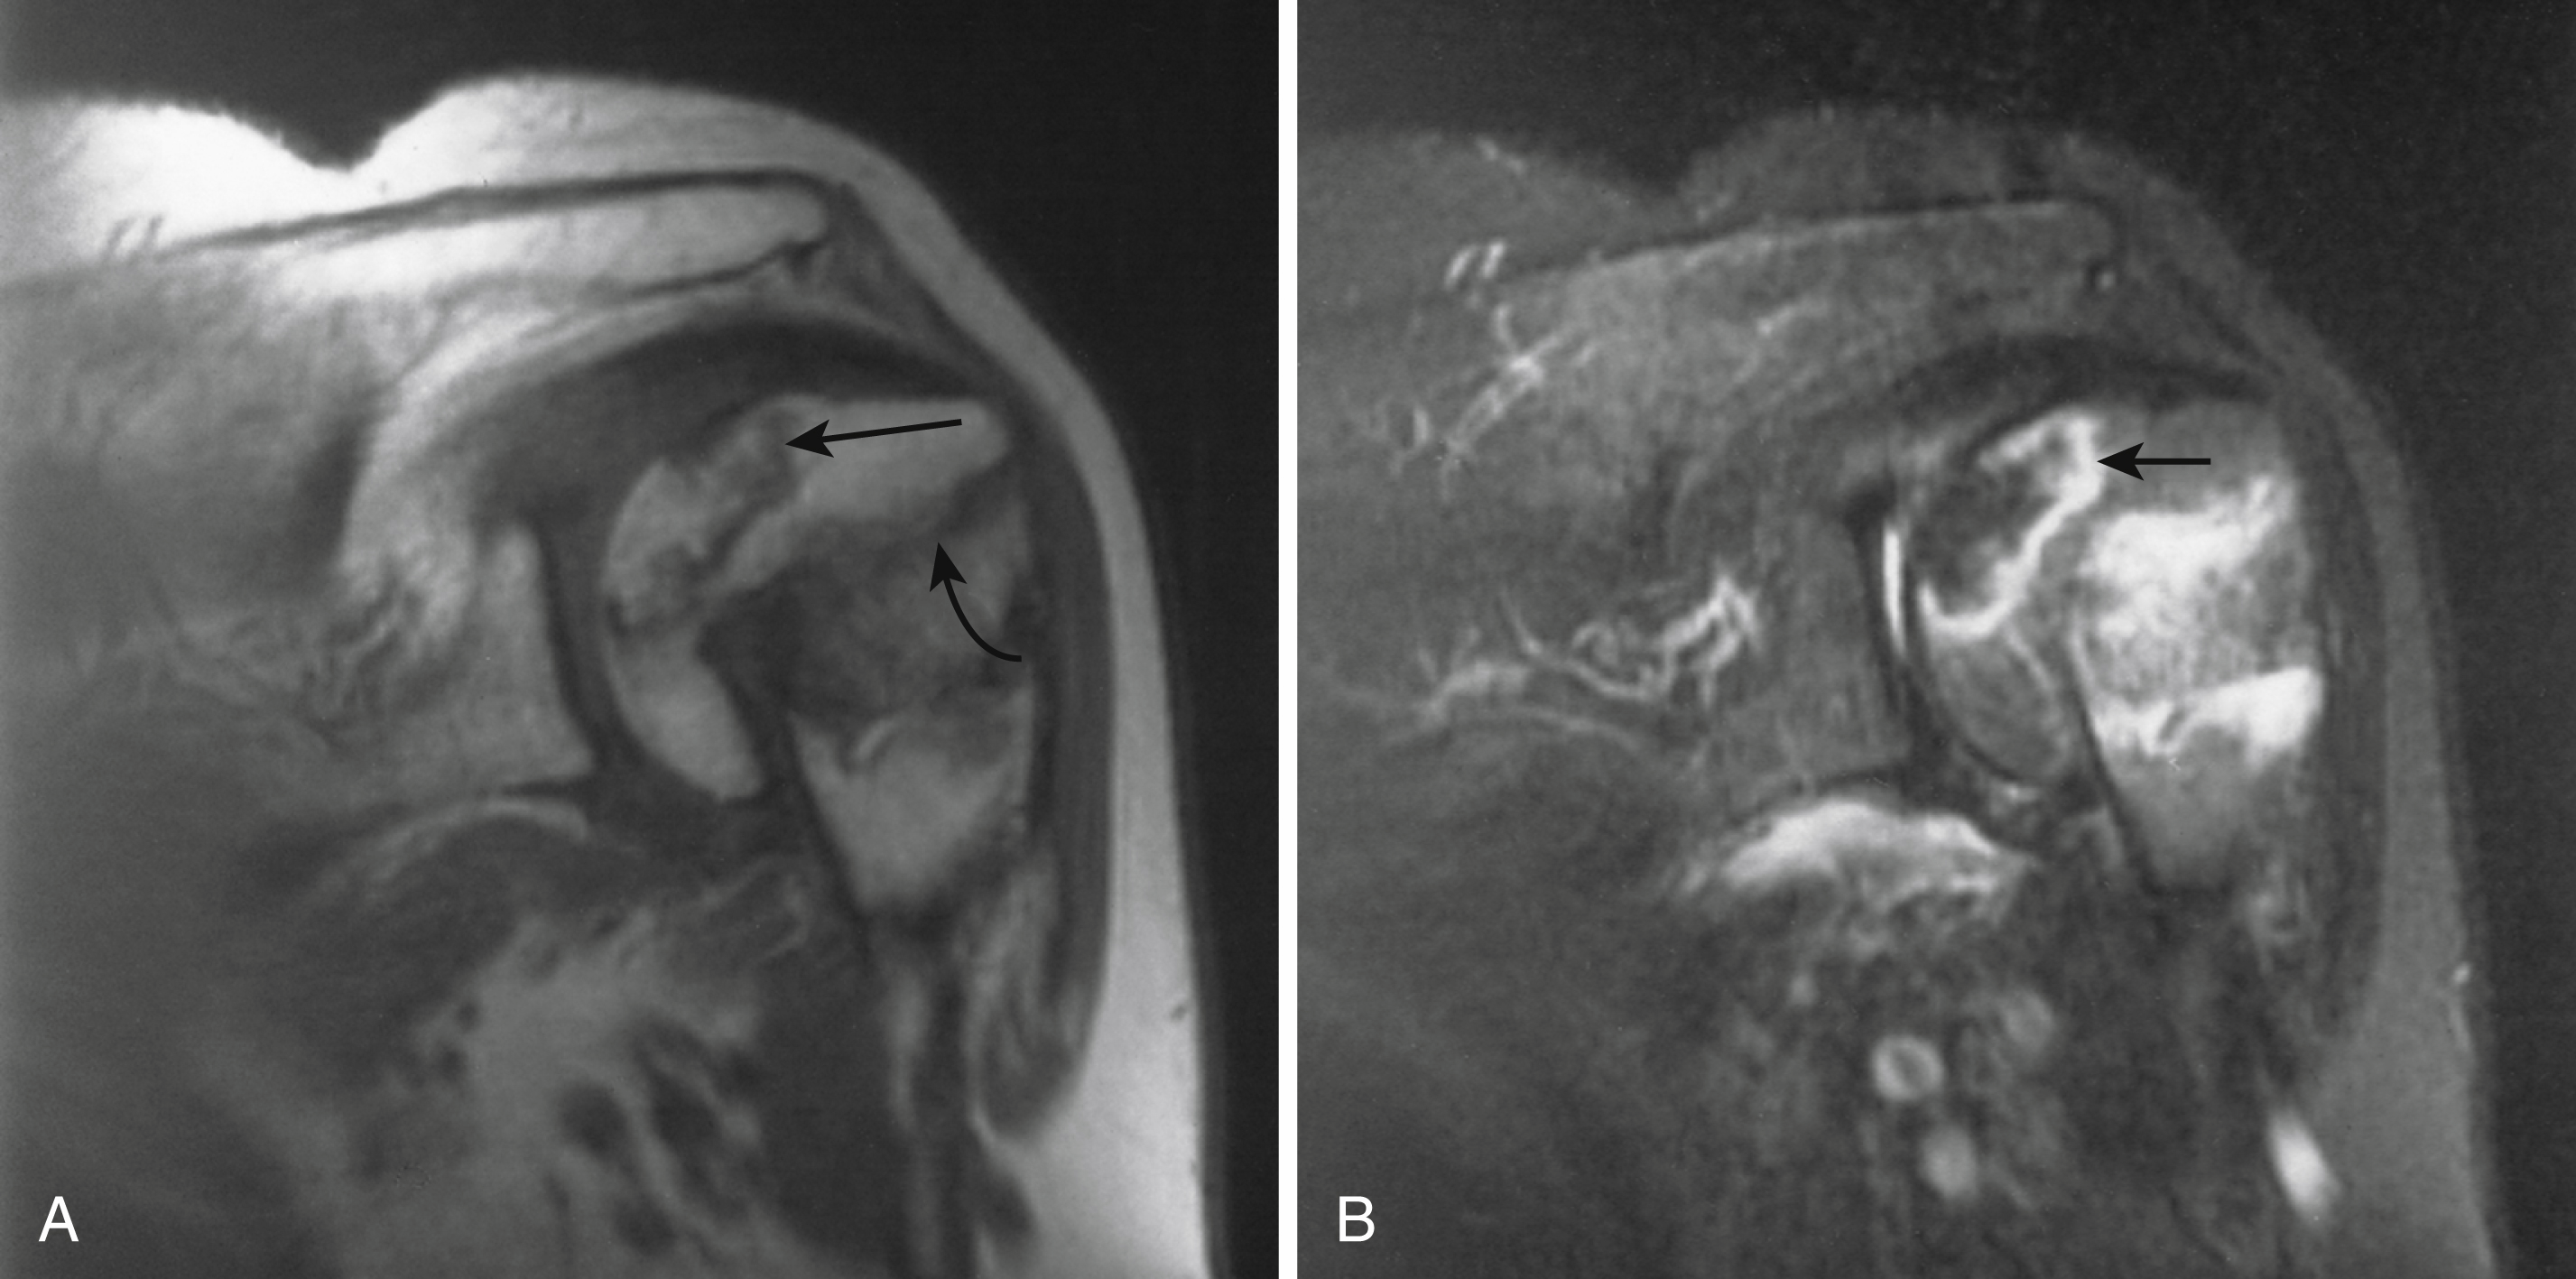
Osteonecrosis complicating comminuted fracture of proximal humerus.
A, Oblique coronal T1-weighted image demonstrates displaced fracture through neck of proximal humerus (curved arrow). Geographic region of abnormal marrow within articular fragment is characteristic of osteonecrosis (long arrow). B, Oblique coronal fat-suppressed, T2-weighted image shows hyperintense rim of reactive tissue (arrow) surrounding now hypointense fatty avascular marrow.

Soft-tissue ganglion
in painful shoulder. Gradient-echo axial image of right shoulder reveals lobulated homogeneous hyperintense lesion in spinoglenoid notch (white arrow). Ganglia and other masses in this location can be associated with suprascapular nerve entrapment. Note subtle hyperintensity indicating edema in the infraspinatus muscle along the posterior scapula related to denervation (black arrows

Triangular fibrocartilage complex (TFCC) perforation.
Coronal fat-suppressed, proton density–weighted image of wrist demonstrates central perforation of TFCC (long arrow). Note fluid in distal radioulnar joint (curved arrow). Scapholunate ligament (open arrow) is intact in this wrist

Osteonecrosis of lunate (Kienböck disease).
Coronal T1-weighted image of wrist shows loss of normal high-signal fat in lunate (arrow), indicating osteonecrosis

Early osteonecrosis of scaphoid following fracture. A, T1-weighted coronal image of the wrist shows a transverse fracture of the mid-scaphoid (arrow) . B, Fat-suppressed T2-weighted coronal image reveals marrow edema in the distal pole fragment only (arrow) , suggesting proximal pole ischemia

Image of rupture of flexor digitorum profundus tendon in long finger made 2 weeks after repair. Sagittal inversion recovery image demonstrates abrupt discontinuity of flexor tendon (arrow) with laxity of more proximal tendon segment
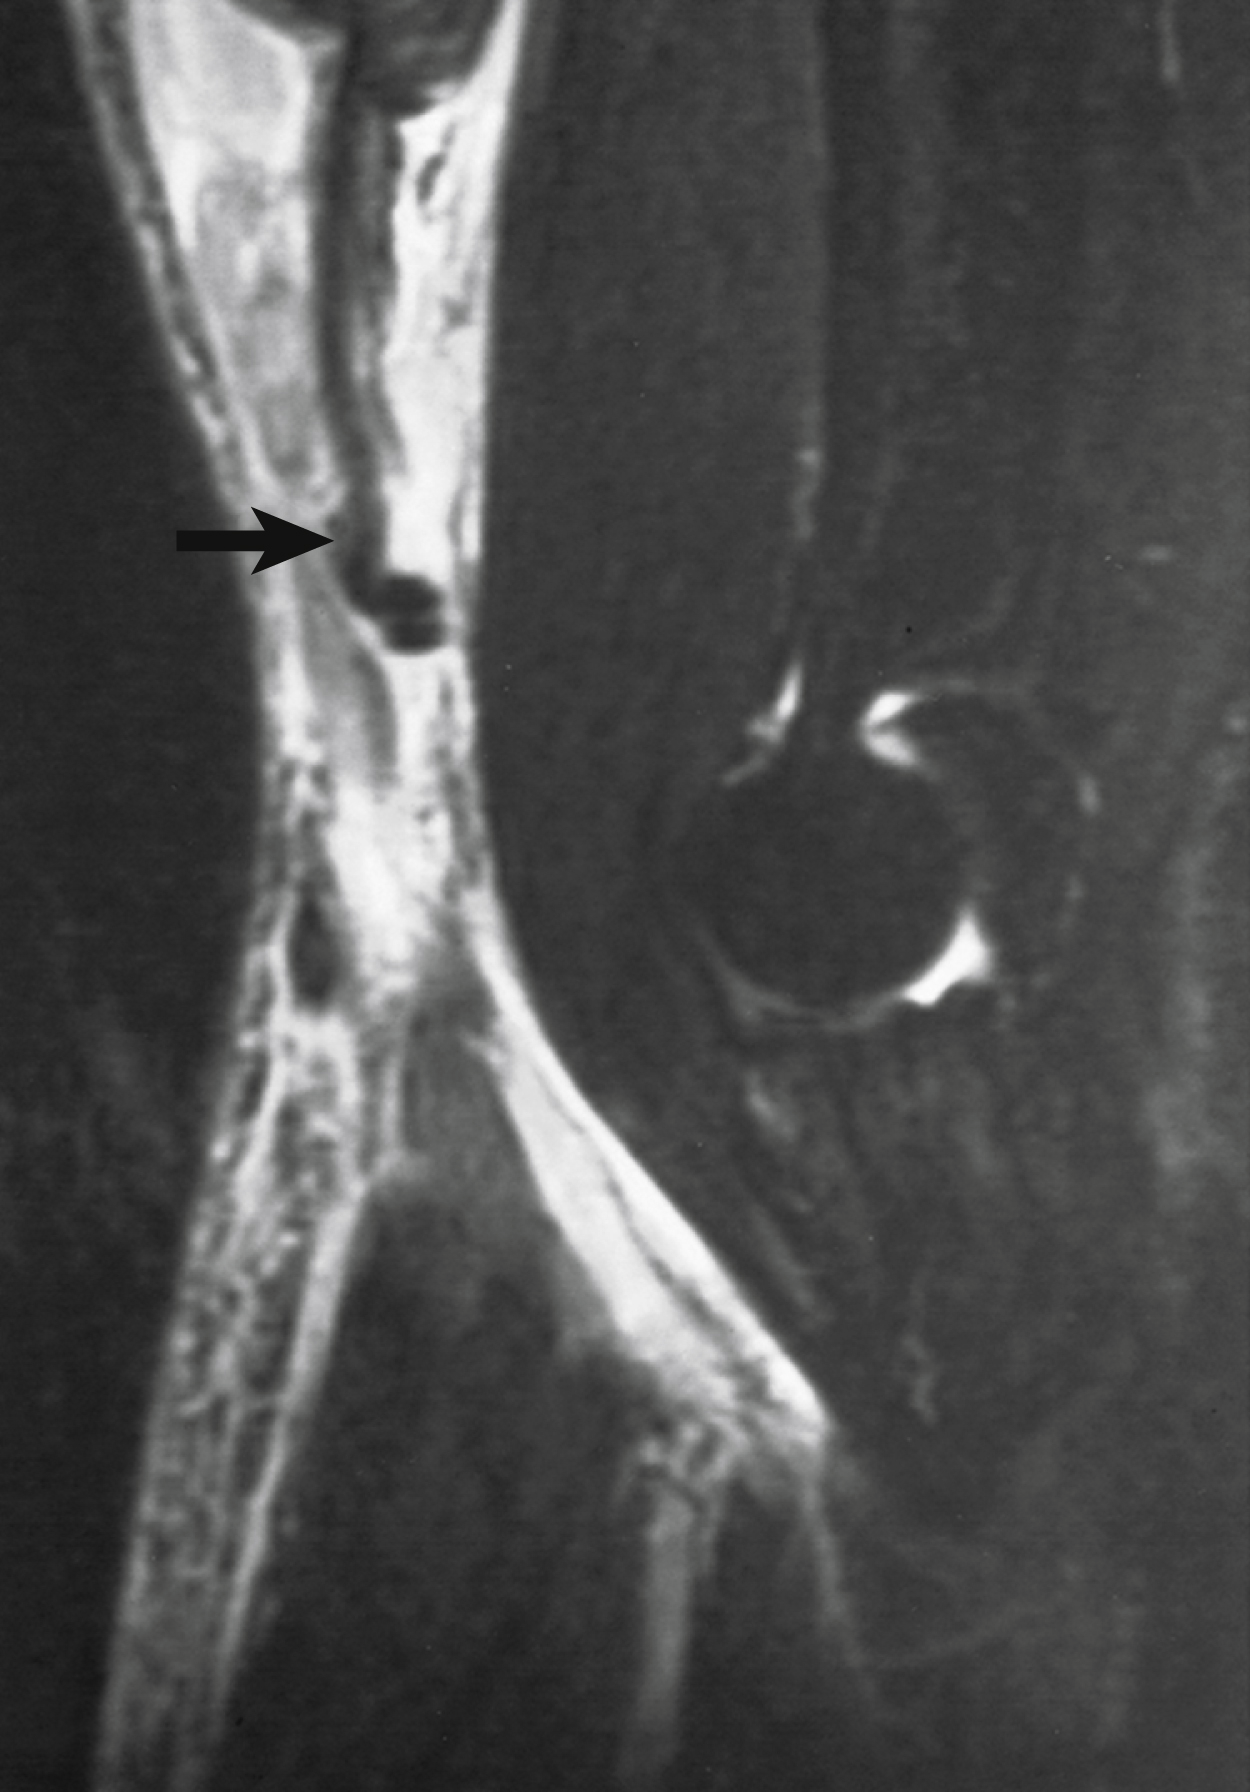
Rupture of distal biceps tendon.
Sagittal inversion recovery image of elbow demonstrates ruptured distal biceps tendon. Proximal tendon (arrow) has retracted several centimeters, and edema is present in tissues anterior to brachialis muscle.

Avulsion of triceps tendon.
A, Sagittal fat-suppressed, proton density–weighted image of elbow shows avulsed triceps tendon (long arrow) retracted proximally from olecranon (thick arrow). B, Sagittal fat-suppressed, T2-weighted image demonstrates hyperintense fluid (arrows) in gap between bone and detached tendon.

Partial ulnar collateral ligament tear at MR arthrography of elbow.
Coronal fat-suppressed, T1-weighted image reveals contrast tracking deep to ulnar attachment of ulnar collateral ligament (arrow
Giant cell tumor of distal femur.
A, Radiograph shows lytic lesion in the distal femoral metaphysis and epiphysis. B, T1-weighted coronal image confirms a well-demarcated intermediate-signal lesion replacing the normal hyperintense fatty marrow of the distal femur. C, Fat-suppressed proton density-weighted coronal image shows heterogeneous hyperintense tumor in a similar distribution. There is subtle cortical destruction of the lateral metaphyseal cortex (arrow)

32-year-old woman had lateral foot pain and low vitamin D levels.
MR images show cuboid stress fracture. Although rare, these fractures are visible by MRI generally 1 month after the initiation of the pain.
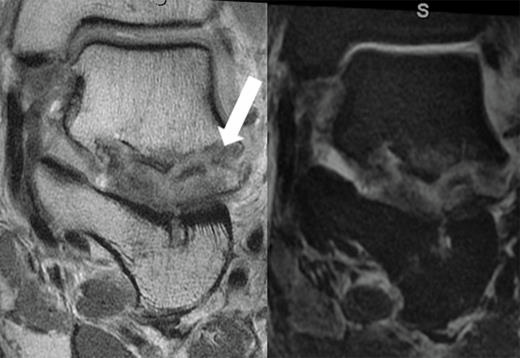
MRIs of a lateral talar process fracture (white arrow) in a patient with negative radiographs and persistent pain following a low-energy injury.

Lateral (A) and oblique (B) radiographs show smaller and more sclerotic navicular characteristic of Köhler disease.
Cast boot immobilization with protected weight bearing has been reported to produce quicker resolution of symptoms. This is a self-limiting condition, and operative treatment rarely is indicated