Chapter 4: Rational Consumer Choice
 Call Kai
 Learn
 Practice Test
 Spaced Repetition
 Match
 Flashcards
 Knowt Play
1/176

There's no tags or description
Looks like no tags are added yet.
Name | Mastery | Learn | Test | Matching | Spaced | Call with Kai | Chat |
|---|
No analytics yet
Send a link to your students to track their progress
177 Terms
What does the theory of rational consumer choice explain?
How consumers choose what combo of goods to buy given their income, prices + preferences
“best affordable combo of goods”
What determines what a consumer can afford?
Their income
Price of goods
Assumptions of rational consumer theory
Consumers have:
Well-defined preferences
What are the two steps in rational consumer choice? (in consumers making a rational choice)
Identify feasible combinations (various combos of goods consumer is able to buy)
Then choose the preferred one
What is a feasible combination?
A combination of goods the consumer can afford
What are consumer preferences?
How consumers rank different combinations of goods.
What is the consumer's objective?
Choose their most-preferred affordable combination.
What is the consumer's objective?
Choose their most-preferred affordable combination.
Basic model of rational consumer choice
Takes consumers' preferences as given
Assumes they will try to satisfy them in the most efficient way possible
The first step in solving the budgeting problem is to identify the set of bundles of goods the consumer is able to buy. The consumer is assumed to have an income level given in advance and to face fixed prices. Prices and income together define the consumer's budget constraint, which, in the simple two-good case, is a downward-sloping line. Its slope, in absolute value, is the ratio of the two prices. It is the set of all possible bundles that the consumer might purchase if he spends his entire income.
Bundle
A particular combination of 2 or more goods
1st no = good on x axis, 2nd no = good on y axis

What is a flow + examples
A physical quantity measured per unit of time
Eg kg of food per week
Examples: consumption and income
What is consumption + income always measured as + why?
A flow
Bc imp to keep track of time to show if a given quantity of consumption is large or small
Eg for food: 4kg/day = a lot, 4k/month = less

Budget constraint / budget line
The set of all bundles that exactly exhausts the consumer's income at given prices
ie shows the combinations of 2 goods a consumer can afford given their income + prices
Consumer can purchase any combo that lies on the line

Formula for consumers income (M) given this budget line


What do the axes intercepts show on the budget line?
x intercept: M / Ps = max shelter if all income is spent on shelter
y intercept: M / Pf = max food if all income is spent on food


What is the budget constraint equation?
PsS = Expenditure on shelter.
M = consumer weekly income

How do you calculate the maximum quantity of a good?
Income divided by that good’s price.
What does a point on the budget line mean?
The consumer spends all their income.

Slope of the budget line formula
-vertical intercept / horizontal intercept
eg -Ps / Pf
Negative price ratio of the 2 goods (the rate at which good x can be exchanged for good y)

Why is the slope of the budget line negative? aka what does it mean
Negative slope → buying more of one good means giving up some of the other
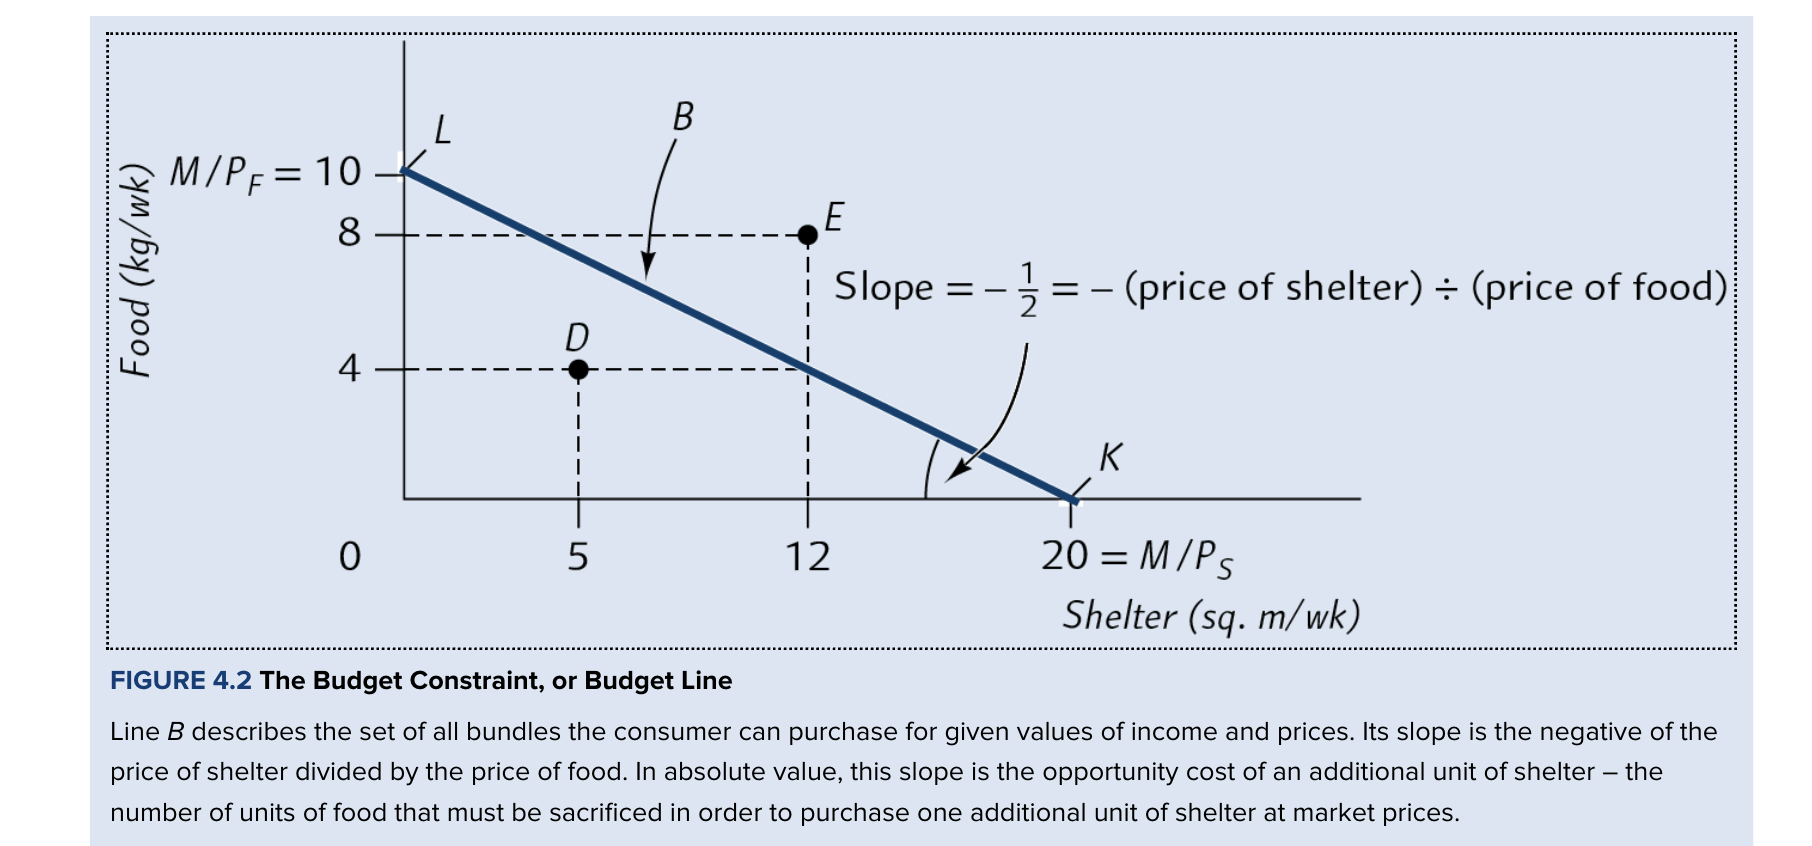
Work out the slope of the budget line in this + what does it mean?
-1/2 kg / sq . m
1 kg of food can be exchanged for 2 sq. m of shelter.
Here, \(-5/10=-0.5\): one extra m² of shelter costs 0.5 kg of food in opportunity cost.

What does the ABSOLUTE value of the slope of the budget line show?
The OPPORTUNITY COST of an additional unit of good x
Ie the no. of units of good y that needs to be sacrificed in order to purchase 1 additional unit of good x at market prices
Budget line
Bundles where all income is spent
Affordable set / feasible set
Bundles ON or BELOW the budget constraint;
Bundles for which the required expenditure at given prices is less than or equal to the income available.
Where: all bundles ON or INSIDE the budget line.
What does it mean if a bundle is infeasible / unaffordable?
Bundles outside the budget line
The bundle cost more than income

Which points are affordable and unaffordable?
Affordable (on / inside budget line / budget triangle- bounded by 2 axes) = consumer can buy = feasible set
On budget line = consumer spends ALL income
Inside budget line = consumer doesn’t spend all income
Unaffordable (outside budget line / triangle) = cost more than income = consumer can’t buy
Consumers weekly income =
Consumers weekly expenditure on good x + Consumers weekly expenditure on good y
What 2 things fully determine the slope + position of the budget constraint?
Consumer's income
The prices of the respective goods.
Effect of a price change on the budget constraint
Eg only price of good x changes
Price of X:
Increases → budget line rotates INWARDS
Both max affordable good x + other affordable combinations fall.
Decreases → BL rotates OUTWARDS

Draw the effect of a price INCREASE in good x on the budget constraint
Eg only price of good x changes
Shelter increases from 5 → 10/ sq.m
Vertical intercept stays the same bc weekly income + price of good y stays the same
BL rotates inwards
- (Px) / (Py)

Effect on budget constraint of only changing PRICE of 1 good or price of 2 goods by diff proportions
SLOPE changes
What happens to the budget constraint the price of good x and y change by the SAME proportion?
The new budget constraint will have the SAME slope as before
Price of good x and y change by same proportion (eg both 2x) → OC of good x in terms of y is the SAME as before
Effect of doubling prices of good x and y on the budget constraint?
Income stays same
Budget constraint shifts INWARDS + PARALLEL to og BC
What does the slope of a budget constraint tell us (in relation to prices)?
About RELATIVE prices
Not prices in absolute terms
Effect of a change in income on the budget constraint
Income:
increases → BC shifts outwards in parallel, same slope
decreases → BC shifts inwards in parallel, same slope
(same effect as equal proportional change in price of both goods)

Effect if all prices and income change by the same proportion on budget constraint
Budget constraint stays unchanged
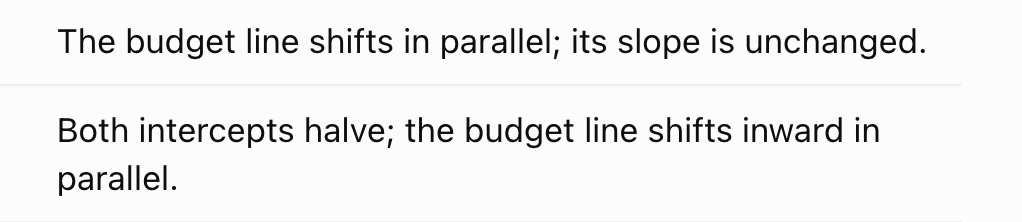
Effect of consumer income falling by half
Horizontal + vertical intercepts fall by half
Same effect as doubling each price
New slope paralell to old


Why is considering models where consumers face only 2 options not ideal?
Not realistic
Consumers face many options
Choose betw ‘N’ goods
How does the budget constraint look with 2 vs 3 vs more than that goods?
2 goods- straight line
3 goods- plane
More than 3- hyperplane (multidimensional plane)
Composite good
In a choice between a good X and numerous other goods, the amount of money the consumer spends on those OTHER goods
good X = 1 specific good
good Y = composite good = amalgamation of all other goods
Features of composite good Y
Its price is defined as €1 per unit.
It represents the money available to spend on all goods other than good X
The max amt of Y is M (M = income)
The max amt of X is M/Px (Px = price of X)
Why is the composite good priced at €1 per unit?
So its quantity represents the money spent on other goods.
Allows us to think of composite good as amt of income the consumer has left over after buying good X
What does Y represent?
Amt consumers spend on all goods other than X
What is the maximum amount of X?
M / Px
Income / price of X
What is the maximum amount of Y?
M
Income
What is the budget equation using a composite good?
PxX + Y = M
(Price of X x quantity of X) + Spending on Y = income
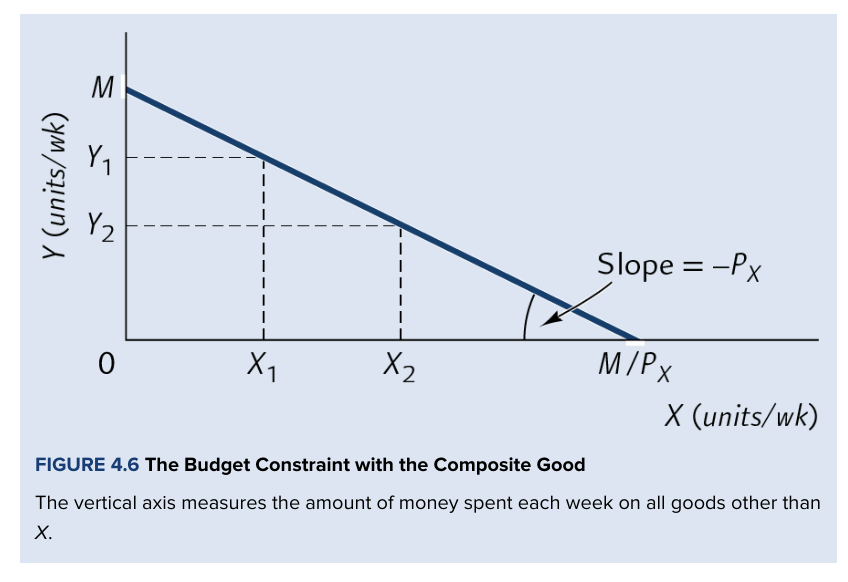
What is the slope of the composite-good budget line?
-Px
- the price of good X
Why is the slope of a composite-good budget line -Px?
Bc Y costs $1 per unit
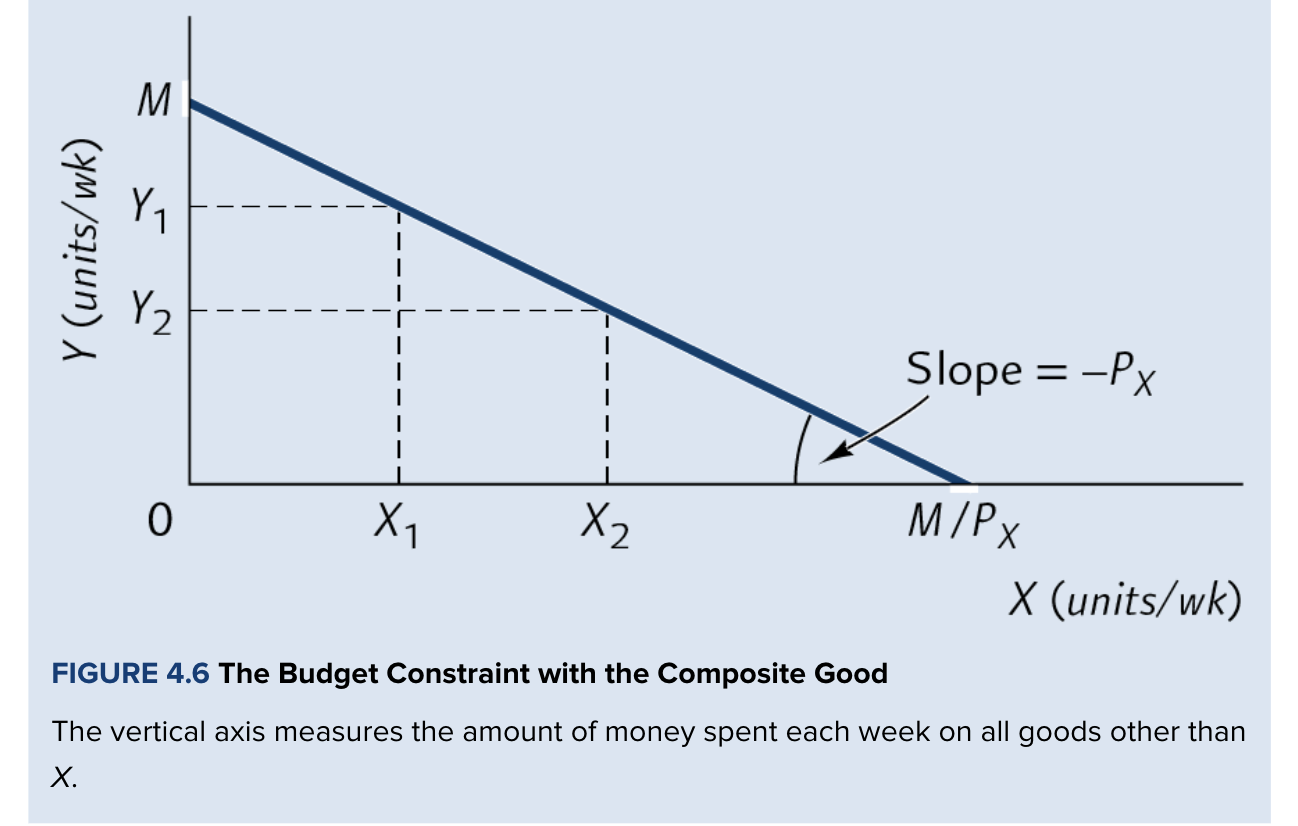
Expain this budget constraint for composite goods graph
X axis- spending on X per week
Y axis- spending on Y per week
Consumers income- M per week
Straight line
Price of composite good = $1/unit → if consumer only buys Y → can buy M units
Consumer only buys X → can buy M/Px units (ie the bundle (M/Px, 0))
Price of Y = $1/unit
When is a budget constraint going to be linear (straight line) + what does it mean?
When relative prices are constant
So opp cost of 1 good in terms of any other is the same (no matter qhat bundle of goods we alr have)
What is a non-linear budget constraint?
A budget constraint where relative prices of goods change with the quantity purchased

Draw the non-linear budget constraint for this

What causes a non-linear budget constraint?
Relative prices of goods change w quantity purchased:
Bulk discounts
Buy one, get one free
Free delivery above a spending threshold
Two-part tariffs
Two-part tariff
A fixed fee to access a service plus a charge per unit used (fixed fee + charge per unit)
Eg gym membership fee plus a charge for each class
How does a non-linear budget constraint affect opportunity cost?
Opp cost changes depending on the quantity consumed.
Why do non-linear constraints matter?
The opp cost of consuming more changes at diff quantities
Discounts encourage consumers to buy more
Firms can use pricing structures to increase profits.
Linear vs non linear budget constaint
Linear: constant slope → constant relative prices + opp cost
Non-linear: changing slopes → opp costs vary

Key point
1g costs $2
rest 249g is free

Summary of budget constraints / budget lines
Summarizes the combinations of bundles that consumer is able to buy
Position determined by income + prices
Consumer needs to pick bundle they like best
From a set of feasible bundles, what is the consumers task + how is this done?
From the feasible set, consumer needs to pick their most-preferred affordable bundle
To find this bundle, need to summarize consumers preferences over all possible bundles they might consume (use preference ordering)
Why do firms offer quantity discounts?
Encourage greater purchases → increase profits
Preference ordering
A ranking of all possible consumption bundles in terms of their desirability
Aka in order of preference
What can and can’t preference ordering show us?
Can: ranking of bundles in terms of desirability (eg A>B)
Can’t: how much satisfaction 1 provides relative to another
Consumers can’t make precise quantitative statments
5 properties or preference orderings
Completeness
Transitivity
More-is-better
Continuity
Convexity

What is completeness?
Any two bundles can be ranked or judged equally attractive
Eg prefer A, prefer B or find them equally attractive
PO is complete if it allows the consumer to rank all possible combinations of +s
Every bundle can be ranked!!
What are the 3 possible statements to make if there are 2 bundles, A and B.
A preferred to B
B preferred to A
A and B are equally attractive
Transitivity
For 3 BUNDLES of goods (not individual goods): A, B, C
If A preferred to B, and B preferred to C, then consumers always prefer A over C
A>B, B>C → A>C
Consistency property: if A = B, B = C → A = C
= equally attractive
Importance of transitivity
Prevents inconsistent preference cycles (money pump)
Money pump cycle
Someone repeatedly pays to exchange one bundle for another and end up back where they started (money pump)
If A>B, B>C but C>A
then u would pay to go from C→B, then B→A and then A→ again (this js doesn’t make sense)

Importance of completeness + transitivity
Allows us to:
Rank bundles in terms of preference
Use a utility function to represent consumer's preferences
Guarantees the budget allocation problem has a solution
W/o these (esp completeness) → can’t compare bundles → impossible to determine best choice
Completeness → allows to compare affordable bundles
Transivity → ensures ranking is consistent (no cycles)
More-is-better property
More of a good is preferred to less, other things equal.
Free-disposal principle
If consumers can freely discard or store unwanted goods, having more can’t make them worse off
W/o cost
Ascociated w more-is-better property (bc sometimes having more can make u worse off)
FDP → more is better applies
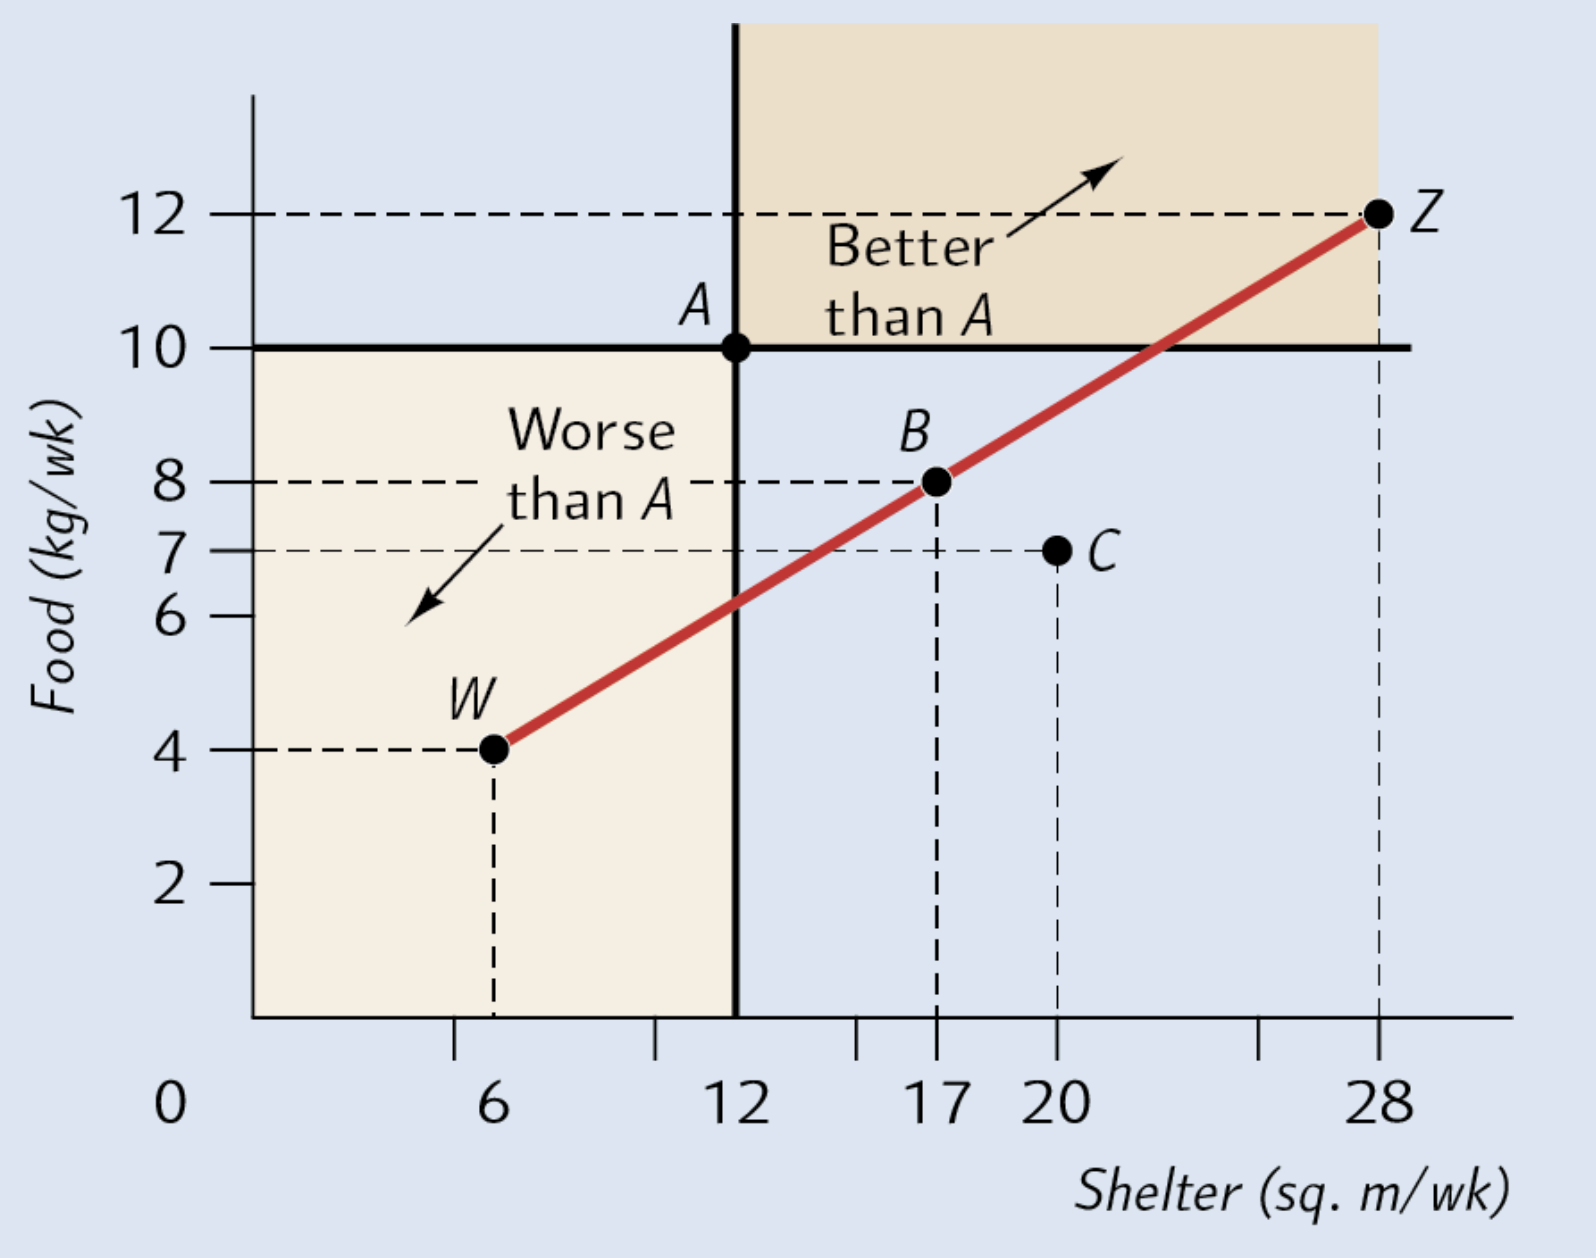
Explain this graph
Z>A bc it has more of each good than A does
A>W bc it has more of each good than W has
On the line joining W + Z, there is a bundle B that is equally attractive to A
Bc Z>A and A>W, continuity assumption → as u move from Z to W, u encounter a bundle that is equally attractive as A


Explain continuity
Small changes in a bundle don’t cause sudden jumps in preferences
Eg consumer wouldn’t have strong preference of 1kg food over 0.99kg
PO continuous if Z>W → any bundle sufficiently close to Z is > to W
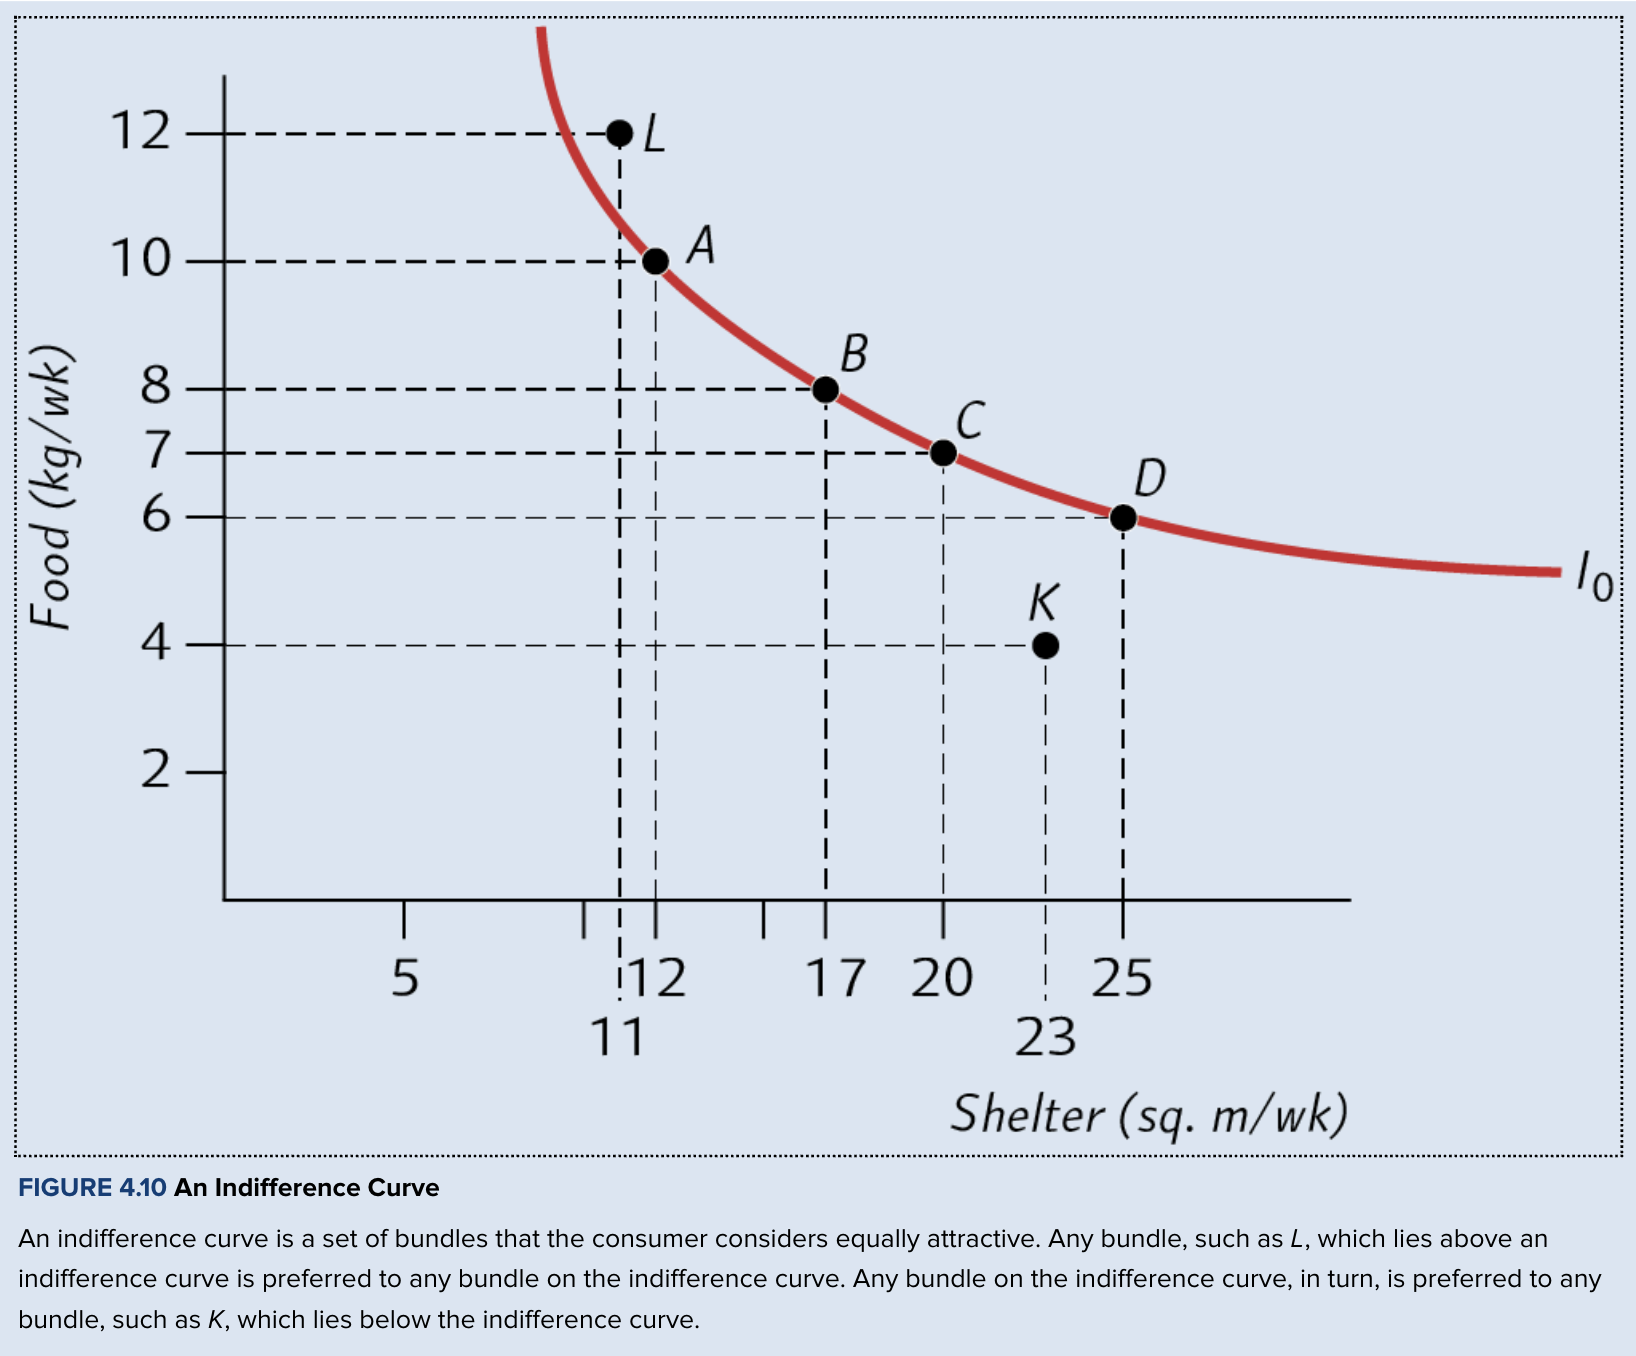
Indifference curve
A set of bundles among which the consumer is indifferent
All bundles are equally attractive to the consumer
Provide same level of satisfaction
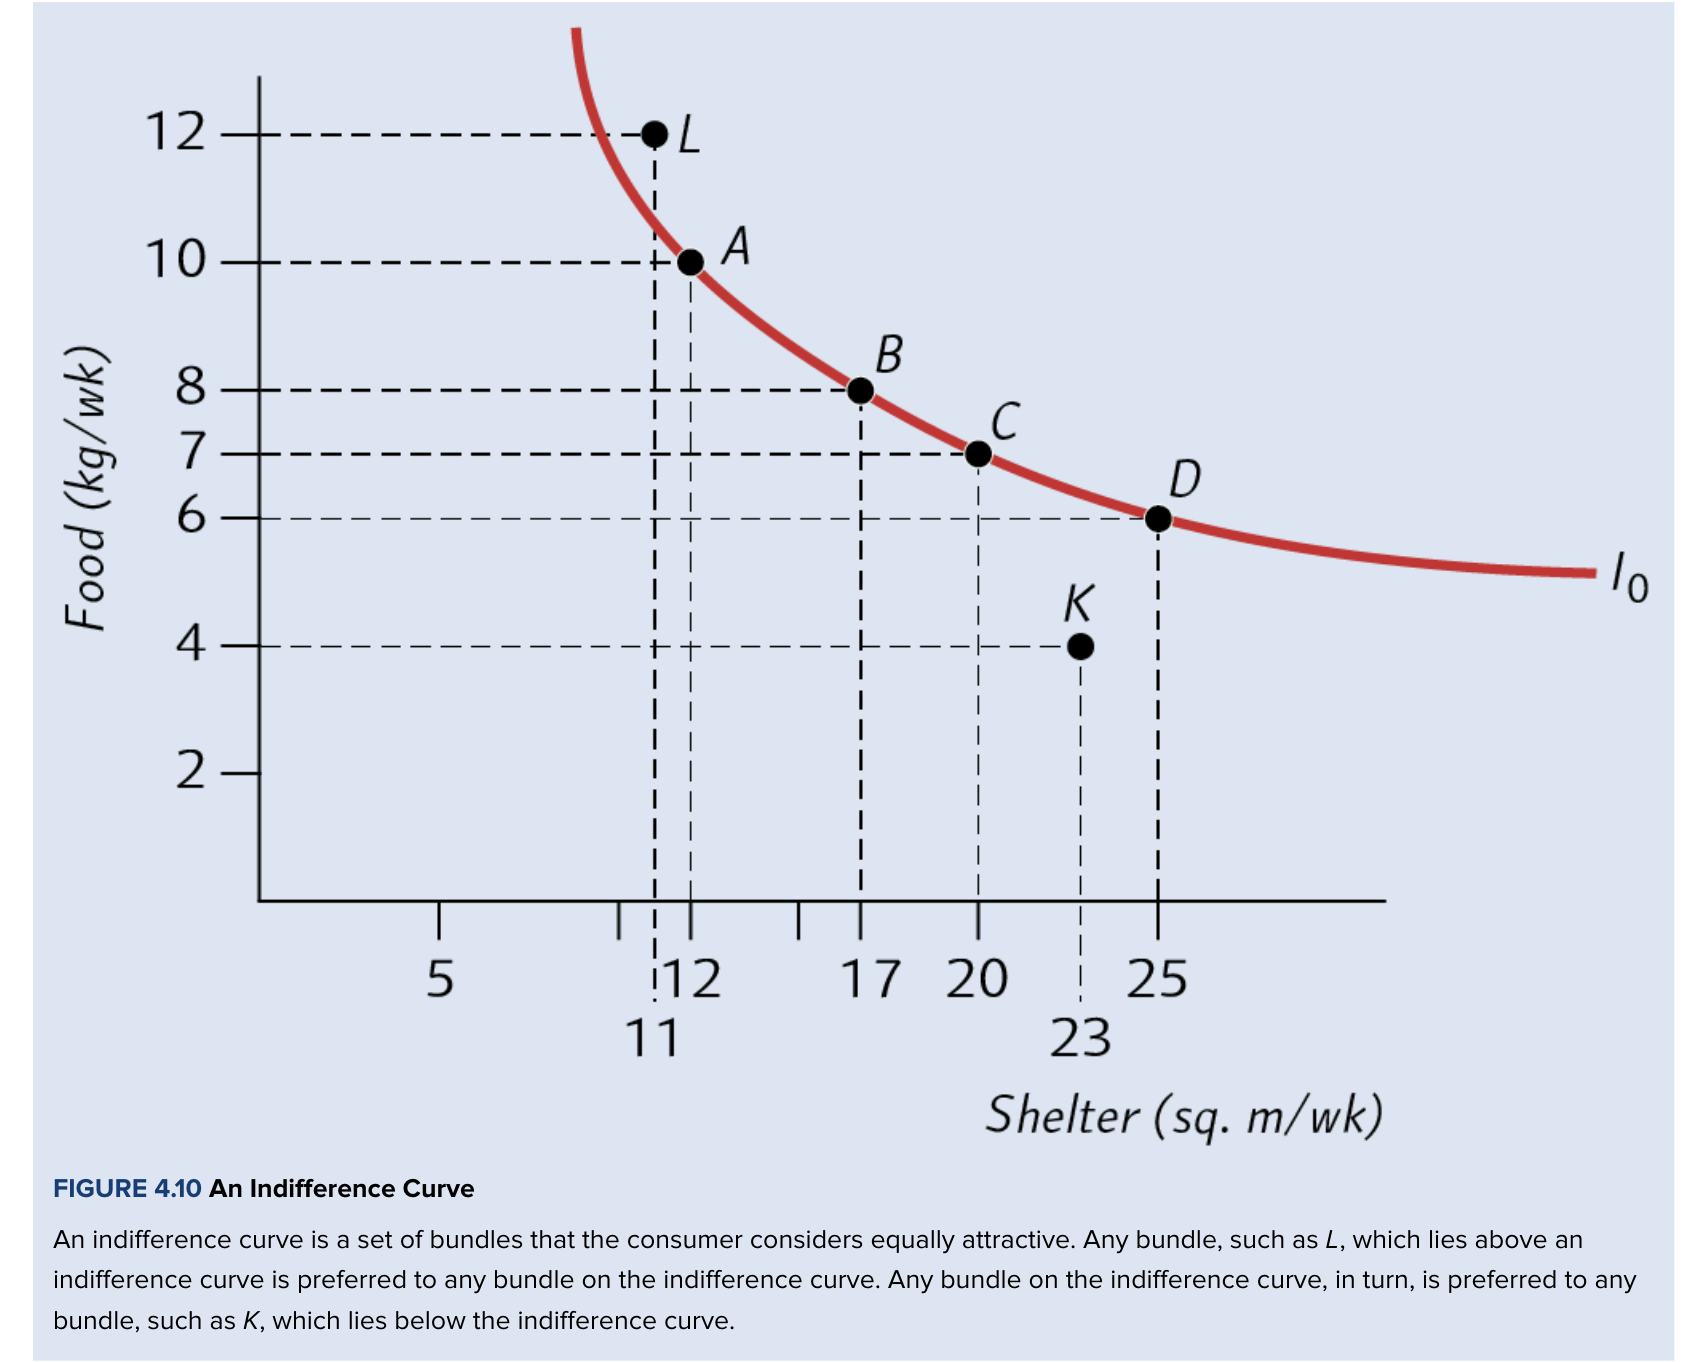
Bundles that lie on vs above vs below the indifference curve
On = equally attractive
Above = preferred to bundle on IC
Below = not preferred to bundle on IC
Above IC > on IC > below IC
>means preferred to
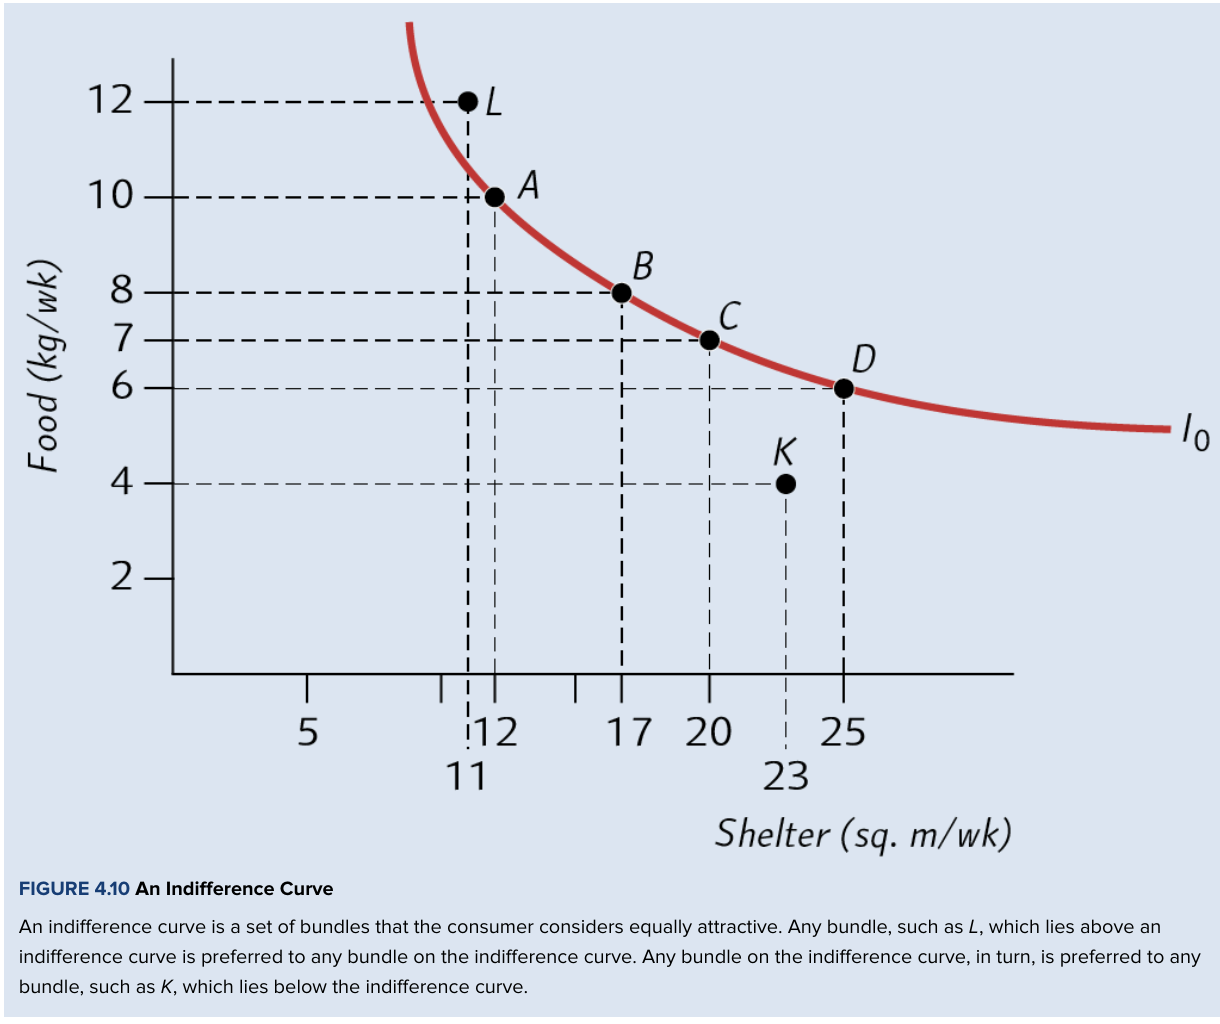
What does this indifference curve show?
C>K bc C on IC
C=D bc both on same IC
→ D>K (transitivity + more is better)
L>A
Is there an indifference curve that passes thru every possible bundle + which property explains this?
Yes (there is an IC that passes thru every possible bundle)
Completeness: ensures every affordable bundle can be compared
Indifference map
A representative sample of the set of a consumer's indifference curves
Graphical summary of their preference ordering
Entire set of consumers ICs


3 properties of indifference curves
IC are:
Ubiquitous
Downward sloping
IC from the same indifference map can’t cross
Explain indifference curve property: ubiquitous
Any bundle has an IC passing thru it due to completeness
Why are indifference curves downwards sloping? (develop this- don’t fully understand)
Bc of more-is-better property
To get more of good X, need to give up some of good Y → maintain constant utility + be on the same curve
Does satisfaction vary along an indifference curve?
No
Every point on an IC gives an equal amount of satisfaction (total utility = constant)
What happens if you increase quantity of good X without reducing quantity of good Y?
Consumer moves to a higher-satisfaction curve
Bc more is better. Increase satisfaction → higher curve
More satisfaction → can’t stay on same IC (bc every point gives same satisdaction
Why can’t indifference curves from the same map cross?
Bc it would violate transitivity (preference ordering assumption)
If they crossed, a single bundle of goods would provide 2 diff levels of satisfaction at the same time, which is impossible

Explain how this shows 2 indifference curves can’t cross.
D = E (same IC)
D = F (same IC)
→ E = F (transitivity)
BUT F>E bc more is better (it has more of both goods)
Not possible for 3 & 4 to be true at the same time → contradiction
So curves can’t cross
Due to completeness, every bundle…
Lies on an IC
Do indifference curve numbers measure absolute satisfaction?
No
Only show relative rankings
Marginal rate of substitution (MRS)
The rate at which the consumer is willing to exchange good Y for good X (good on horizontal axis)
At any point on an indifference curve
The amt of 1 good a consumer is willing to give up to obtain 1 more unit of another good, while keeping satisfaction constant
How is MRS calculated from an indifference curve?
The absolute value of the slope at that point
Eg MRS = 2 → consumer needs 2 kg of food to compensate for losing 1 m² of shelter

What does the slope of the indifference curve measure?
Marginal benefit of consuming more of a good
In terms of the other good
Budget constraint slope vs MRS slope
BC
Measures marginal cost of one good in terms of the other, based on prices.
Show shows the trade-off imposed by prices
(rate at which u can sub Y for X w/o changing total expenditure)
MRS
Measures marginal benefit of consuming more of a good, in terms of the other good
Shows the trade-off the consumer is willing to make based on preferences
(rate at which u can sub Y for X w/o changing total satisfaction)

Explain convexity
Consumers generally prefer balanced combinations of goods to extreme combinations

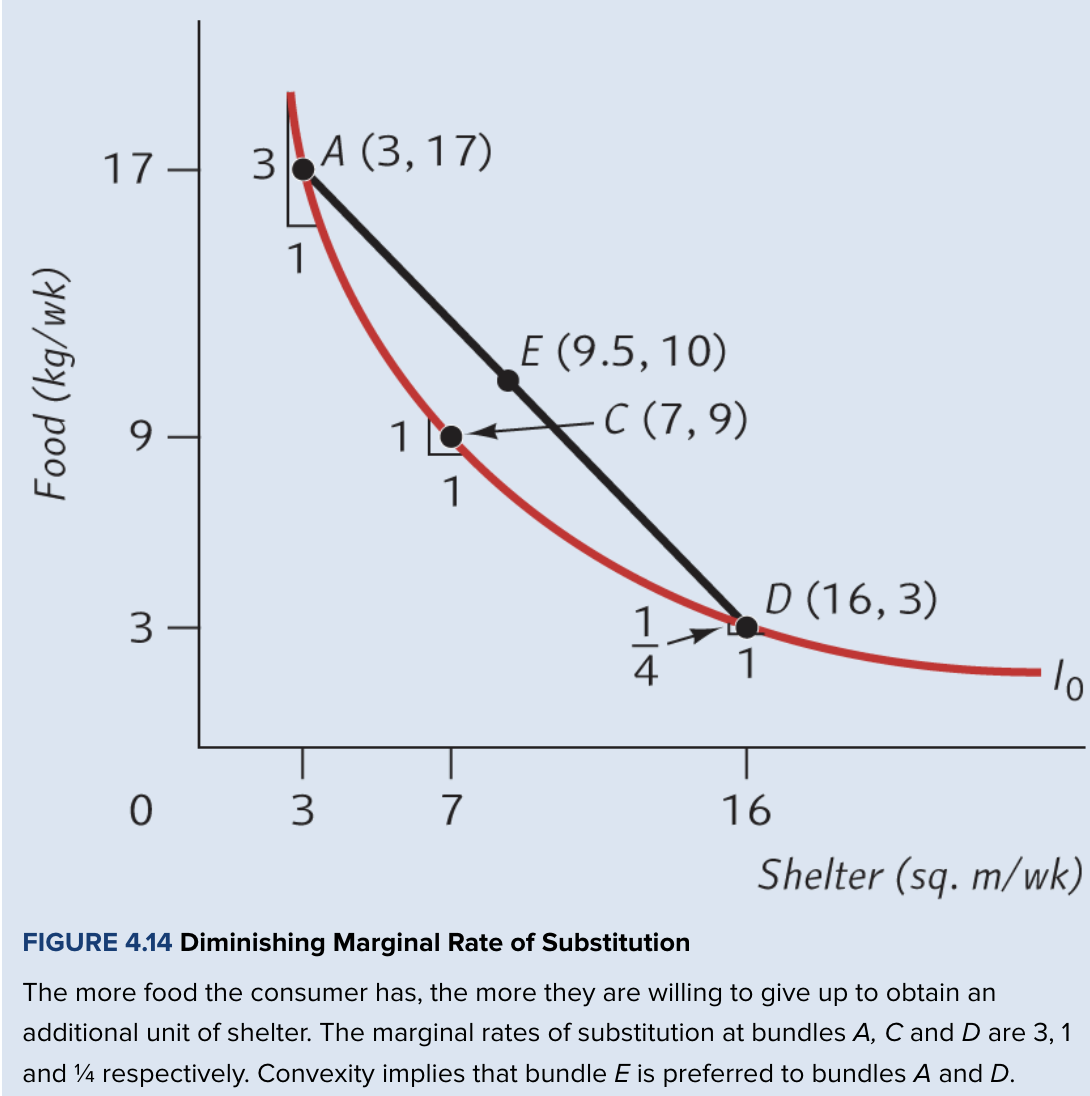
Does MRS increase or decrease as you move down (and right) an indifference curve?
Diminish
As a consumer gets more of one good and less of another, they become less willing to give up the good they have relatively little of to obtain more of the other.

Explain diminishing MRS using this graph
At A, food is plentiful, so the consumer would give up 3 kg of food for 1 extra unit of shelter. MRS = 3.
At C, the goods are more balanced, so they would give up only 1 kg of food. MRS = 1.
At D, food is scarce, so they would give up only ¼ kg of food. MRS = ¼.
E preferred to A and D
MRS diminishes!

Why are indifference curves convex?
Because consumers prefer mixtures of bundles to extreme bundles
Aka bowed outwards when viewed from origin
Do all consumers have the same preferences?
No
Diff consumer = diff preferences
What feature of ICs show that diff consumers have diff preferences?
The diff slopes