BIO 211: Statistics and Data Analysis
 Call Kai
 Learn
Learn Practice Test
 Spaced Repetition
 Match
Match Flashcards
 Knowt Play
1/184

Earn XP
Description and Tags
lectures 1-7 (quiz 1), Lecture 9-11
Name | Mastery | Learn | Test | Matching | Spaced | Call with Kai | Chat |
|---|
No analytics yet
Send a link to your students to track their progress
185 Terms
Science
A way of understanding the natural world by testing explanations
marginal probability
probability based on a single variable
joint probability
probability of outcomes for two or more variables or processes
Disjoint / mutually exclusive
cannot happen at the same time
non-mutually exclusive events
can happen at the same time
sum rule for disjoint outcomes
if outcome A and B are disjoint, then Pr(A or B) = Pr(A) + Pr(B)
Probability of one event or another occurring when they are non-mutually exclusive
Pr(A or B) = Pr(A) + Pr(B) - Pr(A and B)
Do the sum of probabilities of two disjoint events always add up to 1?
Not necessarily, there may be more than 2 events in the sample space
independence
knowing the outcome of one, provides no useful information about the outcome of another
gambler’s fallacy
thinking that random processes compensate for what happened in the past
product rule for independent outcomes
Pr(A and B) = Pr(A) x Pr(B)
probability distribution
lists all possible events and the probabilities with which they occur, must total 1
complementary events
two mutually exclusive events who’s probabilities add up to 1
sample space of one coin flip vs two
one : (H,T)
two : (HH, HT, TH, TT)
Pr [event] =
number of times the event happened / total number of samples
The probability of an outcome is the proportion of times an outcome would occur if…
we observed the random process an infinite amount of times
sample space
the collection of all possible outcomes of a trial
random / stochastic process
a process that can produce different possible outcomes; we can use a probability model to describe how likely each outcome is
examples of random processes
coin toss
die rolls
probability
a number assigned to an event that represents its long-run relative frequency or likelihood, with 0 meaning impossible and 1 meaning certain
if you sample too many times…
the observed frequency converges to the probability
central limit theorem
Given a population of any distribution with mean u and variance o2 , the sampling distribution of sample size n approaches a normal distribution with mean u and variance o2 / n
central limit theorem conditions
Sample observations must be independent
if the population distribution is skewed, a larger sample size must be used
why use means?
to average out outliers
The standard error of the mean is synonymous with…
the standard deviation of the sampling distribution
Is the variability of the sampling distribution smaller, equal, or larger than the population variability, and why?
it is smaller because sample means vary less than individual observations
as sample size increases…
the distribution of means has lower standard deviation
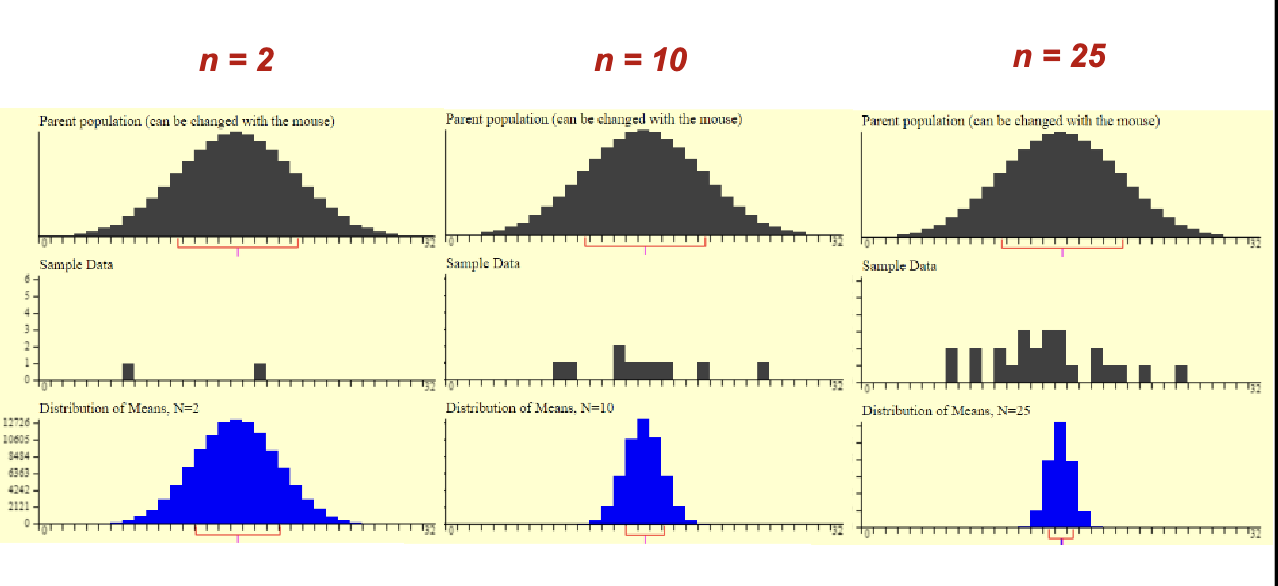
variance of sampling distribution of mean =
variance of population/sample size
the sampling distribution is…
symmetric and centered at the population true mean
The mean of the sampling distribution of the mean is…
equal to the mean of the population
What does it mean that the distribution of the sample mean is well approximated by a normal model?
95% of the sample means are within two standard deviations of the sampling distribution
What are the important properties of the sampling distribution of the mean?
The distribution of the sample mean is well approximated by a normal model
The sampling distribution is symmetric and centered at the population true mean
The standard deviation of the sampling distribution of the mean is the standard error of the mean
Standard error decreases as sample size increases
larger sample sizes have…
lower sampling variability and higher precision
Fact (Scientific)
Confirmed observations
Hypothesis
A testable statement
Theory (Scientific)
A logical explanation of a natural phenomenon built from facts, tested hypotheses, and laws.
Law (Scientific)
A descriptive generalization
Scientific Hierarchy of Importance
Theories, laws, hypotheses, and facts.
usual definition of Theory
merely a guess or hunch
Steps of Scientific Method
Ask a question or address a problem → Research → Hypothesis → Experiment → Analysis → Conclusion
What are the critical elements of the realistic scientific method?
self-correcting, iterative, built on reasoned evidence, aware of limitations, built on feedback between models and data
Model
A simplified representation of the world
Why are models useful?
they organize knowledge, explore consequences of our assumptions, generate testable predictions, guide data collection and experimental design, and integrate across scales and systems
What are the 4 types of models in ecology?
Conceptual, analytics, simulation-based, statistical
Conceptual models
food webs, flow diagrams
Analytical models
Lotka-volterra, logistic growth
Simulation-based
Spatial models, agent-based models
Statistical models
Regression, Bayesian hierarchical models
Statistics
Provides the theoretical framework for reasoning under uncertainty
Data Analysis
applies statistics principles to real datasets to extract insights and support inference
Descriptive statistics
Organizing and summarizing data
Inferential statistics
Using probability to determine how confident we can be that our conclusions are correct
Methods of showing frequency distributions
bar graphs and histograms
methods of showing associations between variables (5)
grouped bar graphs, mosaic plots, box plots, scatterplots, dot plot
Area of a histogram
frequency distribution of a numeric variable
height of a histogram
frequency
Bin width
smaller to be specific, too big can show nothing
Outliers in scatterplots help..
identify distribution skews, data collection and entry errors, and provide insight
science is uncertain because
It is built on limited reasoning and limited data, explanations rely on indirect information, and evidence is not always neat, alternative explanations can exist
numerical variables
it is sensible to add, subtract, or take averages with these values
categorical variables
The responses themselves are categories; the possible values are called the variable’s “levels”
Nominal scale
categories with no natural order
Example of nominal scale values
land types, alleles, species
Ordinal scale
categories ranked in some natural order
Examples of ordinal scale values
letter grades, sequences, clothing sizes
Discrete variable
can only take on a numerical value with jumps
Examples of discrete, numerical variables
whole numbers, years
Continuous variable
can take on any number, even beyond the decimal point
examples of continuous variables
wind speed, body temperature, beak length
Interval scale
numbers with a meaningful interval but no quantitatively meaningful zero
examples of interval scale
temperature in Celsius, years
Ratio scale
numbers with a meaningful interval and a meaningful zero
examples of ratio scale
length in cm, age, temperature in kelvin
univariate
one set of data that must be described
example of univariate data
snout vent length of salamander
bivariate data
two sets of data that must be described and correlated to each other
example of bivariate data
snout vent length vs elevation
multivariate data
2 or more sets of data that can be a mix of categorical and numerical data
example of multivariate data
snout vent length vs elevation and diet and species
Histogram
Shows numerical variables
has a zero baseline
must choose number of bins
no spaces between bins
fixed order
Bar Plot
Shows categorical data
no order
zero baseline
choose number of bins
spaces between bins
height = frequency of 2 or more categories
Pie chart
1 nominal variable shown, not used much
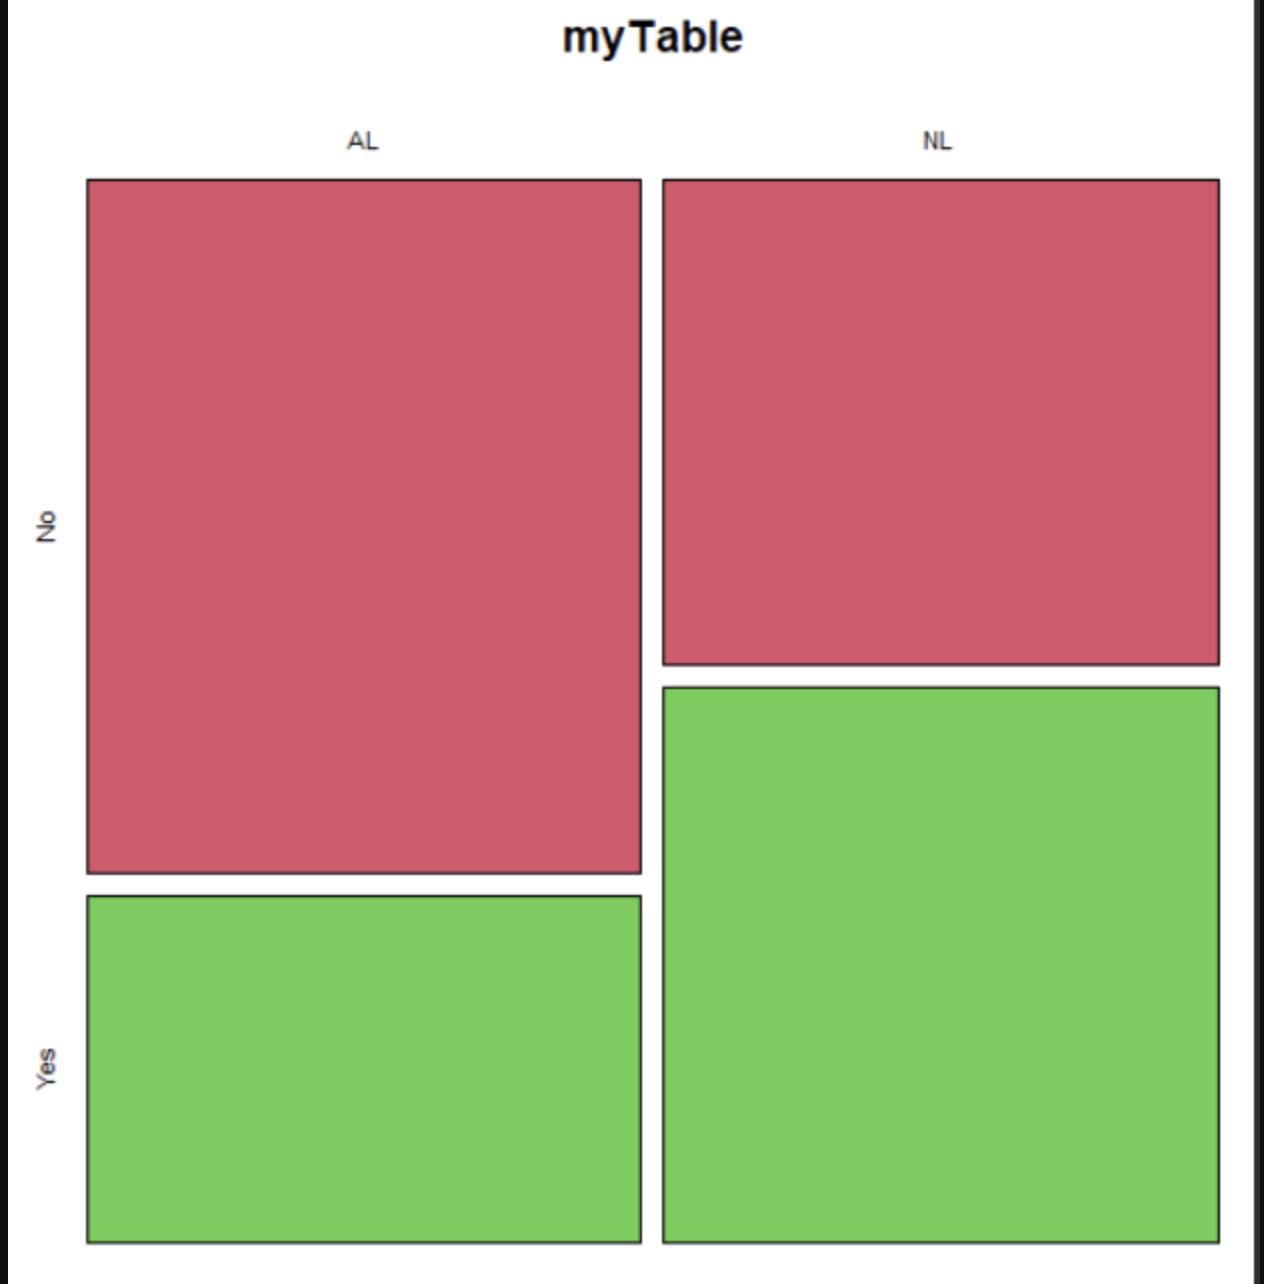
mosaic plot
lose some information
Scatter plot x-axis
independent/explanatory variable
Scatter plot y-axis
dependent/response variable
Mean
the point at which a distribution would balance
median
the value that minimizes the sum of absolute deviations; splits the data in half when ordered in ascending order
What is special about the mean?
it is sensitive to extreme values
Unimodal distribution
has one peak
bimodal distribution
has two peaks
multimodal distribution
has multiple peaks
uniform distribution
has no peaks, plateau
Positive/right skew
long tail on right side
Negative/left skew
long tail on left side
Severe skew
All measures are different, so no measures of central tendency will be good to use, but median is more useful
What measure to use for symmetrical distributions?
the mean because its more precise
In a bell curve what is special?
Mean = Mode = Median
What is not a measure of central tendency?
interquartile range
Variability
how spread out a group of measurements is
what are the measures of variability?
range, interquartile range, variance, and standard deviation