Ecology Exam 3
 Call Kai
 Learn
 Practice Test
 Spaced Repetition
 Match
 Flashcards
 Knowt Play
1/154

There's no tags or description
Looks like no tags are added yet.
155 Terms
Abundance
Number of individuals present in a particular area
Describe challenges in measuring abundance
Measuring accurately
Simple counts might mask most important details
Correlations do NOT equal causations
Why is it difficult to measure accurately?
Not every organism can be easily detected or counted → ecologists may underestimate or overestimate abundance
Why might simply counting mask important details?
Doesn’t tell you about the population’s health, structure, or future growth
Why do correlations make it difficult to measure abundance?
Two variables changing together doesn't prove that one causes the other to change → ecologists need additional evidence such as controlled experiments to establish causation
Describe why understanding the cause of abundance changes can be difficult
Many different biological and environmental factors can influence population size simultaneously, making it hard to determine which factors are responsible for the changes
Why is it important to study abundance changes?
If we can predict changes in abundance we can understand the underlying biological mechanisms influencing that population
If we can predict it we might be able to control it
Pest control: If scientists determine that a particular predator reduces pest abundance, they may be able to use biological control to manage pest populations
Conservation: If scientists discover that habitat loss is causing an endangered species to decline, they can focus conservation efforts on protecting or restoring its habitat
Provide examples where population cycles are generated by factors more complex than simple predator-prey or resource competition relationships: Snowshoe hares & Canada lynx
Snowshoe hares & Canada lynx
Snowshoe hare population cycles are also influenced by:
Stress hormones → presence of predators increases corticosteroid levels in hares which can decrease reproductive success even when the hares aren’t killed
Epigenetic effects → mothers can pass elevated stress responses to their offspring which can suppress reproduction even after predator abundance decreases
So hare populations may remain low even when food becomes available & predator populations decline
Provide examples where population cycles are generated by factors more complex than simple predator-prey or resource competition relationships: Red grouse & nematodes
Red grouse & nematodes
Red grouse population cycles are influenced by:
Parasitism → nematode infections reduce grouse reproductive success & survival
Aggression → older males become more territorial & aggressive as grouse abundance increases preventing younger males from establishing breeding territories
Delayed effects → even after aggression decreases younger males may not return reducing reproduction
Interaction between hormones & parasites → increased testosterone promotes aggression but also suppresses immune function making males more susceptible to nematode parasitism
Saprotrophs
Organisms that use dead organic material and/or organic waste to obtain energy
Organic nutrient
Part/recently part of living thing
Inorganic nutrient
Not part of living thing
What are the two groups of saprotrophs?
Decomposers
Detritovores
Decomposer
Bacteria, archaea, and fungi that break down organic material
Detritovore
Animals that consume dead organic material and/or organic waste
Detritus
Decaying organic matter that serves as food for saprotrophs
Nutrient cycling
Immobilization (inorganic → organic)
Consumption (transfer of organic nutrients between organisms)
Mineralization (organic → inorganic)
Immobilization
Inorganic nutrient element is incorporated into an organic form
primarily when plants absorb inorganic nutrients from the soil & incorporate them into organic compounds growth
Consumption
Consumers eat other organisms & obtains organic nutrients stored in their tissues
Mineralization
Conversion of elements from an organic to inorganic form
decomposers + detritovores break down organic matter & release nutrients in inorganic forms → cycle can then repeat
Describe the role that saprotrophs play in ecosystems
Decomposers + detritovores break down complex, energy-rich organic molecules from dead organisms and waste. Through decomposition and mineralization, they release carbon dioxide, water, and other inorganic nutrients back into the ecosystem making nutrients available for reuse by producers
Explain how saprotrophs differ from predators who feed on recently killed organisms
Heterotrophs all directly affect the rate at which their food is produced
e.g. they kill their food source then consume
Saprotrophs do not control the rate at which their resources are made available or regenerate → they are dependent on the rate at which some other force releases the resource on which they live
e.g. they do not kill their food source but rely on other organism to kill then consume
Examples of ways saprotrophs indirectly obtain their resources
Senescence
Illness
Fighting
Shedding of leaves by trees
Discuss how saprotroph-resource dynamics will differ from predator-prey dynamics
Predators & parasites influence the density of their resource BUT saprotrophs do NOT influence the density of their resource
Donor control
The donor (source of organic material) controls the density of the recipient (saprotroph) and not vice versa
Explain why there are entire ecosystems that depend on unpredictable donations of dead matter: whale fall example
In deep sea ecosystems sunlight cannot reach the deep ocean so photosynthesis cannot provide food directly to organisms living there → depend on dead organic matter sinking from the ocean’s surface
Whale fall: when a whale dies & its body sinks to the ocean floor providing a large amount of organic matter to deep sea organisms for years
How does this demonstrate donor control?
The organisms living on the ocean floor cannot control when a whale dies or where its body sinks → they are completely dependent on this unpredictable donation of organic matter from another part of the ecosystem
Therefore, the availability of food is controlled by an external process rather than by the organisms consuming it
Explain why there are entire ecosystems that depend on unpredictable donations of dead matter: marine snow example
Marine snow: tiny particles of organic matter than continuously sink from the upper ocean into deeper waters providing food & nutrients for deep sea organisms
Describe how mutualism is involved in saprotroph dynamics
Plants and saprotrophs are linked by an indirect mutualism mediated by nutrient recycling → plants provide energy and nutrients in organic form that are used by saprotrophs and saprotrophs mineralise the organic material back to an inorganic form that can again be used by plants
Aerobic decomposition
Oxygen is present
Anaerobic decomposition
Oxygen is not present or is low
Why are shallow-water sediments more likely to become anoxic?
More organic matter → More decomposition → Faster oxygen consumption → Anoxic conditions close to the surface

Why can oxygen reach deeper into deep-ocean sediments?
Less organic matter → Less decomposition → Slower oxygen consumption → Oxygen diffuses farther into the sediment

Explain how organic material is processed in stages
Easiest components are decomposed first → sugars (less resistant to decomposition)
Cellulose, lignin, etc are decomposed last (more resistant to decomposition)
Why does fungal community composition change depending on the type of dead organic matter available for decomposition?
Different fungal species have different enzymes that allow them to break down specific organic compounds
As decomposition progresses, the types of organic compounds remaining change → this causes different fungal species to become dominant over time
Describe how fungal community shifts composition depending on dominant waste remaining
Early decomposition: Fungi that break down simple compounds, such as sugars and starches, are more abundant because these materials are easier to decompose
Intermediate decomposition: As simple compounds are depleted, fungi capable of breaking down more complex materials, such as cellulose, become more dominant
Late decomposition: Eventually, mostly resistant compounds, such as lignin, remain. Fungi capable of breaking down these difficult materials become more abundant
Give different examples of decomposers and detritivores and describe how their feeding niches differ
Decomposers & detritivores form communities that break down organic material (often from largest to smallest). Different organisms specialize in processing different types and sizes of organic material:
Shredders: feed on coarse organic matter (> 2mm) and serve to fragment the material
Collectors: feed on fine organic matter (< 2mm)
Collector-gatherers: obtain dead organic particles from the debris & sediments on the bed of the stream
Collector-filterers: filter small particles suspended in flowing water
Grazer-scrapers: have mouthparts appropriate for scraping off & consuming organic layer attached to rocks
Microbivore
Organism that feeds on microorganisms growing on detritus but not the dead material itself
Are microbivores likely to be subject to donor-controlled dynamics?
Unlikely → they consume a living resource so they can directly reduce microbial density
Describe how saprotrophs evolve alongside living communities
Saprotroph communities have long evolutionary history with the typical wastes in their local area → they adapted to the types of organic matter those communities produce
Dung beetles & cow ex:
Native Australian dung beetles were adapted to marsupial poop but were less effective at decomposing introduced cattle poop
Cow poop accumulated until dung beetles adapted to large grazing mammals were introduced to help break it down
Describe how competition is involved in saprotroph dynamics
Saprotrophs break down nutrients for their own purposes & can make use of inorganic nutrients in the environment
Stoichiometric constraints on carbon & nutrients can lead to competition between plants & saprotrophs → usually for N in terrestrial communities, P in freshwater, and both in marine communities
What conditions must be met for plants & saprotrophs to coexist?
If decomposer growth is limited by the availability of carbon in the detritus
If the competitive ability of the decomposers for a limiting nutrient (e.g. nitrogen) is great enough, compared with that of plants
Why do animals decompose faster than plants?
The nutrient composition of animal tissues is more similar to the nutrient requirements of decomposers and detritivores (higher in protein & fat than plants) → decomposers can often grow and reproduce more quickly when consuming animal tissues, leading to faster decomposition
Animals contain more easily decomposed materials → proteins & fats break down faster than cellulose & lignin in plants
Population
Group of individuals of the same species in one area
Community
Group of interacting populations
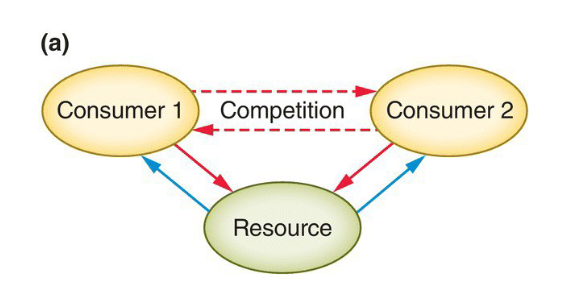
Community module
Small group of tightly interacting species
The building blocks from which whole communities are constructed
Community module example: exploitative competition
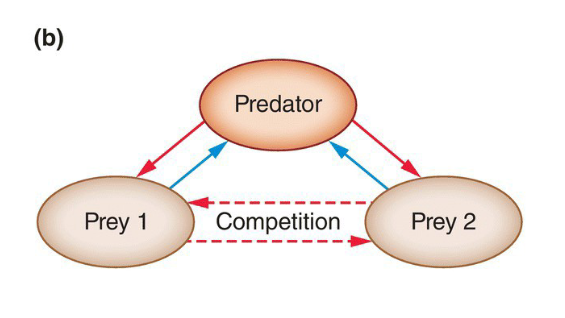
Community module example: apparent competition
Community module example: three competitors

Community module example: two prey sharing both a predator + a resource
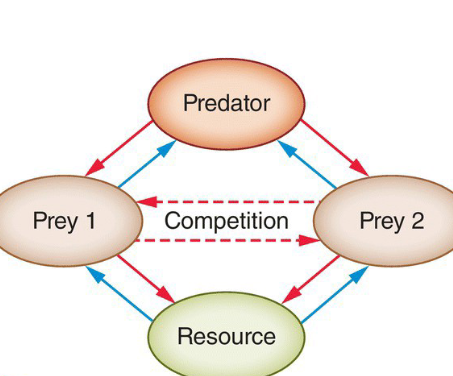
Community module example: facilitation

Community module example: food chain
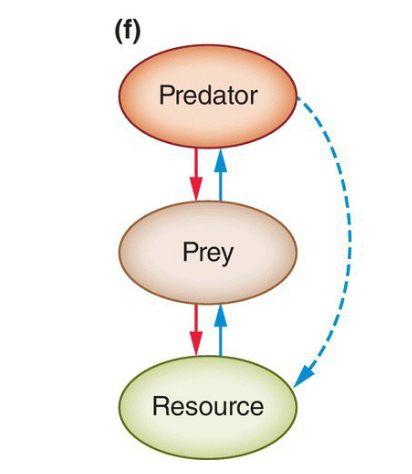
Explain how community modules are useful in understanding dynamics in complex ecosystem
Simplify complex ecosystems → community modules allow ecologists to focus on smaller groups rather than the many species interactions in an ecosystem
Help identify important interactions → by focusing on a few species ecologists can better understand how predation, competition, or mutualism impact population abundance
Help predict changes in community structure → understanding how species interact within a module can help ecologists predict how changes in one species might affect others
Food chain
Sequences of species running from a basal, autotrophic species to a species that feeds on it, to another species that feeds on the second, and so on up to a top predator (fed on by no other species)
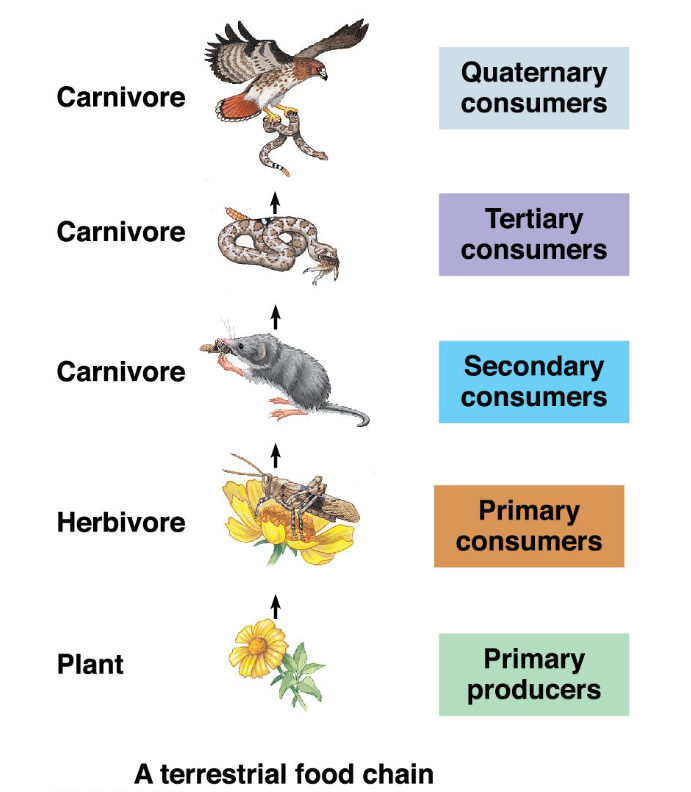
Purpose of food chains in understanding community dynamics
Individual chains are identified purely as a means of trying to understand aspects of the structure of food webs
Trophic level
Position of an organism in a food chain/food web
Food web
A natural network of interconnected food chains that shows how energy and nutrients move through plants, animals, and other organisms in an ecosystem
Why is the removal of a species a powerful tool in unraveling the workings of a food web?
Removing an organism can shed light on its role in the web
Food web experiment: presence of birds on limpets & algae
Food web: birds eat some limpet species → limpets eat fleshy algae
When birds are present: abundance of limpets is reduced → more algae is present
When birds are excluded: limpets are more abundant → less algae is present

Food web experiment: presence of birds on barnacles & mussels
Food web: birds eat barnacles → barnacles are filter feeders (compete with mussels)
When birds are present: abundance of barnacles is reduced → more mussels are present
When birds are excluded: barnacles are more abundant → less mussels are present
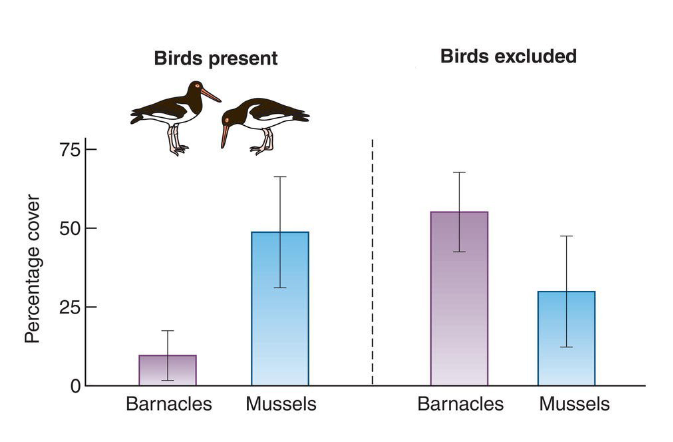
Food web experiment: complex interactions
Birds eat barnacles that L. digitalis limpet species use to hide → suppression of L. digitalis → allows inferior competitor L. strigatella to persist in community
Birds consume barnacles (remove competitor) → allows mussels to expand

Trophic cascade
When a predator has indirect effects on lower trophic levels by reducing the abundance of their prey
Trophic cascade example
Wolf abundance increases → elk abundance decreases → plant abundance increases
Trophic cascade → wolves don't directly affect plants by consuming them. Instead, they indirectly benefit plants by reducing the abundance of herbivores that eat them
Mesopredator
Smaller predator that is eaten by an apex predator
Mesopredator release
A predator at the very top of a chain (an ‘apex’ predator) feeds on typically smaller predators (mesopredators), such that the loss or decline of the apex predator allows the abundance of the mesopredator to increase, threatening the abundance of their own prey
Trophic cascade: mesopredator release example
Dingoes (apex predator) prey on foxes & cats (mesopredators) → foxes & cats prey on small native wildlife such as dusky hopping mouse
When dingoes are present: foxes & cats are less abundant → hopping mouse is more abundant
When dingoes are absent: foxes & cats are more abundant → hopping mouse is less abundant
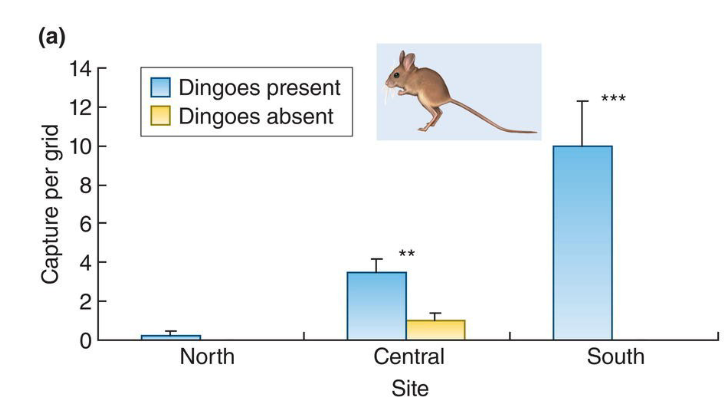
Top-down control
Upper trophic level regulates abundance of one below it
Bottom-up control
Factors below the trophic level regulate its abundance (e.g. resources, conditions)
Top-down control example
Wolf populations increase
More wolves consume more deer, decreasing deer abundance
Fewer deer means less grazing on grass
Grass abundance increases
Bottom-up control example
Nutrient availability in the soil increases
More nutrients allow grass to grow
More grass provides additional food for deer, increasing deer abundance
More deer provide additional food for wolves, potentially increasing wolf abundance
Bottom-up control experiment
Plants are clipped (fewer defensive secondary compounds + more nutrients) → more flower heads were infested with seed eaters → herbivores consumed more leaves on clipped plants → predator abundance was significantly higher on clipped plants

How does the whale fall example represent bottom-up control?
A whale dies and sinks to the ocean floor, providing a large amount of dead organic matter
Decomposers and scavengers consume the whale, increasing the availability of energy and nutrients to the deep-sea food web
Other consumers benefit, as the whale fall supports a community of organisms at multiple trophic levels
Meta-analysis
A quantitative statistical approach used to combine, synthesize, and analyze numerical results from multiple independent primary studies addressing the same ecological question or hypothesis
Meta-analysis methodology
Identify a research question: Determine the specific relationship or effect of variable being investigated
Collect relevant studies: Gather multiple studies that have investigated the same or similar questions
Extract data: Collect relevant results from each study, such as effect sizes and sample sizes
Combine and analyze results: Use statistical methods to estimate the overall effect across studies, while accounting for differences among them
Draw conclusions: Determine whether an overall pattern exists and how consistent the results are across studies
Meta-analysis example: top-down effects
Studies typically find top-down effects on both herbivores & plants but the effects are opposite:
Top-down effects on herbivores: predators have a negative effect on herbivores → when predators are present, herbivore abundance decreases
Top-down effects on plants: predators have a positive effect on plants → when predators are present, they reduce herbivore abundance which decreases the amount of vegetation consumed

Meta-analysis example: bottom-up effects
Fertilization typically has a positive effect on plants but no significant effect on herbivores:
Bottom-up effects on herbivores: fertilization has no significant effect on herbivores → error bars cross zero margin
herbivores may still be limited by top-down effects
Bottom-up effects on plants: fertilization increases the nutrients available to plants → allows more plants to grow increasing plant abundance

True or false trophic cascades must impact multiple levels
True
True or false: top-down and bottom-up effects may only impact one level
True
Properties of communities
Structure
Productivity
Stability
Community structure
The organization of these species including the number of species, interaction strength within the food web, average length of food chains, etc.
Productivity
The rate of biomass production. Governed by primary productivity → how much photosynthesis happens
Primary producer
An organism that manufactures its own organic compounds (food) from inorganic sources of energy and carbon
Stability
Describes how a community responds to disturbances and its ability to resist changes or recover afterward
Interacts with structure + productivity
Disturbance
An event that disrupts an ecosystem or community, causing changes in species abundance, community structure, or resource availability
Disturbance: pulse
A single event with the potential to alter the state of a community
ex: wildfire, hurricane, a flood
Disturbance: press
A persistent change in some factor or factors with the potential to determine the state of the community
ex: long-term pollution, continuous livestock grazing, prolonged drought
What are the three types of stability?
Resistance
Resilience
Robustness
Resistance
The extent to which a community is altered by a disturbance → 100% resistant = no changes
Resilience
The time it takes the community to return to its original state → less time = more resilient
Robustness
The tendency of a community to suffer subsequent, secondary extinctions after primary extinctions from disturbance
Proportion of the original number of species that need to suffer a primary extinction to get a total number of extinctions equal to a set percentage (typically 50%) of the species originally present
What makes communities more stable?
Biodiversity
Particular adaptation → genetic diversity
Dispersal techniques → community size
Generalists → more connections
Habitat availability
Keystone species
Complexity
Connectance
Keystone species
Species with unusually large effects on community structure. Have strong direct + indirect interactions with other community members
Examples of keystone species
Wolves → large top-down effect on their environment by limiting elk abundance
Prairie dogs → their burrows provide shelter for numerous species
Beavers → build dams that create habitats for many species
Why are humans considered hyper-keystone species?
Humans operate as a higher-order force that affects other keystone species and reshapes food webs
Complexity
Can be measured in different ways:
More species (species richness)
More interactions between species
Stronger connections between species
Connectance
The fraction of all possible pairs of species that interact directly in a food web
Why can higher connectance lead to more stability?
Species have more feeding relationships, providing alternative pathways for energy to flow through a food web:
Alternative food sources
Reduced dependence on individual species
Disturbances may have less severe effects
Increased stability: connectance example
Pattern of the graph: positive relationship between connectance + robustness
Communities with low connectance: experience widespread secondary extinctions after relatively few species are removed
Communities with high connectance: withstand more species removals before experiencing widespread secondary extinctions
How robustness is affected when species are removed:
Red: When the most connected species are removed first, numerous feeding relationships are disrupted → robustness is lowest
Yellow: When most connected species were removed first excluding basal species, organisms at the base of the food web remained to support consumers → robustness was generally higher than red
Blue: When species were removed at random → robustness was higher than when connected species were removed first

Example of complex community leading to greater stability
In community A: a fox only has one food source → rabbits
If rabbits disappear, foxes lose their only food source
In community B: a fox has 3 food sources → rabbits, mice, voles
If rabbits disappear, foxes can still eat mice + voles → community B is more resistant to disturbances (more stable) because it has greater connectance
Why aren't complex communities always more stable?
More connections can sometimes make a community less stable because:
Disturbances can spread through more species
Strong interactions can amplify population fluctuations
Changes in one species can indirectly affect many others
Ex: if a predator eats several prey species, a major increase in that predator's population could cause declines in multiple prey populations