Conservation Bio Midterm 1
 Call Kai
 Learn
Learn Practice Test
 Spaced Repetition
 Match
Match Flashcards
 Knowt Play
1/250

There's no tags or description
Looks like no tags are added yet.
Name | Mastery | Learn | Test | Matching | Spaced | Call with Kai | Chat |
|---|
No analytics yet
Send a link to your students to track their progress
251 Terms
Extinction:
loss of all individuals in the population of a given species
local extinction:
species disappears in one geographic area but persists in other areas (also called extirpation)
Global Extinction
loss of species over its entire range
Endangered Species:
A species that is presently threatened with extinction
What makes a species vulnerable to extinction?
Valuable and easy to harvest
• Low reproductive rate (often long-lived species)
• Larger animals
• “Rare” species
• narrow habitat/niche
• small populations
• small geographic ranges
• Combination of these characteristics
• Poor dispersal ability
• Dependent on some other species
• Seen as a pest by humans
Local Extinction of North American buffalo (Bison bison)
Bison losses from hunting
Not in danger of extinction
Because now domesticated
For meat.
Bison have mostly been replaced with cattle
Very different ecological effects
Cattle crop grass much lower down
Cattle require less land, but reduce biodiversity,
increase erosion and cause topsoil loss
Columbicola extinctus
passenger pigeon chewing louse
Found (dead obviously) on
museum specimens in 1937
IUCN Red List
International Union for Conservation of Nature
Non-profit, non legislative
most species have NOT been assessed, little data used in most assessments
Many assessed species are “DD” – Data Deficient
Threats to - cause endangerment
biodiversity
IPAT equation
I = P x A x T
I = Environmental impact
P = Population
A = Affluence
T = Technology
T or F: usually only one threat is present to a species
F: usually multiple
T or F: Direct observation of recent extinctions is only really possible for well studied species
T
Why does habitat loss cause endangerment
less area = fewer species
The -(smaller or bigger) the patch, the more species you will lose when you destroy a unit of habitat!
smaller
Why species-area relationships might Overestimate (or appear to overestimate) extinction
1) Species take time to go extinct. After loss of habitat
there may be an “extinction debt” – species
doomed but not yet extinct.
Estimates run as high as 70,000 – 2,700,000 already
doomed
“Extinction debt”
is good news because species doomed
by habitat loss might still be saved if we act!
T or F: Protected areas might be better for biodiversity than average
T
If we preserve the very best
areas for biodiversity -
we may
be able to preserve way more
biodiversity than “total area”
would have predicted
SAR does not account for species
does not account for species that can live in
the new (converted) habitat
Why species-area relationships might underestimate
extinction
They don’t account for any factors other than
habitat loss.

C
Biggest threats to plants and animals for extinction
habitat loss
invasive species are a big “cause”
Simple species (bivalve mollusks, plankton) have average durations
of - (years) before extinction
10 million
Mammals tend not to persist for more than -(years)
3 million
T or F: Recent extinction rates are way above background extinction rates
T
T or F: Probable speciation rates are also up, but much less than extinction rates
T
Endangered Species Act 1973
• US government law
• Managed by US Fish and Wildlife Service and National Marine Fisheries Service
• designed to protect critically imperiled species from extinction as a "consequence of
economic growth and development untampered by adequate concern and
conservation."
What does the endangered species act actually do
Federal government must avoid adverse impacts on critical habitat.
Prohibits all “take” of listed animals on private land. Prohibits “malicious damage” to listed plants on private land.
The act protects “distinct populations” of animals, but not of plants and invertebrates
To be considered for listing (as Endangered or Threatened),
the species must meet one of five criteria (section 4(a)(1)):
1. There is the present or threatened destruction,
modification, or curtailment of its habitat or range.
2. An over utilization for commercial, recreational, scientific,
or educational purposes.
3. The species is declining due to disease or predation.
4. There is an inadequacy of existing regulatory mechanisms.
5. There are other natural or manmade factors affecting its
continued existence.
Endangered Species Act
- Success:
prevention of 227 extinctions
Endangered Species Act
- Shortcomings:
42 species went extinct while being considered for
listing (before declared endangered)
- Average time to get listed is >10 years
- Between 40-90% of U.S. species listed on IUCN Red
List are not listed on ESA
Which group is the endangered
species act best structured to protect?
Vertebrate animals
Preservation ethic focuses on
biodiversity
Sustainable use ethic focuses on
ecosystem services
What is biodiversity good for?
Biodiversity is a source of provisioning services (e.g. new medicines)
Supporting services=>
ecosystem function
What are ecosystem functions?
• primary productivity
• soil fertility
• water quality and availability
• resistance to disturbance
• speed of recovery (resilience)
In Minnesota grassland, productivity (increases or decreases) with diversity
increases
Capacity to resist disturbance (increases on decreases) with diversity
increases
The extinction of the passenger pigeon
is hypothesized to have resulted in what change in
eastern north America?
A) Increased Lyme disease risk
B) Decline of eastern gray squirrels
C) Increase in nutrient transport
D) Lighter, more open-canopy forest habitats
A
World is warming
Arctic permafrost is melting
- Disease outbreaks, giant craters, flooding
Decomposing organic mater releasing methane
and CO2 could cause runaway climate change
Pleistocene park
Wants to use EXTINCT large herbivores to
return Siberia to grassland
What species should we revive?
1. Preferentially select de-extinction candidate species that
have low levels of functional redundancy.
2. Prioritize species for de-extinction that went extinct
recently.
3. Concentrate on the resurrection of species that can be
returned to functionally meaningful abundance levels
Reversing extinction methods
Option 1 – breed something similar from
existing DNA
Option 2 – mix existing DNA with DNA from
extinct organisms
Option 3 – insert genome of extinct
organisms into modern surrogate
Option 1 – breed something similar from
existing DNA
- Can definitely work
- New tools expands remix options
- Does not add to genetic diversity
- Does not really reverse an extinction
- BUT result could replace a lost
ecological function
“backbreeding”
-Cross breed primitive cattle breeds to create an ecological proxy for auroch
-Goal is wild grazer that maintains grasslands on land no longer farmed
-Prioritize function over genotype/phenotype match
breed something similar from
existing DNA
- Select for mammoth-
like traits from existing
elephants
- Add genes for hair, cold
tolerance from OTHER
existing species
- CRISPR opens huge
possibilities….
mix existing DNA with DNA from
extinct organisms
- Might work … but:
- Can we recover enough intact DNA
- Can we identify relevant genes?
- Revives lost genetic diversity
- Does not really reverse an extinction
splice existing DNA with DNA
from extinct organisms
Liquid blood recovered from frozen mammoth, hair
preserved from various Pleistocene mammals….
mix existing DNA with DNA from
extinct organisms
- Current plan is to start with
Asian elephant
- Add mammoth genes for more
hair, smaller ears, more body fat
- Use African elephant as
surrogate
- Will it still be an Asian elephant?
insert genome of extinct
organisms into modern surrogate
Based on
existing cloning
technology
- Can it work?
- Probably someday with good DNA
- Unclear with ancient DNA
- Can we find a modern surrogate that would work?
- Recovers genetic diversity
- Truly reverses an extinction
POPULATION
a group of actually or potentially interbreeding organisms occupying a
defined area during a specific time.
A population can be described by
the number of individuals in it
T or F: In many cases a count of females only is used
T
Why is a ‘population’ a unit of interest to us?
Human interests and management often occur at population-level scales
Census
count of all individuals
Total population
Number observed
T or F: A true census is rare.
T
Census mapping trees
technically easy still expensive
Census can be an
aerial survey of large mammals in fixed areas
Tails of humpback whales are used to
identify each individual for a census if we stop seeing new individuals
Census is more common
in conservation and in small intensively managed populations than in ecology more broadly
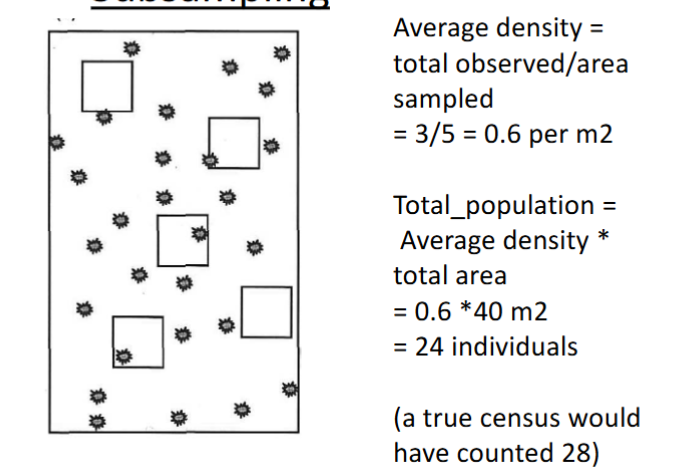
Population estimate
guess at total based on observing a subset of the population:
- Extrapolate up from density in subsamples
Subsampling uses
quadrats, transect
Average density=
total observed/area sampled
total population =
Average density * (total area of interest)
Total abundance=
Number of individuals in an area, (i.e., Density, number/area)
Relative abundance =
some metric that scales with the number of individuals (but cannot be converted
to density)
proxies for abundance
• Vocalization frequencies
– # calls per unit time
• Traps
– Pitfall traps, light traps
• Fecal pellet counts
– Rodents, mammals,
caterpillars
• Artifact counts
– Nests, insect pupal cases,
bird tracks
• Fishing catch per unit
effort
Subsampling
As the number of samples goes up….
Our estimate of the total population may go up or down
Our confidence in our estimate of total population increases
Sources of uncertainty:
- Going from samples to population
- More samples => less uncertainty
Subsampling Error depends on
number of samples (more samples = lower error)
Error also depends on the species distribution
Are regular or clumped samples easier to sample well?
regular
Subsampling- For a clumped distribution, errors are often
large
Which species are especially hard to sample?
Rare species with clumped distributions
Habitat suitability models- Presence of clumped species may be predictable based on environment
- If you are sampling fish, their
distribution is clumped
- But predictable based on whether a
location is a pond or not.
- Further factors may be important (pond
depth, permanence, surrounding habitat)
- By modeling habitat suitability, can focus
your sampling only on plausible habitats
Landscape factors that might affect species abundance
– Topography
– Temperature
– Nutrients
– Substrate
– Wind exposure
But be aware that the species may not
be present everywhere it could be (example)
Mountain lion present in yellow and
black, darker grey is suitable habitat,
light grey is unsuitable habitat.
The model alone would mislead you
about population status in the east
Distance sampling main idea
you often need to account for detection probability
account for different probabilities of
detecting individuals that are
close (counted well) vs far (counted poorly)
We can correct for this – guessing how many “far”
organisms we missed.
Factors we adjust for in distance sampling
- Distance we are searching
- How we are searching
- Habitat we are searching
- Weather conditions
- Characteristics of individuals (size, lifestage,
male/female, etc.)
T or F:Different life stages may have different probabilities of being observed
T
Mark–recapture methods are commonly used for
mobile organisms
The essential idea of a mark recapture study is you are using
the history of observations to guess how many organisms you have NOT yet observed
estimated population size
and N=MC/R
m= # individuals captures
c= number of individuals captured on second visit
R= number of individuals captured and marked on the first visit that were also recaptured on the second visit

Assumptions of Mark-recapture methods
the population is closed
no movement into the population
no births/deaths
sampling events should be pretty close time
population is mixed and sampling is random
no tags are lost
tags/traps do not affect recapture, mortality et.
Natural Markers
use of photo ID, sighting rate and mark-recapture methods (dorsal fin ID techniques using natural markings) and genetic sampling to monitor populations of great white sharks and bottlenose dolphins in Mossel Bay, South Africa
Two approaches to figuring out a successful management strategy
1. Do an experiment. Try different approaches, take data, see which is best.
But what if you can’t do an experiment (not ethical, not feasible)? And by the time you find out if the experiment worked it might be too late!
2. Make a model. Use math to predict what will happen.
Populations can change in size as a result of four processes:
Birth, death, immigration, emigration
T or F: In an endangered species we normally ignore immigration and emigration
T
R is
the birth rate per female minus the death rate per female
λ =
1+R
Geometric/exponential growth
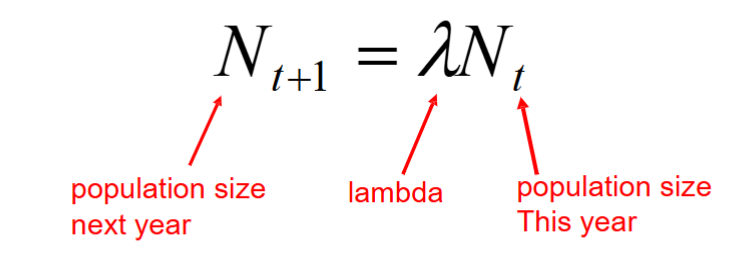
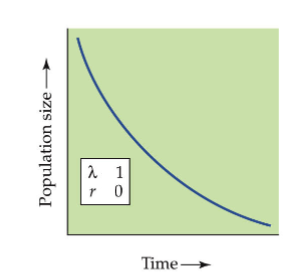
<,<
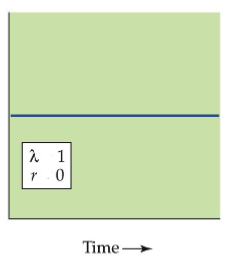
=,=

>,>
Discrete time models
If a population reproduces in synchrony at regular time intervals (discrete time
periods), and growth rate remains the same, geometric growth occurs
Discrete time models equation


If λ = 0.9 and you start in year 0 with 100 individuals, how big is your population in year 10?
(Assuming exponential growth)
N10= 0.9^10 (10)
Measuring λ from data: If you know the size of the population at two times
