IPD Papers Flashcards King Lab (Sebastian mtg Oct 12)
 Call Kai
 Learn
Learn Practice Test
 Spaced Repetition
 Match
Match Flashcards
 Knowt Play
1/52

Earn XP
Description and Tags
the papers sebastian sent on 22 sep: proteinEBM (the oracle being benchmarked against Rosetta) and the CR9114 affinity landscape first, then the 5 bloom lab glycoprotein DMS papers (H5 HA, spike, rabies G, Nipah F, RSV F) lighter. fact checked against the sources. TRAP cards = where the obvious summary is wrong. last 4 cards are figures to explain.
Name | Mastery | Learn | Test | Matching | Spaced | Call with Kai | Chat |
|---|
No analytics yet
Send a link to your students to track their progress
53 Terms
what is proteinEBM in one idea?
an energy based model of protein conformational space. a sequence conditioned diffusion model whose output IS an energy, so one network ranks structures, scores mutations, samples conformations and simulates folding
who wrote proteinEBM and where does it live?
James Roney, Chenxi Ou and Sergey Ovchinnikov. bioRxiv preprint, v3 posted 18 March 2026, not peer reviewed. code and weights at github.com/jproney/ProteinEBM
why sebastian sent it
his words on 22 Sep: "the oracle we are benchmarking against Rosetta"
how is proteinEBM built?
energy parameterized diffusion using the AlphaFold3 and Boltz-1 diffusion modules, downscaled to 85M parameters, trained by denoising score matching on 32k CATH domains, 18k complexes and 32k AlphaFold DB structures
what is proteinEBM-x?
the expert model: the same thing trained only on noise levels below t = 0.15, then run at t = 0.05. ranking peaks at low but nonzero noise, so concentrating capacity there is most of the win
the headline number against Rosetta
on the Rosetta decoy set (133 natives, thousands of decoys each) spearman between model energy and decoy TMscore was 0.838 vs 0.757 for the Rosetta energy function, p = 0.0005
TRAP: does better decoy ranking mean a better answer?
no. the top ranked decoy was TMscore 0.905 vs Rosetta 0.899, p = 0.46, not significant. the ranking correlation improved, the structure you would actually pick did not
the stability headline
average spearman 0.684 on the ProteinGym stability benchmark, a new zero shot state of the art, beating structure aware language models like ESM3 that carry over 15x more parameters
the number that matters for de novo design
on proteins with 0 or 1 MMseqs2 hits it beat ESM3 by 0.178 spearman (0.697 vs 0.519, p < 0.0002), and the gap tracks MSA depth. designed antigens have no evolutionary history, which is exactly where language models are weakest
how does it get a ddG at all?
energy of the folded structure minus a Monte Carlo estimate over the unfolded state, with the unfolded ensemble approximated by Ramachandran random backbone torsions. the authors call it not fully rigorous and it assumes both ensembles barely change on mutation
TRAP: can it predict absolute stability?
no. absolute dG on the Tsuboyama data gives rho 0.471 and MAE 1.06 kcal/mol, worse than ESM-IF (0.672 and 0.96) and barely better than guessing from chain length (0.415 and 1.12). relative ranking is the product, absolute energies are not
what resolution does the energy actually see?
the diffusion process and the energy run on Ca coordinates only. all atom positions come from an auxiliary head that is not part of the energy, and the authors say those predictions suffer mean collapse. side chain packing is not in the score
where it loses to a simpler tool
predicting open vs closed bias for LplA mutants, the proteinEBM energy score correlated with experiment but less well than the plain ProteinMPNN log ratio score
ranking vs sampling, the honest split
on hard targets split by CATH topology, ranking held up but structure prediction fell behind AF2 and AF3. it can score folds it has never seen and still fail to find them
does it actually use the sequence?
yes. ranking degrades a lot when the sequence is masked, and ranking by the norm of the score instead of the energy is far worse, so the energy parameterization is doing the work
the design filter result (most useful for a pipeline)
on 500 BoltzGen designs of length 200 the energy predicted Boltz-2 refolding quality at ROC AUC 0.952 for pTM > 0.7 and 0.889 for RMSD < 2 A. refolding is about 60% of BoltzGen runtime and this is orders of magnitude faster
the structure prediction numbers
on easy targets the lowest energy sample hit TMscore 0.613 vs 0.584 for AF2 and 0.529 for AF3 in single sequence mode, and 0.690 after AF2Rank refinement. the AF baselines were given 10,000 and 15,000 seeds per target
the folding simulation result
from random chains it reproduced the experimental order of contact formation: protein G folds through the C terminal hairpin, protein L and the engineered NuG2 shift to N terminal contacts. 1200, 800 and 4800 trajectories, and the kinetics may be unphysical from coarse graining
what the authors say to do next
supervise the energy differences with large experimental stability data, fine tune by contrastive divergence with sampled decoys as a replay buffer, extend to complexes, and train at all atom resolution
what is the CR9114 paper?
Phillips, Lawrence, Moulana et al. from the Desai lab, eLife 2021;10:e71393. combinatorially complete binding affinity landscapes for two broadly neutralizing influenza stem antibodies
what exactly did they measure?
every combination of the somatic mutations: 2^16 = 65,536 heavy chain variants of CR9114 and 2^11 = 2,048 of CR6261, displayed as scFv on yeast, with a real Kd per variant from Tite-Seq across eleven antigen concentrations
which antigens?
CR9114 against H1 (A/New Caledonia/20/1999), H3 (A/Wisconsin/67/2005) and influenza B (B/Ohio/1/2005). CR6261 against H1 and H9 (A/Hong Kong/1073/1999)
the three numbers to remember
97% of the 65,536 CR9114 variants have measurable affinity for H1, 11% for H3, 0.3% for influenza B. breadth is rare even inside the antibody's own mutational neighborhood
what does nested mean here?
mutations beneficial for H1 are required for H3, and mutations required for H3 are required for influenza B. eight specific mutations are required to bind influenza B at all
the honest baseline
an additive linear model with no interaction terms is the explicit null. epistasis buys only 18 to 33% of explained variance depending on the antibody antigen pair, influenza B excepted. the boring model still carries most of the signal
the path number
only 0.00005% (+/- 0.00004%) of germline to somatic paths improve affinity at every step for CR9114 on H1, vs 0.2% (+/- 0.04%) for CR6261. T29P is the only single mutation that improves H1 affinity, and only modestly
why do any uphill paths exist?
sign epistasis: mutations that are deleterious alone become beneficial in specific backgrounds. F30S lowers H1 affinity from germline but raises affinity for influenza B
the result that argues for a series of immunogens
far more uphill paths exist when selection acts on H1 first, then H3, then influenza B. the order of antigen exposure, not any single antigen, is what makes breadth reachable
why CR6261 is in the paper
as the control. 92% of its variants bind H1 and 81% bind H9, and improvements come early, so the constraint is a property of the CR9114 lineage and not of stem antibodies in general
TRAP: is the library the whole antibody?
no. heavy chain only, and 16 of CR9114's 18 somatic mutations. A24S and E46D were excluded, and reverting them barely changes affinity, but light chain variation is untouched
TRAP: does it measure breadth?
it measures binding to soluble recombinant HA. never neutralization, and never polyreactivity, which is a known liability of stem antibodies. affinities outside the titration window are pinned to the boundary
the counter claim from the reviews
both antibodies came out of phage display with repeated panning, so the somatic mutations may be partly library artifacts. the authors also state they cannot say how these antibodies actually matured in vivo, and the somatic sequence is not the best binder in the landscape
why it is the right dataset for us
65,536 measured Kd values on one antibody is a dense honest test set for any model of mutational effects, and the hierarchy is the quantitative argument that a schedule of immunogens beats one broad immunogen
what the five DMS papers have in common
all Bloom lab, all on the dms-vep pseudovirus platform: nonreplicative pseudoviruses carrying a mutant library of one viral glycoprotein, measuring how nearly every single amino acid mutation affects cell entry and neutralization. interactive maps at dms-vep.org
DMS: H5 HA
Dadonaite et al., PLoS Biology, Nov 2024. clade 2.3.4.4b H5 HA, all possible mutations scored for cell entry, a2-6 sialic acid preference, HA stability and serum escape in mice and ferrets, for surveillance against vaccine strains. Neil King is a co-author
DMS: SARS-CoV-2 spike
Dadonaite et al., Nature, Jul 2024. over 9,000 mutations across the full XBB.1.5 and BA.2 spikes for ACE2 binding, cell entry and serum escape. clade growth rates are explained in substantial part by the measured phenotypes
DMS: rabies G
Aditham et al., Cell Host and Microbe, May 2025. complete escape maps for eight monoclonal antibodies, escape mutations for most antibodies already present in some natural strains, and the constrained regions are the attractive epitopes. Neil King is a co-author
DMS: Nipah F
Larsen et al., PNAS, Feb 2026. F is much more functionally constrained than the receptor binding protein, the paper names candidate prefusion stabilizing mutations, and the measurements predict neutralization of the related Hendra virus
DMS: RSV F
Simonich et al., Nature, Sep 2026. a biophysical model of bivalent IgG buffering plus lower Fab potency explains why nirsevimab resistance is more common in subtype B, then DMS of nearly all F mutations against IgG and Fab forms of nirsevimab and clesrovimab. resistant strains are so far rare
what sebastian asked you to read, in his framing
the CR9114 DMS paper, the proteinEBM paper as the oracle being benchmarked against Rosetta, and a few more DMS papers on viral glycoproteins: H5 HA, RSV F, rabies G, Nipah F and SARS-CoV-2 spike
the one sentence across the batch
the lab has a scorer that ranks well (proteinEBM) and dense measured landscapes to hold it to (CR9114 and the glycoprotein scans), and the only claim worth making is the one that beats a simple baseline on data the model never saw
the named people worth knowing
Sergey Ovchinnikov is senior author on proteinEBM and a co-author of the Megascale stability dataset. CR9114 is Michael Desai's lab. all five DMS papers are Jesse Bloom's, with David Veesler on two and Neil King on two
how this batch connects to the project
mutational effect models for viral glycoprotein antigens: proteinEBM is the candidate scorer, the glycoprotein scans are the labels, CR9114 is the clean affinity benchmark, and Rosetta is the baseline you are supposed to keep honest
energy based model
a model that assigns one scalar energy to a structure plus its sequence, with probability proportional to exp(-E). you can rank, sample and take differences with the same function, which is why one EBM covers decoy ranking, ddG and dynamics
denoising score matching
train the network to undo a known amount of added noise. parameterize the energy and use its gradient as the score, and the trained energy equals minus log probability of the noised data up to a constant
decoy set
native structures plus thousands of plausible wrong structures for each one. ranking decoys is the cheapest test of whether an energy function knows what correct looks like
Tite-Seq
sort and sequence titration. display the variant library, label with antigen at many concentrations, FACS into bins, sequence, then fit a real Kd per variant instead of an enrichment score
combinatorially complete library
every combination of a chosen mutation set, so 2^n variants for n mutations. the only design that lets you measure epistasis at every order instead of inferring it
pseudovirus DMS
put a mutant library of one viral glycoprotein on nonreplicative pseudovirus particles, then read entry and neutralization for the whole pool by sequencing. safe for H5 and Nipah, and the readout is function rather than binding
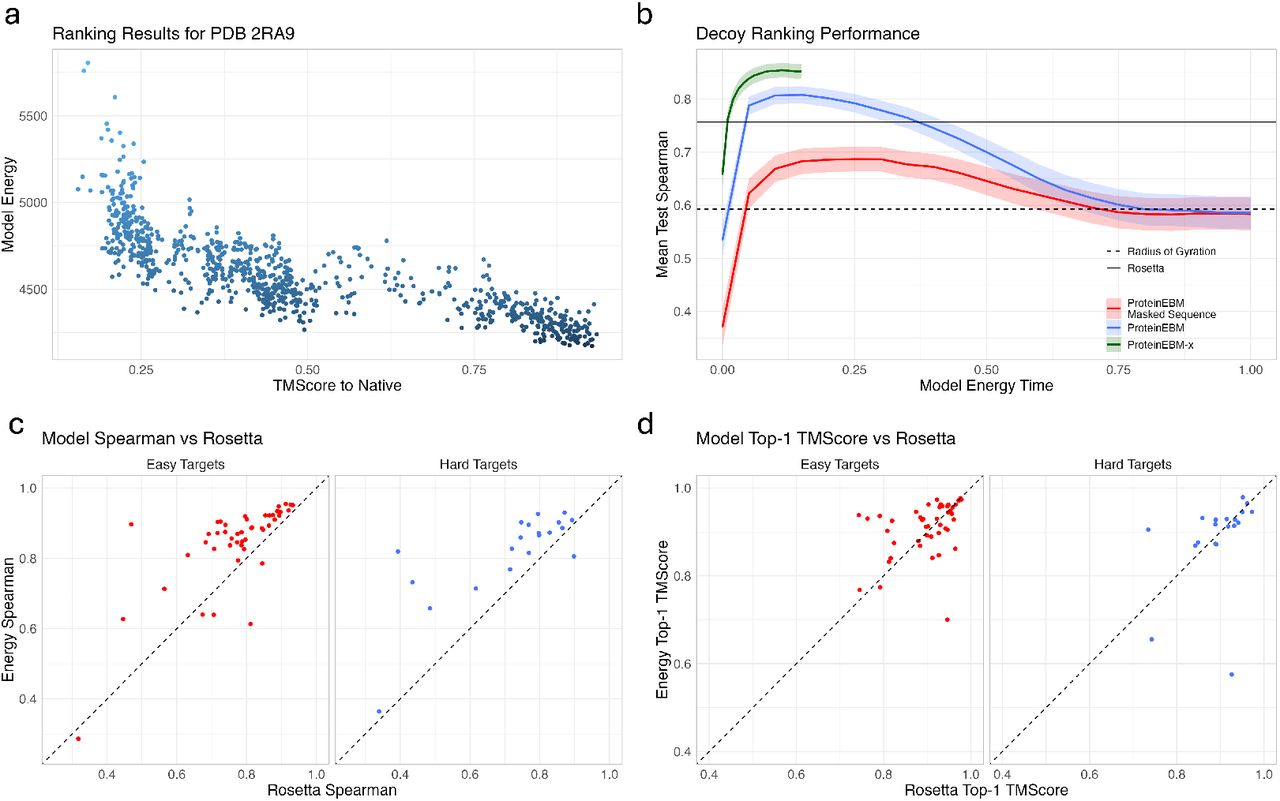
explain this figure: proteinEBM fig 2 (decoy ranking)
a is one target's energy vs TMscore scatter. b sweeps the noise level t and shows ranking peaks just above t = 0. c compares per target spearman with Rosetta, with easy and hard targets separated. d does the same for the top ranked decoy's TMscore, where the two methods tie

explain this figure: proteinEBM fig 3 (stability)
a is the folded minus unfolded scheme for ddG. b is one protein's predicted vs measured ddG. c scatters per protein spearman against ESM3 on ProteinGym and MegaScale. the last panel plots spearman against MSA depth for proteinEBM-x, ESM3 and ESM-IF1, which is where the de novo gap appears

explain this figure: CR9114 fig 1C and 1D (the landscape)
1C is the genotype to phenotype map of all 65,536 variants drawn as a force directed graph, nodes colored by -logKd to each antigen, with H3 and influenza B binders in small overlapping regions inside the H1 cloud. 1D is the affinity distribution behind the 97 / 11 / 0.3% split

explain this figure: CR9114 fig 5 (paths)
5B shows where in maturation affinity can improve for each antibody. 5C and 5D count uphill germline to somatic paths under single antigen and sequential selection scenarios. 5E ranks the scenarios, and the likely ones start with H1, then H3, then influenza B