Conservation Bio Midterm
 Call Kai
 Learn
 Practice Test
 Spaced Repetition
 Match
 Flashcards
 Knowt Play
1/106

There's no tags or description
Looks like no tags are added yet.
107 Terms
Conservation Biology
- the scientific study of the causes of biodiversity loss and the development of biological principles to prevent extinction and maintain evolutionary and ecological processes
o Applying principles of ecology and evolutionary biology to preserve biodiversity
o Includes: Genetics, natural resource fields (forestry, fishery biology, wildlife biology, wildlife biology)
Conservation Science
- treats conservation problems as a social science
o Includes: Public policy, ethics, sustainable development, philanthropy, sociology, psychology, communications, anthropology, agriculture, economics, conservation biology, climate science, public health
Conservation science vs Conservation biology
Conservation science views conservation problems as a social science and conservation biology is the scientific study of causes of biodiversity loss
Muir
Protect wilderness due to intrinsic value / because nature is beautiful!
Conservation ethic
Pinchot
Manage resources sustainably for human use → protect nature because we need it
Leopold
Think ecologically → view humans as part of the ecosystem we are protecting, wrote the land ethic
moral responsibility of humans to the natural world and how we are responsible for and to the land
Carson
Understanding human impacts on the ecosystem like pollution, habitat loss, pesticides
wrote “Silent Spring”
Soule
Build a formal scientific discipline to understand biodiversity loss
Soule’s Postulates
Evolution is ongoing
Ecological systems are dynamic and interconnected
Small populations are especially vulnerable to extinction
Conservation biology should integrate ecology, evolution, genetics, and population biology to understand and percent biodiversity loss
Genetic Diversity
Increase genetic diversity increases population viability
Includes allelic diversity, heterozygosity, standard genetic variation, and adapative capacity
Allelic Diversity
Total range of different inherited traits and DNA variations found within members of the same species
Heterozygosity
presence of two different alleles for a specific gene in an individual, one inherited from each parent, resulting in genetic variation
Standard Genetic Variation
The natural DNA differences in DNA sequences among individuals within a species or population
Genetic diversity management seeks to preserve and enhance the variety of alleles within and among wildlife populations to safeguard their long term viability
Adaptive capacity
Ability of a system, institution, human, or organism to adjust to change, cope with consequences, moderate potential damage, or take advantage of new opportunities
In context of ecosystems, it is the ability to maintain, recover, or adapt performance and function as climate conditions change
Species Diversity
comprised of richness and evenness
Species Richness
how many species are present in an area (doesn’t tell the full story of biodiversity
Species evenness
How evenly are individuals distributed among species?
Is the community dominated by one species
Endemism
Species are restricted to a particular geographic region
Functional diversity
variation in ecological roles
species are linked in complex webs of interactions
losing species can mean losing unique functions or evolutionary lineages
Need to conserve interactions even if we do not fully understand them
Phylogenetic diversity
Amount of evolutionary history represented
species are linked in complex webs of interactions
losing species can mean losing unique functions or evolutionary lineages
Need to conserve interactions even if we do not fully understand them
Ecosystem Diversity
Variation in ecosystem types, structure, and ecological processes
includes habitat structure, species assemblages, energy flow, nutrient cycling
Conserving ecosystems often protects many interacting species simultaneously
What is the Florida Panther a case study for?
Genetic diversity
Florida Panther Case Study
1967: listed as federally endangered, by 1990s <30 Florida panthers remained
Predicted extinction in 20 years
Evidence for severe inbreeding depression: kinked tails, cowlicks, cardiac defects, poor semen quality, high disease prevalence, cryptorchidism in all males (one undescended testis)
Conduct genetic rescue to increase genetic variability by introducing panthers from other populations
Questions to ask: 1) will it lead to outbreeding depression? 2) if we do it, which population should be the source
All north American panthers are genetically similar
DNA from museum samples showed Florida panthers as being more genetically diverse but not differentiated from Texas panthers
1995: 8 Texas females introduced
Offspring of released females lacked deformities
Hybrid offspring had a higher survival and expanded into new areas thought to be unsustainable
What are Hawaiian Honeycreepers a case study for?
Species diversity
Hawaiian Honeycreepers Case Study
European rosefinch got introduced to Hawaii and diversified across Hawaii
56 species only found in Hawaii
Developed different diet specializations
Threatened by habitat loss, invasive predators (islands often are not home to many predators), avian malaria (from mosquitos)
As climate got warmer, mosquitoes could travel higher and infect more high-altitude birds
Only 15 species of these birds now
What are Figs and Fig Wasps a case study for?
Functional and phylogenetic diversity
Figs and Fig Wasps
During dry periods in seasonal rainforests, a very small number of plant species (figs) sustain the entire frugivore community for 3 months each year!
Most fig species have only one specialist wasp pollinator
Fig is only place the wasp can reproduce
Most figs only have 1 specialist wasp pollinator
If fig wasps went extinct, figs would not be able to cross-pollinate
Loss of 5-10 different fig species in tropical dry forests could lead to eventual extinction of many / all fruit eating birds and mammals
Tropic cascade extinction
What are kelp forests a case study for?
Ecosystem diversity and trophic cascade
Kelp Forest Case Study
Kelp provides habitat and food for species
Kelp are an ecosystem engineer
Sea urchins overgraze kelp in absence of otters
Without otters, the kelp forest ecosystem collapses
They are a keystone species
What is the difference between natural and human caused extinction
Natural
Extinction has occurred throughout history of life
Extinction and speciation shape biodiversity
Most extinctions occur gradually (a few during mass extinction events)
Rate and causes are what matter most for conservation biology
Human-caused
Current rates greatly exceed background
Human activity is main cause
More specific focus of conservation biology is preventing extinctions that are accelerated and anthropogenic
What are the drivers of biodiversity loss
Habitat loss/fragmentation
Loss = reduction of habitat
Fragmentation = habitat divided into smaller and smaller chunks
Main threat to 85% of species of IUCN Red List
Fragmentation adds edge effects and isolation on top of lost area
Smaller, isolated populations face greater extinction risk
Overexploitation
Harvesting individuals faster than reproduction can replace them
Especially dangerous for slow moving species
Includes: hunting, gathering, fishing, logging, and wildlife trade
Invasive species
Species introduced outside of their native range that cause ecological or economic harm
Harm caused through altered ecological interactions predation, competitive exclusion, disease transmission, hybridization with native relatives
Hybridization results in less genetic uniqueness
Island ecosystems very vulnerable
Pollution
Chemical contaminants, excess nutrients, plastic debris, light and noise pollution
Acts directly through toxicity or accumulates up the food chain through bioaccumulation
Effects often indirect and delayed
Climate change
Warming temps and shifting precipitation alter where suitable habitat is
Species shift ranges poleward and upslope, tracking suitable conditions
Timing shifts too, sometimes out of sync with dependent species
Outbreeding Depression
crosses between two genetically distant groups or populations result in reduction of fitness
Staghorn and Elkhorn Coral
Dominant reef-building species
Disease was introduced → white band coral introduced
Functional extinction → population too low for them to maintain reef structure in Florida so they can’t serve their role anymore
Ecosystem suffers as a consequence
Richness vs Eveness
Richness is the number of species present, simplest biodiversity measure, easy to calculate, ignores relative abundance
Eveness is how evenly individuals are distributed among species
Shannon vs Simpsons Indices
Both consider abundance in addition to the # of species present
Shannon → more weight on rare species (increase as both richness and evenness increase
Simpson → more weight on dominant species
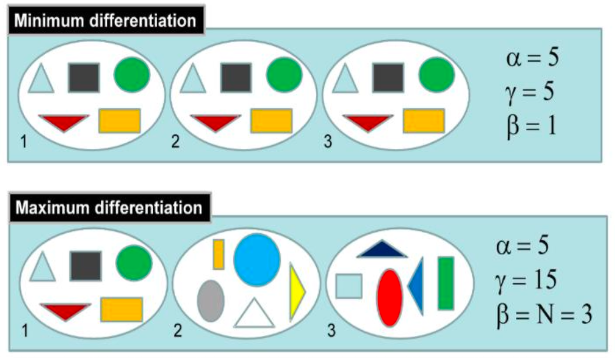
Alpha, beta, gamma diversity
Alpha = species richness within a site
Beta = difference among sites (gamma / alpha)
Gamma = total diversity across region
Endemism
Not all species are equally distributed
restricted ranges = elevated extinction risk
Functional Diversity
- Diversity of ecological roles and traits
- Communities with identical richness may function very differently
- Ecosystem processes depend on interactions among species
- Loss of key functional groups can disproportionately affect ecosystem stability
Phylogenetic diversity & EDGE
Diversity of evolutionary history represented
Evolutionarily Distinct and Globally Endangered
Prioritize species that represent a unique branch of the tree of life and face high rates of extinction
Latitudinal diversity gradient
Richness generally increases from poles to equator
One of the oldest and most consistent patterns in ecology
Observed across many taxonomic groups – plants, birds, amphibians, reef fishes, insects, etc.
Tropical regions contain both high richness and many endemics
Conservation efforts are disproportionately concentrated in tropical ecosystems
Biodiversity hotspots
High richness, high endemism, high threat
Designed to help prioritize conservation investments
IUCN Red List and its categories
Classification of how at risk a species is
o Extinct
o Extinct in wild
o Critically endangered (threatened)
o Endangered (threatened)
o Vulnerable (threatened)
o Near threatened
o Least concern
o Data deficient (need more data to decide their category)
o Not evaluated (have not done any evaluation)
Species-area relationships
Geography shapes extinction risk
species rand size varies widely
Small ranges = high vulnerability
Endemics are especially at risk
Threats act spatially
What traits make a species more vulnerable to extinction?
Small geographic range
Example: Devil’s Hole pupfish
Low fecundity (biological capacity to produce offspring)
Example: Albatross
Ecological specialist
Example: fig wasp
High trophic level
Example: orca
Large body size
Example: elephant
Poor dispersal
Dispersal: movement of individual organisms away from birth site or current habitat to new location
Example: island snail
What are Amphibians Declines a case study of?
Compounding factors causing extinction risk
Amphibian Declines case study
Amphibians are the most threatened vertebrate group
Multiple interacting threats → chytrid fungus, climate change, habitat loss and fragmentation
Climate change and disease are interacting together
Many amphibians have several vulnerability traits small ranges, specialized habitats, limited dispersal
BIDE
Birth
Immigration
Deaths
Emigration
Conservation action ultimately acts by changing one or more of these demographic processes
(delta)N = B+I-D-E
Population growth terms λ and r
λ → rate of increase
population growth over some finite time
r → growth rate
population growth rate at any particular moment in time
Exponential vs Logistical growth
Exponential Growth
Unconstrained growth, constant per-capita growth rate (r), J-shaped curve, useful baseline but never persists in nature
Example: bacteria culture
Logistic growth
S-shaped curve, includes carrying capacity
Carrying capacity → not all populations can exponentially grow forever since they are bound to be limited by resources (competition, food limitation, space limitation)
Examples: deer
Carrying Capacity
not all populations can exponentially grow forever since they are bound to be limited by resources (competition, food limitation, space limitation)
Density Dependence
Conceptual curve of per capita growth vs population size
negative density dependence at high population sizes (deaths outweigh the births)
population growth rates are regulated by the population density
Referring to any characteristic that varies with population density like resource limitations and shelter availability
Allee Effects
At very low population sizes → finding mates becomes difficult, cooperative behaviors break down, pollination declines, population growth can become negative
If population is too low, finding mates takes so much time and energy that reproduction becomes rarer and rarer and the population declines
Small populations may continue to decline even after threats are removed
Demographic vs Environmental Stochasticity
Stochasticity: quality of being unpredictable, random, or governed by probability rather than a fixed deterministic plan like populations
Demographic: random variation among individuals
Due to survival, reproduction, sex ratio, & recruitment
More important in small populations
Environmental: environmental variation affects entire populations
Examples: drought, hurricanes, wildfire, El Nino, coral bleaching
Greatest consequences for small populations
All populations that experience stochasticity will eventually go extinct
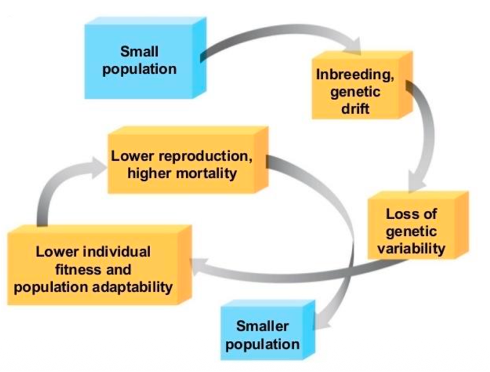
Extinction Vortex
When habitat is lost and fragmented, populations get smaller and more isolated
Small populations lose genetic variation; reduces fitness and increases extinction risk
MVP
Minimum Viable Population
Smallest population expected to persist with an acceptably low risk of extinction over a specified time period
No universal MVP threshold → depends on life history and environment (management objectives matter)
Predictive models for conservation
Questions to ask: will population persist? What factors most influence its future? Which management actions are most likely to succeed?
Models help us compare alternative futures before acting
PVA
Population Viability Analysis
Quantitive framework for estimating the probability that a population will persist or go extinct under specified conditions
How much of an impact a factor has on a population
Commonly used for:
Estimating extinction risk
Comparing alternative management strategies
Identifying demographic processes limiting recovery
Inform species recovered plans and/or conservation action
PVA input and outputs
Input field data (population size, age structure, birth rates, death rates, immigration, emigration, environmental variation) and population model (population growth, density dependence, demographic and environmental stochasticity, Allee effects, management scenarios)
Model output is 1000 simulated futures that say probability of extinction and expected population size (confidence intervals and management comparison)
PVA limitations
Dependence on data availability and quality, model assumptions, unknown future conditions
Sensitivity Analysis
measures the effect of a variable on model outcomes or effect of a demographic rate on population success
Adaptive Management
Monitor populations, update models, then refine management actions
Update management strategies as you obtain new information
California Condor
Life history makes population vulnerable (very low reproductive rate, small population growth rates)
Listed endangered with 27 left due to lead poisoning, shooting, egg collecting, habitat loss, power line collisions
PVA showed population growth was most sensitive to adult survival and less sensitive to nest success, chick survival, and fecundity
Solutions: captive breeding, lead ammunition reduction efforts, veterinary care, and releases
Actions reduced adult mortality (deaths) and increased recruitment through reintroductions (immigration)
Population has grown but still requires intensive management
What is DNA organized into
Chromosomes
What are the 2 genomes a cell contains
nDNA and mtDNA
Alleles
Alternative versions of the same gene
Genotype
Combination of alleles an individual carries
nDNA vs mtDNA
nDNA → biparentally inherited and recombines
conservation applications: genetic diversity, inbreeding, gene flow, adaptation
mtDNA → maternally inherited and does not recombine
Conservation applications: phylogeography, species ID, eDNA
Ways to measure genetic diversity?
Heterozygosity → frequency of individuals with 2 different alleles
Allelic richness → number of different alleles in a population
Nucleotide diversity → average DNA sequence differences among individuals
Bottleneck vs founder effects
Population bottleneck → severe, temporary reduction in population size; rare alleles often lost by chance
Found effect → new population established by a few individuals from a larger population; only a subset of genetic diversity is carried forward
Both reduce genetic diversity
Genetic drift
Random changes in allele frequencies
Can eliminate alleles regardless of fitness
Buri Experiment
Showed genetic drift
Let flies with white (homo), orange (hetero), and brown (homo) eyes mate freely and kept 8 males and 8 female of each generation
Over the course of 20 generations, heterozygosity went down and the homozygosity went up
Loses genetic diversity
Often due to some individuals having more offspring than others, individuals not breeding, males having multiple mates compared to other males
Drift vs selection
Drift → unpredictable trajectory (might be good or bad)
impacts all populations but small populations fastest
random but had predictable consequences → loss of diversity and fixation of alleles
Both → change allele frequencies and often reduce genetic variation
Selection → advantageous alleles increase predictability
Selection is who is better adapted
Effective population size (Ne)
Census size is the actual total count of individuals living in a population
Ne is almost always smaller than census size because not all individuals reproduce equally or not at all
While census size drives ecological interactions (like food competition), Ne drivers evolutionary and genetic processes (like inbreeding)
Ne is reduced by unequal sex ratios, variation in reproductive success, and fluctuating population size
Inbreeding & inbreeding depression
Mating between relatives which increases homozygosity and reduces heterozygosity
Increasing homozygosity can cause
Expression of harmful recessive alleles
Reduced genetic diversity
lower adaptive potential
Reduced individual fitness
Inbreeding depression → reduced fitness resulting from inbreeding
Causes: lower survival, reduced fertility, developmental abnormalities, greater susceptibility to disease
Genetic Load
The reduction in the mean fitness of a given population relative to a population composed entirely of individuals with optimal genotypes devoid of deleterious alleles
Small populations accumulate deleterious alleles and reduced adaptive variation
Genetic rescue and its risks
Increasing gene flow into an inbred population to improve fitness
benefits → increase genetic diversity, reduce inbreeding, restore adaptive potential
Risks → outbreeding depression, introduction of maladaptive alleles, idease transmission, and loss of local adaptation
Outbreeding depression: mating with too far divergent individuals is still bad; mate pair is too different, so offspring is not fit for environment; increase of the wrong genetics
What is Isle Royale Wolves a case study of?
Genetic rescue
Isle Royale Wolves case study
Background: isolated island population, apex predator of the moose
Population peaked at 50 wolves but declined to only 2 in 2017
Low reproduction and skeletal abnormalities
Genomics revealed severe inbreeding with extensive runs of homozygosity, extremely low genetic variation, and high inbreeding
19 wolves translocated in 2019 which introduced new diversity and increased the population
Habitat loss vs fragmentation
Loss: reduction in total amount of habitat
Fragmentation: change in configuration of habitat
Patch size
how large/small the habitat fragment is
small patches support small populations, higher stochasticity but less habitat heterogeneity means fewer niches and fewer species
Smaller patches vulnerable to extirpation → single event could wipe out entire population
edge effects
Abiotic: more light, more wind, wider temperature swings, drier
Biotic: increased invasion, higher predation and parasitism, altered plant community composition
Isolation
functional distance between patches, not just geographic distance
more isolated = fewer immigrants = local extinction less likely to be recolonized
Landscape connectivity is species specific
Matrix
Surrounding land cover or background environment that lies between discrete habitat patches
Metapopulations
set of local populations occupying discrete habitat patches and connected by occasional dispersal
Types of Metapopulations
Classic (Levins) — patches of similiar size and quantity; frequent local extinction and recolonized; no single patch essential
Mainland-island — one large extinction resistant “mainland” patch supplies dispersers to smaller “island” patches
Patchy — patches are well connected so they function as one large population; local extinctions rare
Non-equilibrium (declining) — colonization can’t keep up with extinction

Levins Model
c = colonization rate coefficient
e = local extinction rate coefficient
Metapopulations persists when c > e
Patch size drives extinction rate (e)
Isolation and matrix quality drive colonization rate (c)
Fragmentation pushes e up and c down collapse tends to be sudden
Rescue effect
Immigration can prevent local extinction / allow rapid recovery
Patches closer to occupied neighbors or better connected by permeable matrix have lower local extinction rates
Source vs Sink
Not all occupied patches are equally valuable
Source → net exporter of inviduals
Sink → net importer; would go extinct without immigration
Sinks can appear stable and visibly occupied → conservation ‘trap’ if managers mistake occupancy for habitat quality
Extinction Debt
When a habitat is destroyed, populations don’t immediately disappear but decline slowly toward extinction (inevitable)
populations are the “living dead” → present but doomed to local extinction because c < e and the time lag can be decades long
Restoring connectivity can begin to repay debt before extinction occurs
What is the Glanville Fritillary a case study of?
Habitat fragmentation and patch connectedness
Glanville Fritillary case study
A butterfly found on islands in Sweden
~4200 discrete patches across 50x70km study area
Only 20% of patches are occupied each year but metapopulation has persisted for decades (high turnover)
Core Levin’s prediction → persistence is a property of the metapopulation, not an individual patch
What predicts local extinction (e)
Patch area
Patch isolation
Habitat quality (host plant abundance, microclimate)
What predicts colonization (c)
# and proximity of currently occupied patches
Females colonize in strong distance-decay probability
Well-connected patches are Patchy metapopulation; outlying patches are classic
Reserve design
Protect multiple patches
prioritize patches with lowest predicted extinction rates and highest colonization rates
don’t dismiss currently empty patches
identify and prioritize any “mainland” source patches
maintain matrix permeability between protected patches
SLOSS
Single Large Or Several Small
Single large → lower edge:area ratio, more interior core habitat, supports species that need larger territories or interior specialists
Several small → spread risk, can capture broader habitat variation
Metapopulation theory shows that SS will only outperform SL if connectivity is good (c-e balance)
Corridors
Corridors raise colonization (c)
Can also facilitate the spread of disease, invasives, fire, etc
High species specific
Connected patches retain more native plant species than equally sized unconnected patches
Steppingstone patches
Caughley’s Two paradigms
Declining population Paradigm: what is causing this population to decline and how to stop it
Small population paradigm: given that a population is already small, what risk does smallness itself create (inbreeding, genetic drift, etc.)
Caughley warned against only focusing on this
Both matter → small population size is not just a symptom of a species being in trouble but also a cause of further trouble via mechanisms independent from decline
Declining population paradigm
what is causing this population to decline and how to stop it
Small population paradigm
given that a population is already small, what risk does smallness itself create (inbreeding, genetic drift, etc.)
Forces that affect small populations
Allee effects, drift and inbreeding depression, environmental stochasticity, and demographic stochasticity
Mechanisms of the Allee affect
mate limitation
loss of cooperative behavior
Reduced predator swamping
Genetic Allee affects (inbreeding)
MVP and the 50/500 rule
Minimum viable population → probalistic, time-bound, foreseeable threats
Ne of 50 — minimum for short-term persistence → based mostly on limiting inbreeding depression
Ne of 500 — minimum for long-term persistence → based mostly on maintaining enough variation for evolution