Public Economics
 Call Kai
 Learn
Learn Practice Test
 Spaced Repetition
 Match
Match Flashcards
 Knowt Play
1/183

There's no tags or description
Looks like no tags are added yet.
Name | Mastery | Learn | Test | Matching | Spaced | Call with Kai | Chat |
|---|
No analytics yet
Send a link to your students to track their progress
184 Terms
LECTURE 1 - Introduction
Public economics
Study of government’s intervention in the economy. (HOW does it intervene)
Why is public economics relevant
Affects all individuals (Ex: Taxes)
Improves life of all citizens (Ex: Pensions)
Asks if there is a “good” government (Depends on the pov)
2 questions of this class
How do governments affect the economy? Which decisions are taken? - POSITIVE APPROACH (objective)
What policy decisions should the government make and how should policies be designed? - NORMATIVE APPROACH (ALWAYS with a specific goal, that’s why it is normative) (Subjective)
Positive analysis
Why is there a public sector? Where government objectives emerge? How are policies chosen? What are the observed observed effects?
Assumption: There is a limited set of available policies (information, compliance, administrative costs are constraints)
Ex: Taxe revenues decrease by 10% → List the impact of this reduction in government resources.N
Normative analysis
What are the best policies? Optimal policy is the one that meets gov goals.
Assumption:
Government has a specified set of objectives (including the policy of laissez-faire)
Aggregate social welfare can be measured and welfare levels of differnt individuals can be compared.
Ex: Goal is to have optimal taxation to ensure everyone is better off, or not too much worse off -> Policy is decided to reach this goal.
Government interventions
Public revenues
Public expenditures
Prices: Taxes, welfare, social insurance, public goods
Regulations: Labour market, product market, environment
Employer
Global trend of the wieght of the public sector
19th C: Minimal state, public spendig is around 10% of GDP, no social spending
20th C: Growth, especially between 1960-1980
High level today: About 45% of the GDP but hetegeneitya cross OECD countries.
Social expenditure
Health
Education
Pensions
Social spending in public spending
Social insurance explains an important part of public spending and the differences across countries.
Ex: Bismarck’s social insurance in Germany, Beveidge National insurance in UK…
Different models of welfare state
Continental
Nordic
South
Anglo-saxon
What will cause increase in social spendings in the future
Increase in the elderly population around the world → Increase in retired persons → Increase in the number of pensions → Increase in social spendings.
Types of taxations
Direct taxes
Indirect taxes
Contributions
(Direct and indirect taxes got o general revenues of the state, WHEREAS contributions go to fund a specific program).
Types of taxation: direct taxes
Labor income
Capital income
Corporate
Wealth (property, estate, inheritence)
Types of taxation: indirect taxes
Consumption (VAT, sales tax, excise tax)
Production
Trade (import tariffs)
Types of taxes: Contributions
Directed to the funding of a specific welfare program, such as soc ial sescurity, health care or unemplotyment benefits.
Regressive taxation
A system where the tax rate or burden takes a larger percentage of income from low-income earners than from high-income earners.
Ex: VAT takes a higher proportion of income of low income than large incomes.
Solution → Different VAT rates depending on the good.
Justifications for the public sector
Minimal state: An economy requires at least
Property rights
Contract laws (to enforce rules)
Market failures
Government must intervene to correct them
Redistribution
Government redistribute resources to reduce inequality.
Growth of the public sector
Development models: As you develop, there is a larger government
Wagner’s law: Public expenditure increases with economic growth (as a proportion of income) as public goods have a high elasticity (education, healthcare)
Baumol’s law: Tech of the public sector is labor intensive and cannot subsittute capital for labor (contrairement au private sector) → Thus public sector expenditure have to increase to maintain a constant level of public sector output for the increased productivity in the private sector.
Political economy: Democratization increases the power of the poor → Making the median voter poorer → Voters requiring redistribution and public goods.
Ratchet effect: If expenditure increase, the level of expenditure does not fall back: debts, people get used, electoral promises.
Leviathan theory - Excessive govenrment
The government is controlled by self-interest bureaucrats who max their private utility (not idealism). They try to increase the size of the bureau, → public sector increases.
LECTURE 2 - Welfare economics and public choice
Two fundamental criterion of a policy
Efficiency
Equity
Ex: Increasing revenues might lead to a reduction in equity because the distribution might not be changed as well.
Efficiency
How well resources are allocated, the total amount.
Graph: Efficiency is reached when we are ON the curve.

Equity
how resources are distributed among individuals.
Graph: Improve distirbution by moving ALONG the curve.

2 roles of the government
Efficiency: efficient private market allocation (competitive equilibrium)
Equity: Improve distribution
invisible hand of adam Smith
Individually motivated decisions produce a socially efficient outcome through the prices → coordination of demand and supply leads to an efficient equilibrium.
Positive POV: Market works well + allocation of resources is efficient.
Negative POV: There are failures, which is why we need the government to intervene to correct these failures.
Competitive economies/competitive equilibrium model
Assumptions (without them, the market fails, so they are MANDATORY):
Prices are given for consumers’ and firms’ choices
prices adjust to adequate demand and supply
All agents have access to the same information (symmetric)
2 forms of this model
Exchange economies WITHOUT production
Exchange economies WITH production
Exchange economy ( without production) model
2 consumers (h = 1, 2), 2 goods (i = 1, 2). No production — people only trade what they already own.
Key assumptions:
Prices p₁ and p₂ are set by the market
Each consumer is a price-taker (cannot influence prices)
Initial endowment of consumer h: w^h = (wh1, wh2)
Each consumer maximizes utility U^h(xh1, xh2) subject to their budget constraint
Each consumer chooses a consumption plan xh = (xh1, xh2) where the budget constraint is satisfied → LAST FORMULA IS THE BUDGET CONSTRAINT for individual h. It predicts exchanges on the market because it matches the prices and the utility of each goods of every individual.

Edgeworth box
A box that contains ALL goods in the economy and shows ALL feasible allocations.
A feasible allocation satisfies: x1i + x2i = w1i + w2i (total consumption = total endowment, for each good)
To remember:
The total amount of goods is fixed, extra cannot be produced
Budget constraints
Individuals want to maximize their utility (Utility function is important and it is represented by the indifference curves)
Reading the graph:
Individual 1 reads from bottom-left
Individual 2 reads from top-right
Point w = initial endowment point (starting position of the economy)
Total supply of each good is fixed (no production)
AS A RESULT, the point w on the graph is the stage at which the economy is INITIALLY. But it can be changed to be x, y, z if the allocation changes through exchanges.

Budget constraint
spending (What you want to consume multiplied by the price…) = income (what you have multiplied by the price) (valued at market prices)
p₁·xh1 + p₂·xh2 = p₁·wh1 + p₂·wh2
It is an individual equation for both, but the visual representation is common since the total amount of goods is shared, the same for the prices.
Slope = −p₁/p₂ (same for both consumers, same prices)
Must pass through w (both can always afford their endowment)
Since both conditions are identical → one single line in the box, shared by both
How to read it in the box
Individual 1 reads from bottom-left → everything below-left of the BC is affordable for him
Individual 2 reads from top-right → everything above-right of the BC is affordable for him
Indifference curves
A curve showing all combinations of good 1 and good 2 giving the same utility to one individual.
Red curves = Individual 1 | Green curves = Individual 2
Moving higher/right = higher utility for Individual 1
Curves never shift, they reflect preferences, not prices
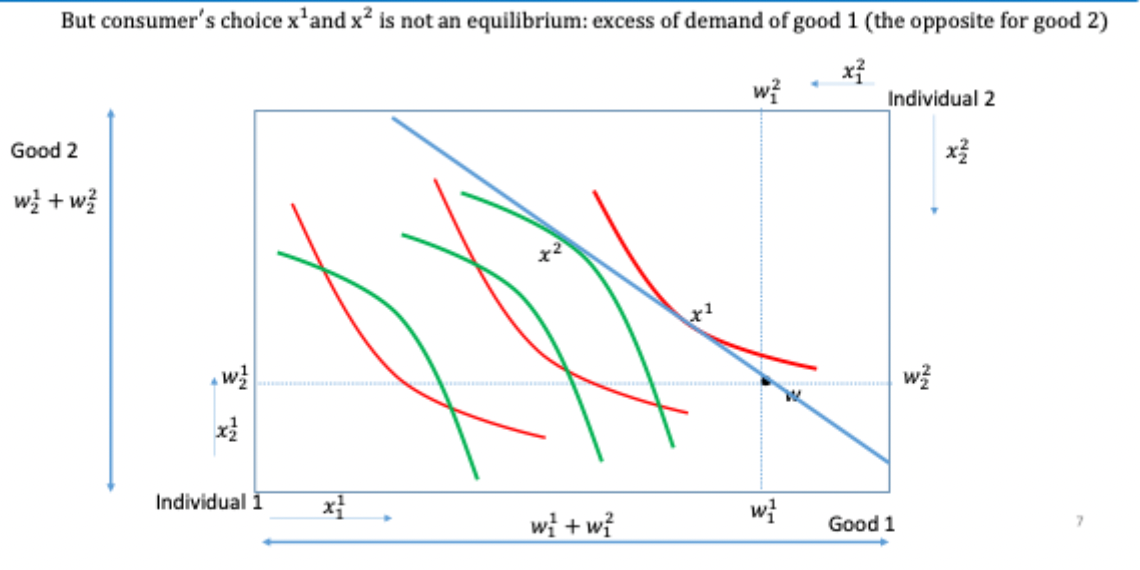
Optimal choice = highest indifference curve tangent to the BC (Makes the price and the preference match) → BUT IT IS NOT THE EQUILIBRIUM BECAUSE THERE MIGHT BE EXCESS DEMAND OR SUPPLY FOR GOODS.
Tangency condition: MRS₁,₂ = p₁/p₂
Marginal Rate of Substitution (MRS)
MRS₁,₂ = how many units of good 2 you're willing to give up for one more unit of good 1, staying equally happy.
= the slope of the indifference curve at a given point
Why MRS = p₁/p₂ at optimum?
Meaning | |
|---|---|
MRS | Your personal trade rate |
p₁/p₂ | The market's trade rate |
If they differ → you can do better by trading. Optimum is where they match.
Disequilibrium
Each consumer finds their own optimal point (tangent to BC) → but they land on different points.
This means: excess demand for good 1, excess supply for good 2 → markets don't clear → not an equilibrium because the market clearing condition might not be satisfied.
Market clearing condition
total demand = total endowment, for each good (the formula just below is for one good, it must be true for both so there is as such formulas to calculate as the number of oods.)
x¹(p₁,p₂) + x²(p₁,p₂) = w¹ + w²
x¹(p₁,p₂) = what individual 1 wants to consume at those prices
x²(p₁,p₂) = what individual 2 wants to consume at those prices
w¹ + w² = total amount of each good that exists in the economy
→ Nobody can consume more than what exists. If this equation holds for both goods, markets clear and we have equilibrium.
Price Adjustment → Equilibrium
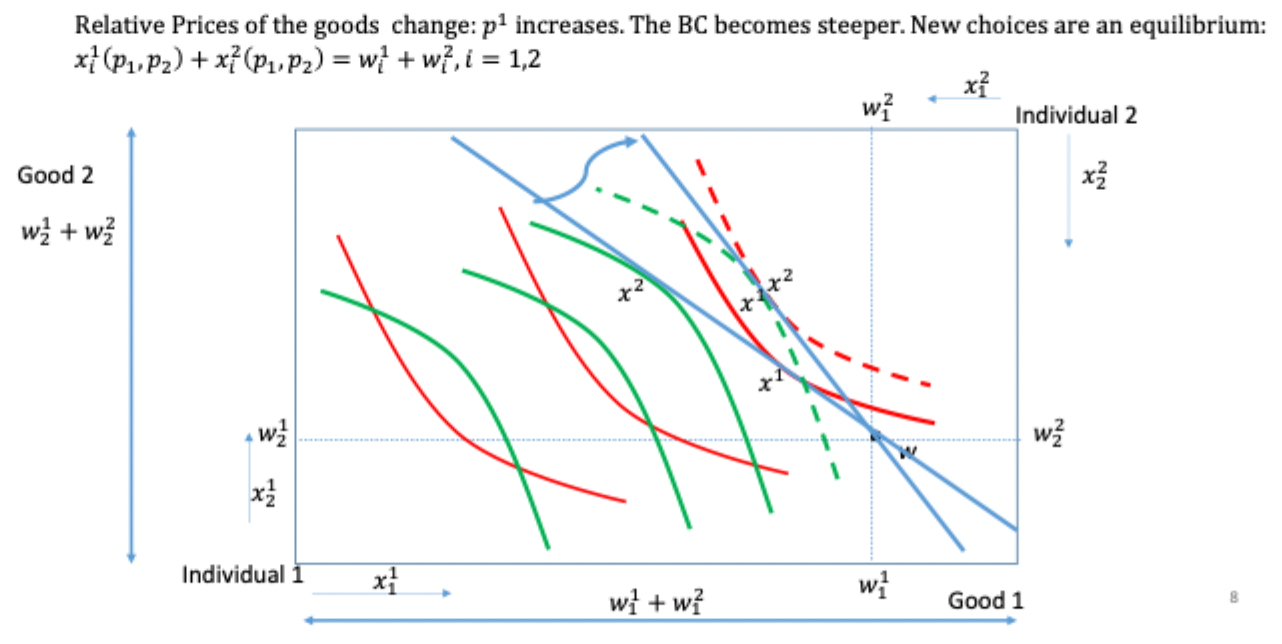
Because of excess demand for good 1: p₁ ↑, p₂ ↓ → BC becomes steeper (BUT IT COULD BE THE OTHER WAY AROUND, it depends on which good is in excess demand).
. A new tangency point emerges.
Equilibrium is reached when:
Both indifference curves are tangent to the BC at the same point
Markets clear: total demand = total endowment for both goods
→ NOW, the two indifference curves are tangent on the same point along the budget curve -> EQUILIBRIUM
First-best outcome
Achieved when when BOTH:
production technology
Limited endowments (=resources)
are the ONLY things restricting the choice of the decision-market.
Second-best outcome
Achieved whenever constraints OTHER than technology and resources are placed on what the planner can do (limits on income redistribution, inability to remove monopoly power, lack of information).
Equilibrium is efficient when
More cannot be achieved.
Ex: If there is a singe consumer, their preferences are the social preferences.
Pareto efficiency/optimality
A feasible consumption allocation x^ (x = y + w) is Pareto efficient if there is no alternative feasible allocation a- that satisfies BOTH:
Allocation a- gives all consumers at least as much utility as x^
Allocation a- gives one consumer more utility than x^
TRANSLATION: you cannot make someone better off without making someone else worse off.
Is Pareto-efficiency/optimality always relevant?
No because if someone has everything, and the rest has nothing, it is a pareto optimum, even though redistribution could make a lot of people better off. Because the one who has everything would be worse off…
→ so not always relevant.
First welfare theorem
A competitive equilibrium (i.e. the allocation achieved by the market) is Pareto efficient if it satisfies some conditions:
No externalities or public goods
Perfect information
Perfect competition
→ Else, the first welfare theorem fails → justifies the governemnt intervention.
Why is the first welfare theorem relevant
The assumptions made for it to hold are crazy → So it fails almost automatically without them (in real life) → So need for government intervention.
Externalities
Actions of one party makes another party worse OR better off, and the first party either bears the costs nor receives benefits from doing so.
Negative externalities: Pollution
Positive externalities: Oil exploration
What can the government do to include externalities
Taxes
Subsidies
Imperfect/asymetric informaiton
Not all parties have the same information/level of information.
Ex: Adverse selection on the insurance mrket → high risk individuals go for insurance bc they hope to make it worth it. Imperfect info bc the insurance company doesn’t know the risk of everyone. → MARKET FAILS → Solution: Mandatory insurance so the pool of insurance is larger to divide the risk.
Second welfare theorem
Any pareto-efficient allocation can be achieved as a competitive equilibrium, under the same conditions of the first welfare theorem, + the lump-sum tax/transfers (redistribution of initial resources)
Ex: Economy starts at w, we want to reach e’ since it is the pareto-efficiency point. → Need to redistribute endowment because the market only acts along the budget constraint line, else no exchange… → Then from w’ to “‘, exchanges make you reach this point bc it is the pareto efficient point and equlibilurm.equilibrium
→ FAILURE of the 2nd welfare theorem since lump-sum taxes are not in the real world.

Lump sum tax/transfer
Change in the allocation BUT it doesn’t affect the behavior, it is just a change in basic endowment.
Contract curve
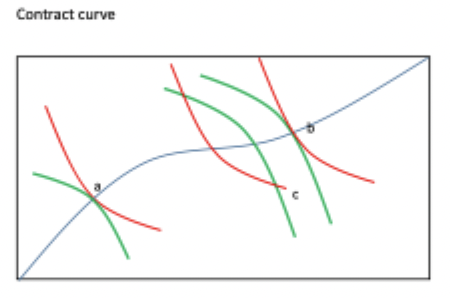
Set of all pareto efficient allocations in exchange economy.
Utility possibility frontier
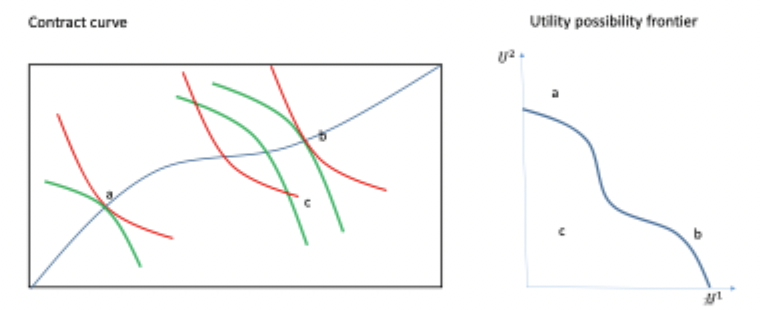
A graph in economics that shows the maximum possible combinations of satisfaction (utility) that two or more people can achieve from a given set of resources and technology

Relationship between the edgeworth box and utility possibility fruntier
The utility possibility frontier is the contract curve but with utilities on the axes.
GRAPH: The two graphs are related. Individual 1 has a low level of utility at point a on the contract curve. (remember red for the individual 1). But it represents high level of utility for individual 2.
B, high level of utility for individual 1, and low level of utility for individual 2.
Social optimality
allocation of resources that maximizes total net benefit or economic welfare for society as a whole.
→ IT IS THE ROLE OF THE GOVERNMENT

How to choose the social optimality point?
WHICH POINT TO CHOSE ALONG THE UTILITY POSSIBILITY FRUNTIER?:
c is inefficient
a and b are efficient but they don’t lead to the same utility for everyone… → which one should be chose?
→ REQUIRES TO MAKE AN ASSUMPTION ABOUT GOVERNMENT’S GOAL

Welfare function
Formula that combine the individual utility levels (well-being or satisfaction) of everyone in a society into a single overall measure of collective welfare.
Used by the government to choose the policies.
government wants to maximize this function
BUT what to consider to calculate this function? Different ways to aggregate individual preferences
Social indifference curve
A combination of the 2 consumers’ utilities that gives a constant level of social welfare. Along a social indifference curve, the government is indifferent.
3 types of social indifference curve
The social indifference curve depends on how you calcualte the welfare:
Utilitarian welfare function: W = U1 + U2 - The sum of both utilities.
Intermediate: rounded curve
Rawlsian welfare function: W = min(U1, U2) - The lowest utility is the social utility, meaning that to maximize it, you need to focus on the lowest utilities. (Socialooossss)
→ Choosing the social welfare formula is philosophical..
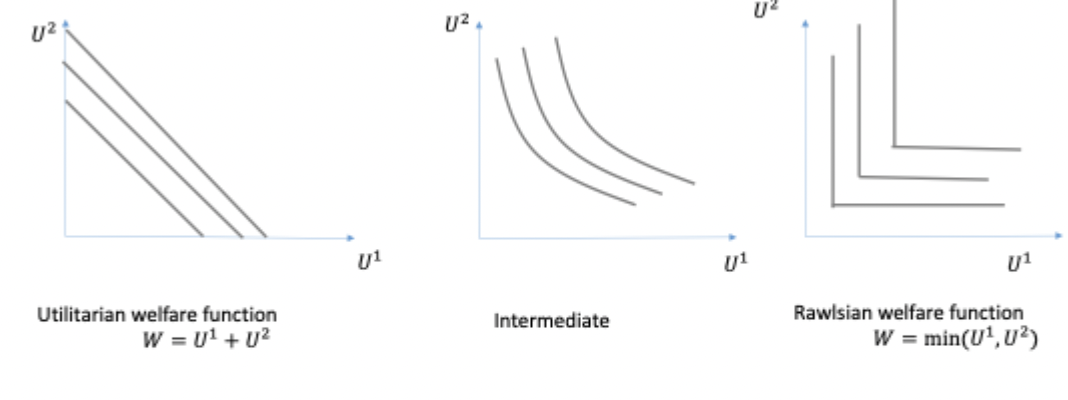
Socially optimal allocation
Highest social indifference curve on the utility possibility fruntier.

How to reach the socially optimal allocation?
Tax and transfers (2nd welfare theorem)
Arrow’s impossibility theorem
No democratic mechanism in which people can express their preferences can satisfy these 4 properties:
Rationality (Aggregate preferences are complete and transitive)
Unrestricted domain (on individual preferences): works for any possible individual preferences, not just special cases
Weak pareto optimality: if everyone prefers A over B, society prefers A over B
Independence (from irrelevant alternatives): the social ranking of A vs B depends only on individual rankings of A vs B, not on some third option C
Solution to the Arrow’s impossibility theorem in political economics
Drop the unrestricted domain on indiviudual preferences (2)
OR dictatorship lol
3 voting systems and their problems
Key takeaway: same preferences, different system → different winner
This means that aggreagting the prefernces of everyone is hard/impossible in a democratic system.

policy that beats every other option in pairwise voting.
Pairwise voting = comparing two options at a time, head-to-head.
Instead of voting on A, B, C, D all at once → you vote:
A vs B → winner goes against C → winner goes against D
The Condorcet winner is the option that wins every single pairwise vote against all others.
So which option you compare first defines the outcome → a chier.
voter whose bliss point divides the population exactly in half
Single-peaked VS not single peaked
Single-peaked → utility goes up then down → one clear hill → Median Voter Theorem applies
Not single-peaked → utility goes up, down, up → multiple peaks → no clear winner, voting can cycle Ex: 6 and 7.

What is the solution to the Arrow’s impossibility problem?
Median voter theorem: MVT avoids Arrow's by dropping unrestricted domain (2nd condition).
CONDITIONS:
it only works when preferences are single-peaked, which is a restriction on the domain.
→ It doesn't fully solve Arrow's, it sidesteps one condition.
Median voter theorem
If preferences are single-peaked along a one-dimensional economic policy, the median voter’s bliss point represents the equilibrium outcome of the majoritatian voting game (qm), i.e. a Condorcet winner.
'“The median voter's bliss point is the Condorcet winner”
→ Useful: tells who decides of the outcome of the democratic process → helps predict which policy will be implemented. + It sidesteps the Arrows’ problem.
Median voter always wins a majority voting election.
LECTURE 3 (1 Galasso) - The Architecture of Pension systems
Pension
Stream of money received by an individual as long as they are alive.
Why pensions matter in public economics
Large component of the welfare state (16% of GDP in Italy)
Redistribute across age, income groups, cohorts
Affect labor supply, retirement, saving, taxation (Employers pay taxes for retirements, affecting negatively employement)
Create long-term fiscal commitments that are politically hard to change
Combine insurance, redistribution and intergenerational contracts
3 elements
Financial sustainability of the system (can it be viable now and in the future)
Pension adequacy (do pension systems transfer enough resources? → usually yes but it gets more and more costly)
System fairness
2 types of fairness
Sustainability fairness
Intergeneration fairness
Sustainability fairness
Do you get out a fair share of what you did put in (=as an investment did you get as much?)
Intergenerational fairness
Is the system fair cohort to cohort (usually it is not → causes problems).
Ex: someone retiring in the 80s got higher pensions, contributed less, and retired at an earlier age.
Pension system characteristics
Coverage: who is protected?
Financing: who pays?
Formula: how are benefits calculated?
Risk: who bears demographic, wage, political, or financial risk?
Objective: Insurance, redistribution, adequacy or actuarial fairness?
Risks in the pension system
Demographic risk: aging
Wage risk: no economic growth
Financial risk: funded pension → risk of getting less
Political risk: reform
→ Who bears them?
Types of pension benefits
Contributory pensions (=income replacement, funded by contributions that hence give you a right to pension):
Old-age or early-retirement pensions: workers who satisfy age and/or contribution requirements.
Disability pensions: workers who become unable to work. Once you reach the retirement age you switch to old-age pension.
Survivor pensions: spouses and children of deceased workers
Non-contributory pensions (=poverty relief, funded by the general taxation):
social pensions or minimum-income schemes: usually for elderly individuals with low income.
Ex: RSA in France.
How are pension benefits financed
Social security contribution: Paid by workers, employers, or both. Linked to earnings.
General taxation: Used for social pensions that are without contribution, credits or benefits.
Accumulated assets: Funded systems → accumulation of contributions invested and later converted into retirement income.
What is impacted by the financing system chosen
Labor costs
Redistribution
Political exposure
Pensions systems
Pay as you go (PAYG)
Fully funded
Pay-as-you-go (PAYG)
Current workers pay the pensions of current retirees.
Intergenerational transfer: every generation pays for the past one, hoping to benefit as well later.
Depends on the number of workers, wages, contribution rates, and benefit rules.

Who benefited the most of PAYG
1st generation of PAYG because they:
Contributed at low rates or not at all if they were already old
Got generous pensions
Retired earlier than current generations
PAYG: main return
Demographic → Employment
Economic growth → Amount of contributions
→ High demographic and economic growth ensures there is a lot of contributions.
PAYG: main risks
Demography
Productivity
Politics
PAYG: Political exposure
Eligibility
Indexation
Retirement age
PAYG: Transition problem
Implicit pension debt
Fully funded
Contributions are accumulated in assets
Worker contributes ot a fund made of
Assets
Financial returns
Benefit of annuity or drawdown once they retire.

Advantages of Fully funded
Diversifies demographic risks
Less reform risk
Disadvantages of fully funded
Financial market risk
Annuity risk
PENSIONS ARE NOMINAL (not indexed on inflation, contrary to what is done in the PAYG)
Fully funded: main return
Market performance/how it is invested.
Fully funded main risks
Asset prices
Inflation: what you have is NOMINAL once you retire
Annuity markets
Fully funded: Political exposure
Regulation: Ex: government can impose a class of assets.
Tax incentives
Guarantees
Fully funded: Transition problem
Double payment if replacing PAYG
What is the impact of a pension reform
Changes WHO bears the risk. Rarely eliminates it.
Types of benefit formulas
Defined Benefit (DB)
Defined Contribution (DC)
Notional DC (NDC)
A pension formula is a distributional rule.
Types of benefit formulas: Defined Benefit (DB)
Benefit formula is defined in advance
contributions or public transfers must finance it.
Types of benefit formulas: Defined Contribution (DC)
Contributions are defined in advance
Benefits depend on accumulated assets and returns
Types of benefit formulas: Notional Account (NDC)
contributions are recorded in a notional account
Benefits depend on notional wealth and life expectancy.
Table of benefit/Finance
