ECON 2310 Binary Dependent Variables, Probit, Logit
 Call Kai
 Learn
 Practice Test
 Spaced Repetition
 Match
 Flashcards
 Knowt Play
1/86

There's no tags or description
Looks like no tags are added yet.
87 Terms
so far dependent variable Y is continuous
district-wide average test score
• traffic fatality rate
But we might want to understand the effect of X on a binary variable:

data of mortgage denial and race
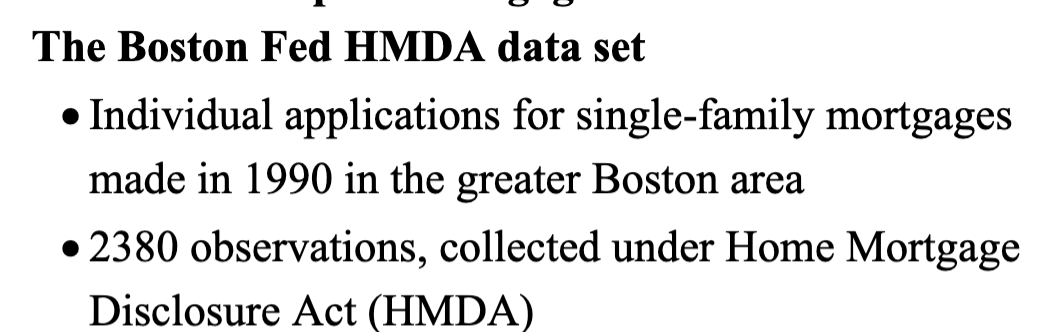
variables of mortgage denial and race

a natural starting point is

but with our linear regression model
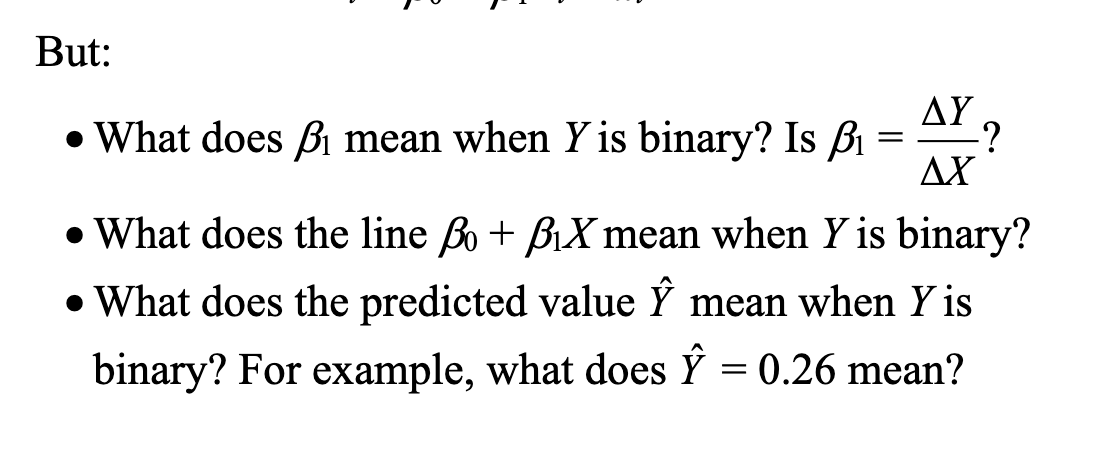
linear probability background

when Y is binary…
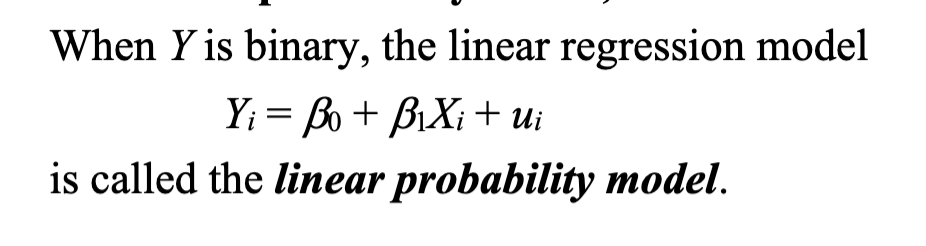
the predicted value is

now B1 is

scatterplot of mortgage application denial and payment to income ratio

linear probability model: HDMA data

What is the predicted value for P/I ratio = .3?

Calculating “effects:” increase P/I ratio from .3 to .4:

The effect on the probability of denial of an increase in P/I ratio from .3 to .4 is to increase the probability by .0604, that is, by 6.04 percentage points.
next include black as a regressor:

questions about black regressor
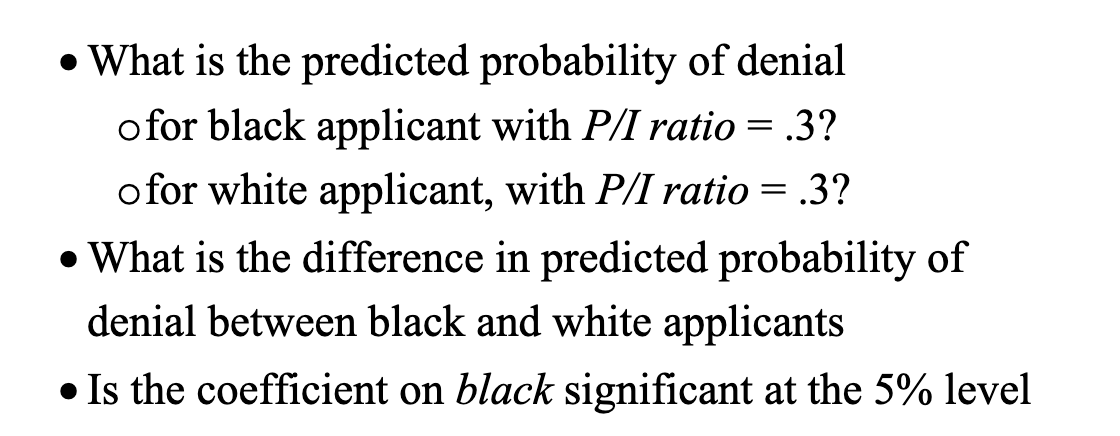
predicted probability of denial:

conclusions from predicted probability of denial

so the linear probability model
Models probability as a linear function of X
linear probability model advantages
(what errors??)
simple to estimate and to interpret
o inference is the same as for multiple regression (need heteroskedasticity-robust standard errors
linear probability model drawbacks
Does it make sense that the probability should be linear in X?
o Predicted probabilities can be <0 or >1!
• These disadvantages can be solved by using a nonlinear probability model: probit and logit regression
The problem with the linear probability model is that it
models the probability of Y=1 as being linear:

instead of linear probability model we want

probit model satisfies these conditions

probit model graph
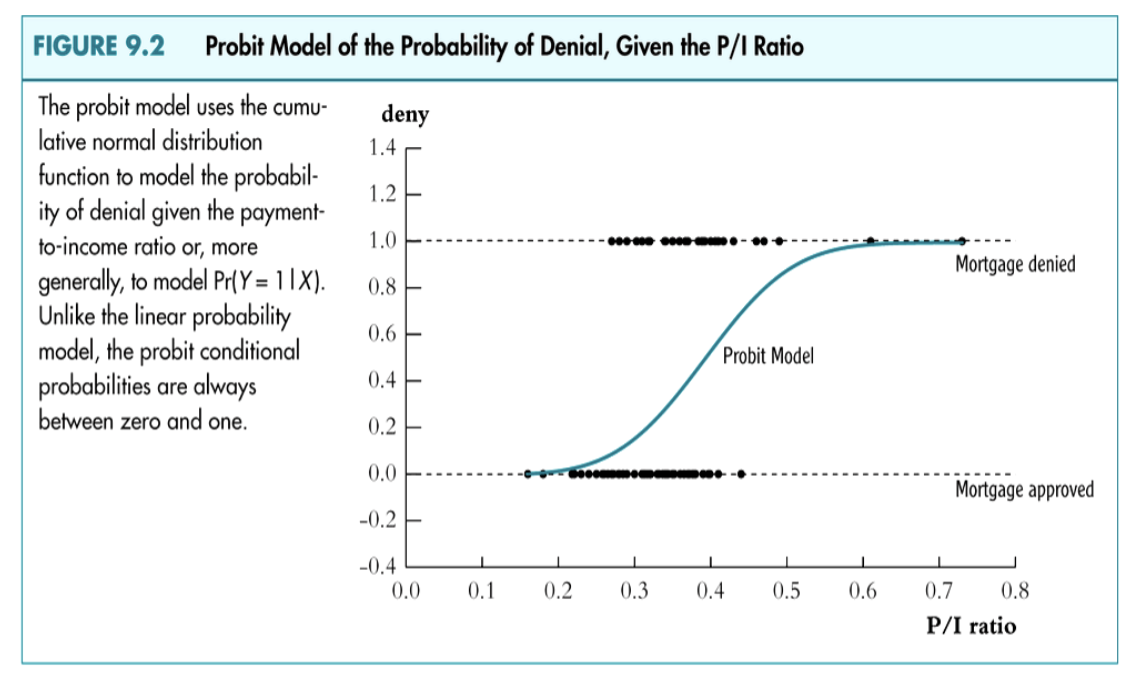
probit regression

probit regression anatomy


example probit regression

cumulative standard normal dist function probit model

Why use the cumulative normal probability distribution?

relatively straightforward interpretation of cumulative normal probability dist

probit regression with multiple regressors

probit regression with multiple regressors anatomy

application to mortgage data

more mortgage data questions
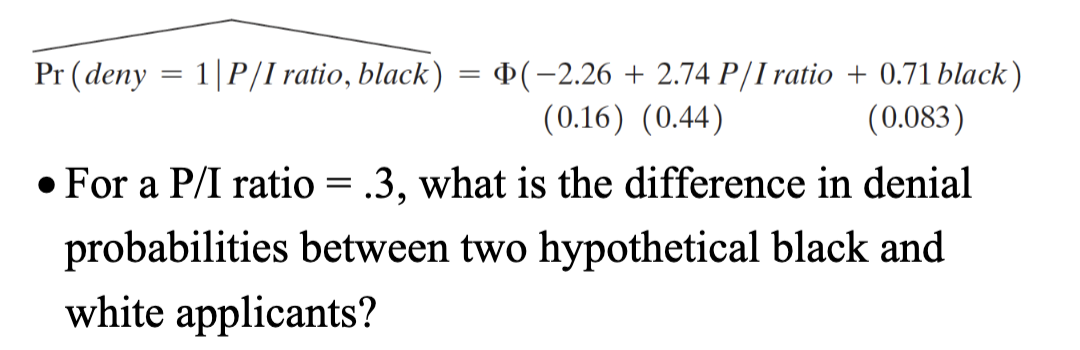
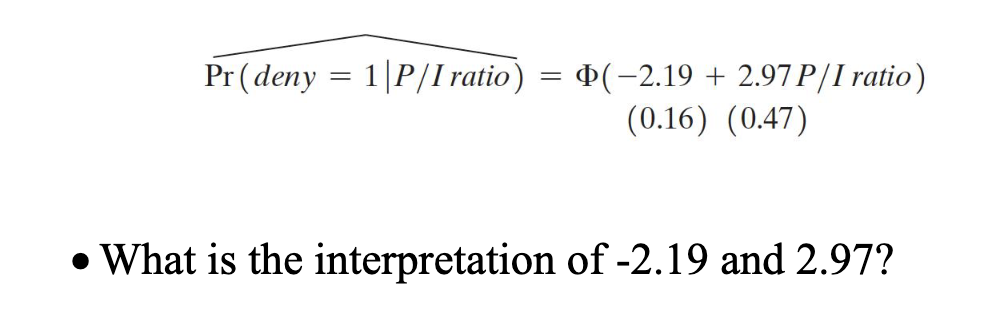

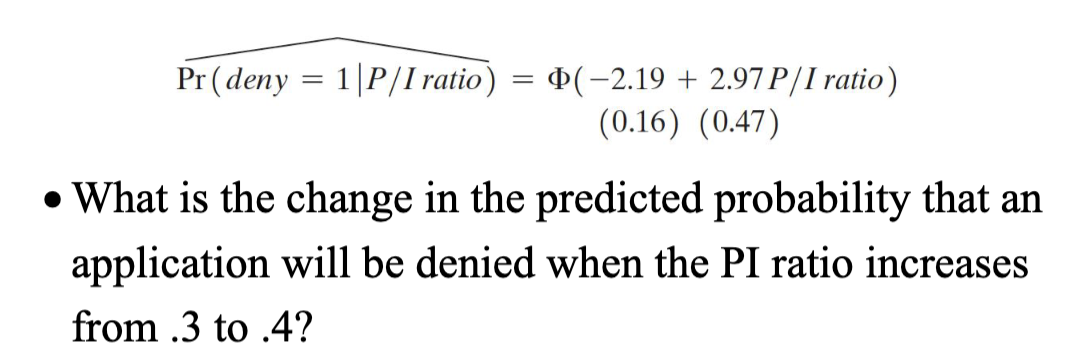


logit regression

F is the cumulative logistic distribution function:

logistic regression

logistic regression example

Why bother with logit if we have probit?
• Historically, numerically convenient
• In practice, very similar to probit
But which one should we use in practice?
Predicted probabilities from estimated probit and logit models usually are very close
• They are like two lenses showing the same picture. They both model the probability of 𝑌 = 1 in almost the same way, just slightly different in terms of the mathematical functions
No wrong choice. Researchers choose which one to use based on convenience, interpretation, and discipline norms:
o Logit model: coefficients can be interpreted as log-odds
o Probit is more used in Economics. Logit is more used in Political Science, Sociology
probit and logit models graphic
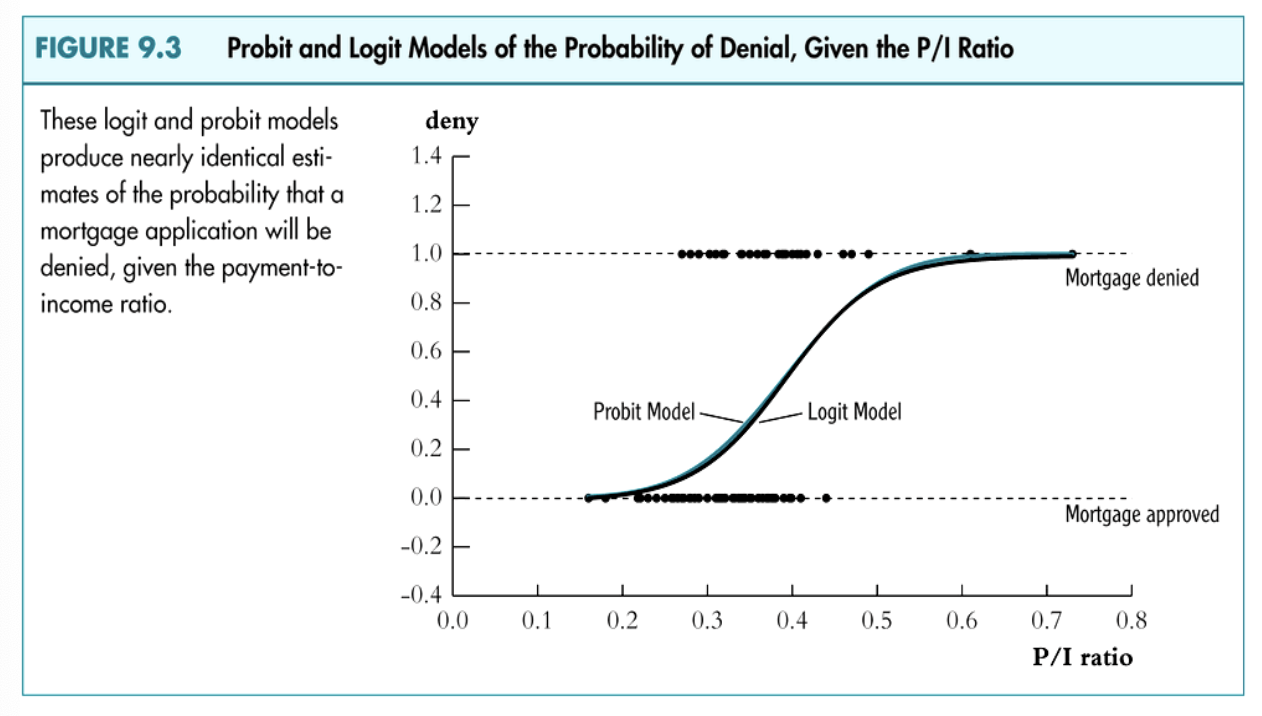
mortage data probit logit?

probit model again

probit model estimation and inference questions

probit model estimation and inference
First discuss nonlinear least squares (easier to explain)
• Then discuss maximum likelihood estimation (what is done in practice)
recall OLS

in probit we have a different regression function
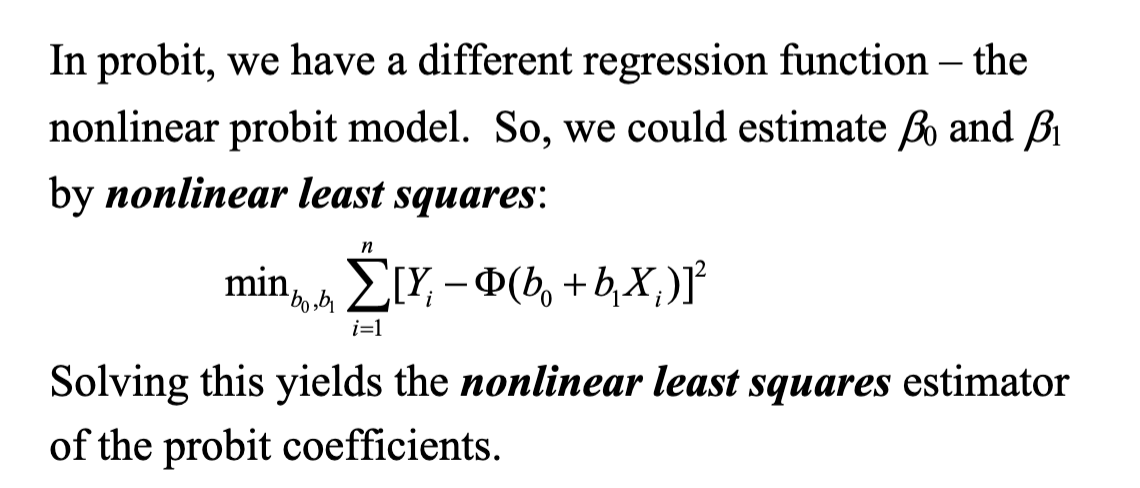
nonlinear least squares

how to solve minimization problem

nonlinear least squares estimator shares two key properties with the OLS estimator in linear regression

there are, however, estimators that have a smaller variance than the nonlinear least squares estimator
nonlinear least squares estimator is inefficient.
you need to know

likelihood function
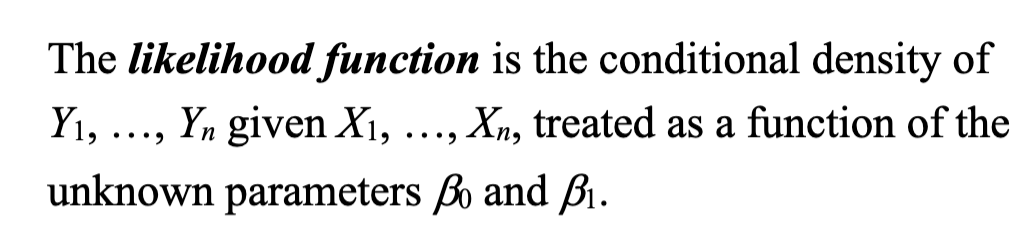
maximum likelihood estimator

MLE notes

probit likelihood with one X derivation

continued derivation

The probit likelihood function is the joint density of

probit likelihood function is considered as

probit likelihood function goal of beta values

As in the case of one X, in large samples

only difference between probit and logit is

as with probit

here measures of fit such as R2 and adjusted R2
do not make sense here because they are based on linear least squares assumptions.
Two other specialized measures are used:
fraction correctly predicted rule
pseudo R2 measure
fraction correctly predicted rule
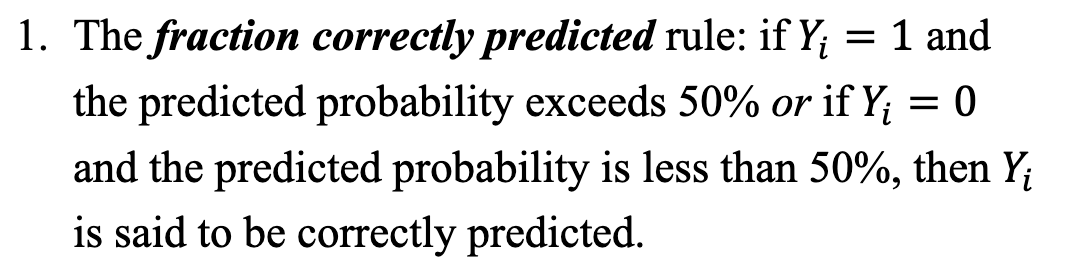
fraction correctly predicted rule notes

pseudo R2 measure
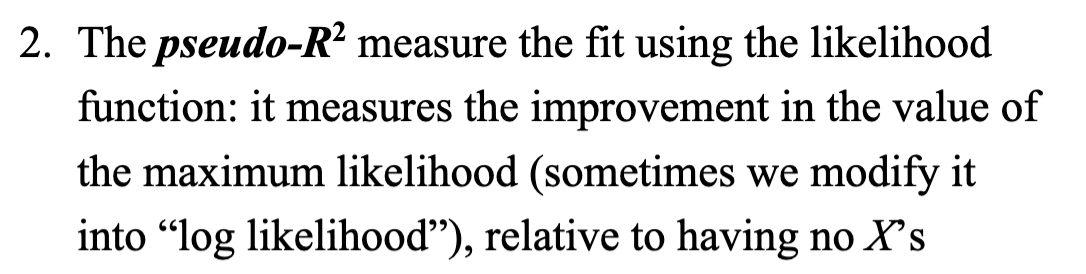
pseudo R2 measure notes

now apply to boston HMDA data

HDMA data set
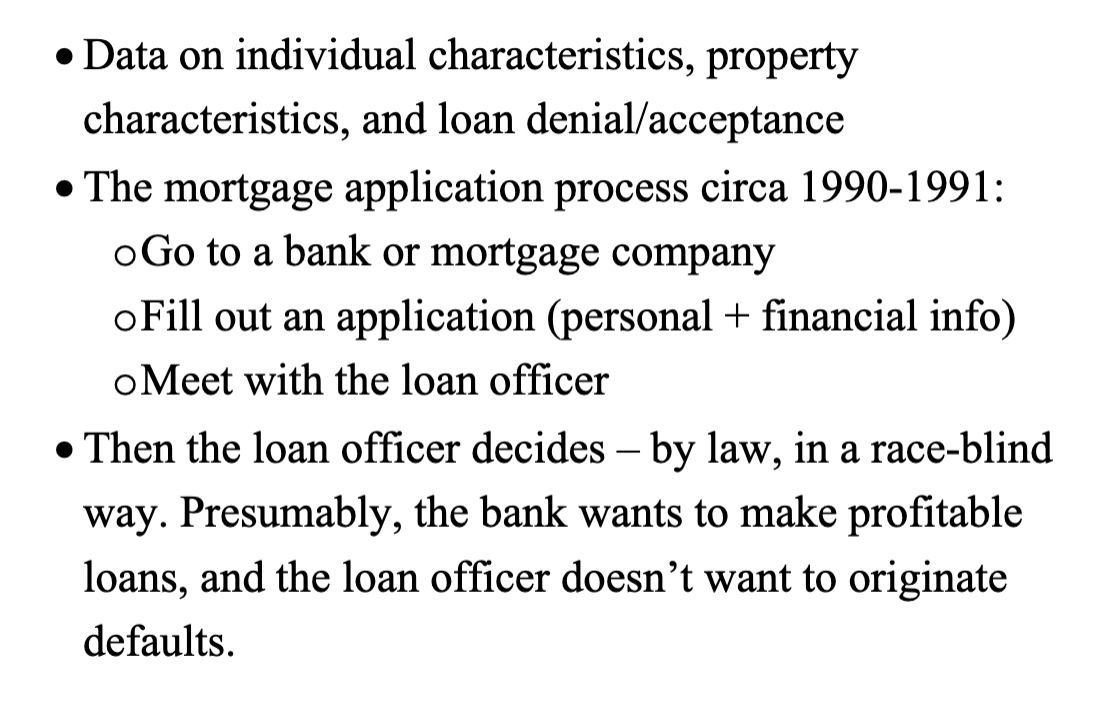
loan officer decision

decision rule is

graphic of variables included in regression models of mortgage decisions

continued graphic of variables included in regression models of mortgage decisions

mortgage denial regressions using Boston data

continued mortgage denial regressions using Boston data

3rd mortgage denial regressions using Boston data

summary of empirical results

estimates of effect
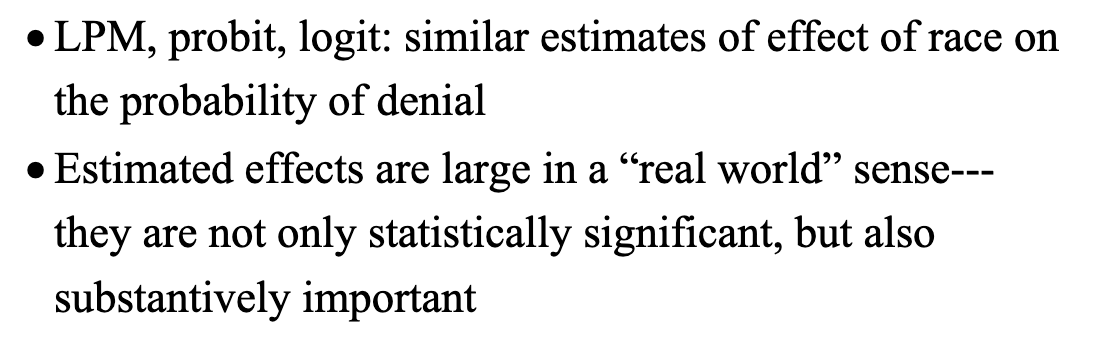
summary of chapter 11

2nd summary of chapter 11
