Population Ecology week 10
 Call Kai
 Learn
 Practice Test
 Spaced Repetition
 Match
 Flashcards
 Knowt Play
1/33

There's no tags or description
Looks like no tags are added yet.
34 Terms
Inference vs exploitation
how competitors interact with the resource
Contest vs scramble
how the consequences of competition are distributed between individuals
What is interference competition?
Individuals direct prevent competitors from accessing a resource
What is exploitation competition?
Individuals compete indirectly by consuming a shared resource
What is contest competition?
Some individuals obtain almost all of the resource and others obtain very little
What is scramble competition?
Resources are shared more evenly among competitors
Resources are shared more evenly among competitors
What does the Lotka-volterra model of competition predict?
The outcomes of competition between 2 species
What are the 4 possible outcomes?
Competitive exclusion
Species 1 wins
Species 2 wins
Stable equilibrium
Unstable equilibrium
How many equations does the Lotka-volterra model of competition have?
2 - one for each competitor
What do they model?
The growth rate of each competitor

What does Ni represent?
Population size

What does Ki represent?
The carrying capacity

What does ri represent?
The intrinsic rate of increase
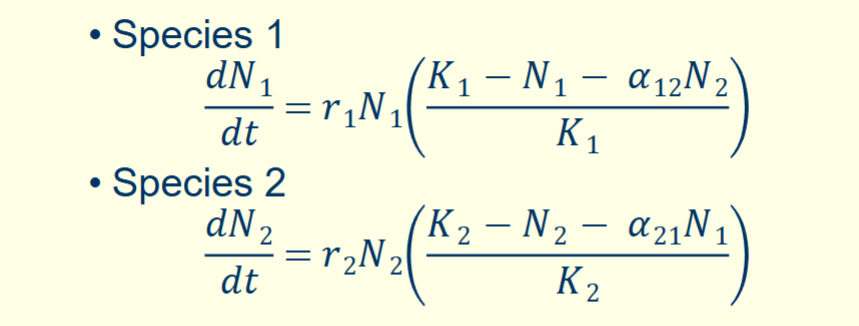
What does aij represent?
coefficent of competition
How do you plot the Lotka-Volterra competition graphically?
Using a phase plane diagram
What do phase plane diagrams plot?
The abundance of one species against the abundance of another
What are isolclines and nullclines?
Lines where the growth rate of a species equals zero

What equation does this represent?
Y = mx + c

Which of the 4 possible outcomes does this graph show?
Stable Equilibrium

Which of the 4 possible outcomes does this graph show?
Unstable equilibrium

Which of the 4 possible outcomes does this graph show?
Competitive exclusion - species 1 wins
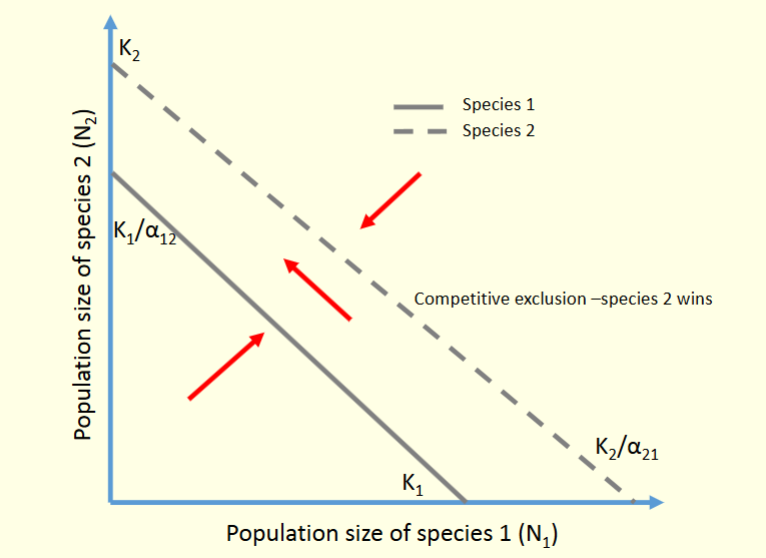
Which of the 4 possible outcomes does this show?
Competitive exclusion - species 2 wins
What does the Outcomes of Lokta-Volterra Competition Models depend on?
carrying capacities and competition coefficients
When does coesisitence occur?
When intraspecific competition for both species is stronger than interspecific competition
What does the model assume?
competition coefficients are constant
environment is constant
no lag is species response to competition
equilibrium models

What does V represent?
Population size of prey

What does P represent?
Population size of predators?

What does r represetn?
Intrinsic rate of increase of the prey
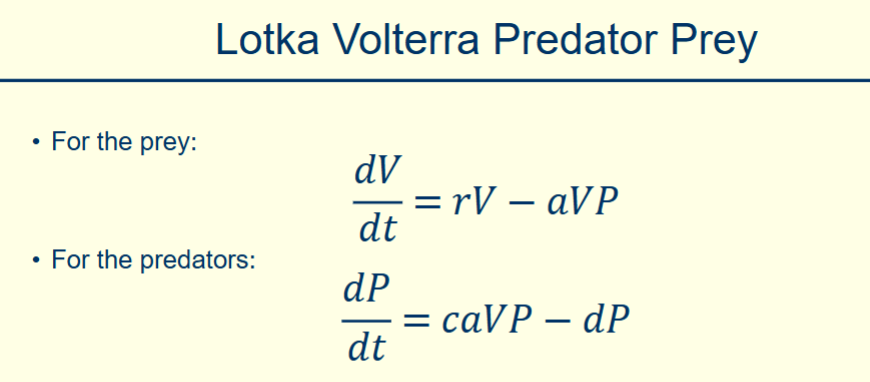
What does a represent?
predation rate

What does c represent?
conversion rate of prey consumed into new predator individuals

What does d represent?
death rate of predators

What does adding the term fV2 do?
introduces negative density dependence in the prey population.
As prey abundance increases:
Competition among prey increases.
Prey growth slows.
The prey zero-growth isocline changes from a horizontal line (P=r/a)(P=r/a)(P=r/a) to a downward-sloping line:
P=r−fVaP=\frac{r-fV}{a}P=ar−fV

What does this graph show?
A very efficient predator
Notice that the red predator isocline intersects the blue prey isocline to the left of the hump's peak.
This means:
Predators are very efficient.
Predators can persist even when prey densities are relatively low.
Predator pressure destabilises the system.
Small perturbations are amplified rather than dampened.
Increasing prey food supply can
destabilise predator prey dynamics causing large oscillations