ECON 2310 Regression with Panel Data
 Call Kai
 Learn
 Practice Test
 Spaced Repetition
 Match
 Flashcards
 Knowt Play
1/81

There's no tags or description
Looks like no tags are added yet.
82 Terms
panel dataset
A panel dataset contains observations on multiple entities (individuals), where each entity is observed at two or more points in time
panel data examples
Data on 420 California school districts in 1999 and again in 2000, for 840 observations total.
• Data on 50 U.S. states, each state is observed in 3 years, for a total of 150 observations.
• Data on 1000 individuals, in four different months, for 4000 observations total
panel data notation
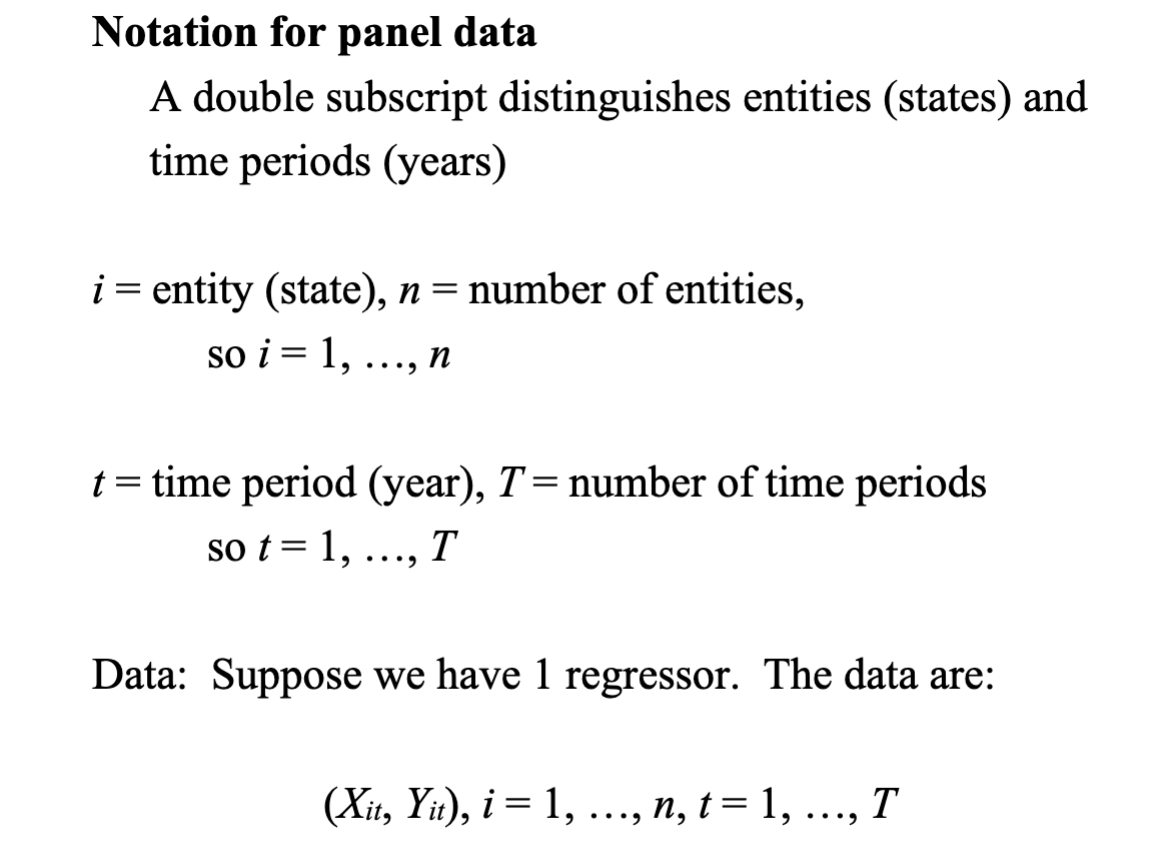
panel data with k regressors

balanced panel
no missing observations
unbalanced panel
some entities (states) are not observed for some time periods (years)
traffic deaths and alcohol taxes observations

traffic deaths and alcohol taxes variables

traffic death data 1982

traffic death data 1988

why might there be more traffic deaths in states with higher alcohol taxes?
Other factors that determine traffic fatality rate:
• Quality (age) of automobiles
• Quality of roads
• “Culture” around drinking and driving
• Density of cars on the road
why panel data is useful
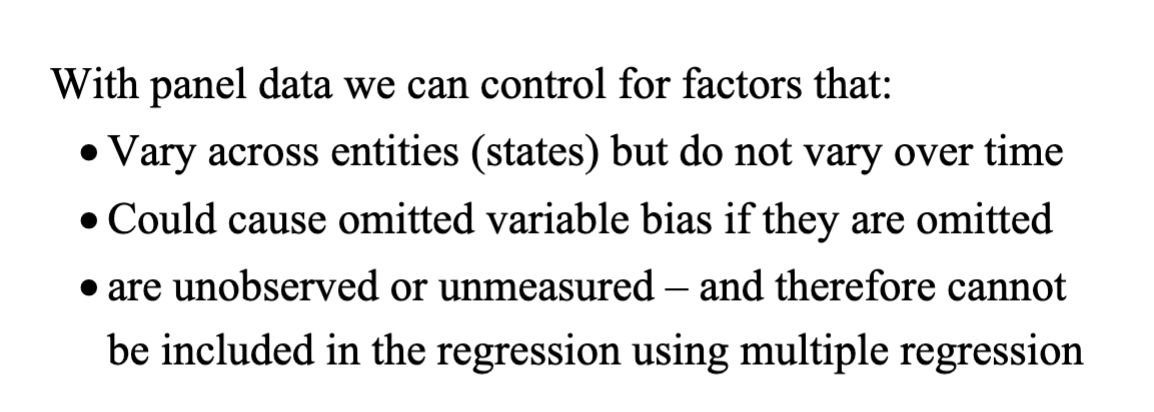
key idea:
If an omitted variable does not change over time, then any changes in Y over time cannot be caused by the omitted variable.
omitted factors that can cause OVB
Example #1: traffic density. Suppose:
(i) High traffic density means more traffic deaths
(ii) (Western) states with lower traffic density have lower alcohol taxes
OVB example and panel data
Then the two conditions for omitted variable bias are satisfied. Specifically, “high taxes” could reflect “high traffic density” (so the OLS coefficient would be biased positively – high taxes, more deaths)
• Panel data lets us eliminate omitted variable bias when the omitted variables are constant over time within a given state
example 2: cultural attitudes towards drinking and driving
(i) arguably are a determinant of traffic deaths; and
(ii) potentially are correlated with the beer tax, so beer taxes could be picking up cultural differences (omitted variable bias)
OVB example 2
Then the two conditions for omitted variable bias are satisfied. Specifically, “high taxes” could reflect “cultural attitudes towards drinking” (so the OLS coefficient would be biased)
• Panel data lets us eliminate omitted variable bias when the omitted variables are constant over time within a given state
panel data 2 time periods

Zi in two time periods

key idea with Zi

math behind observing effect of Zi

More math of examining Zi effect
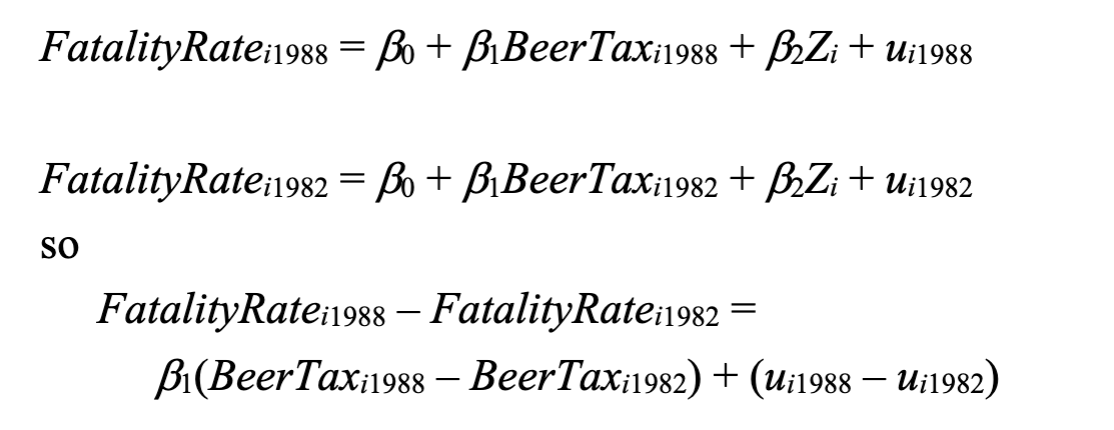
explanation of Zi between 1982 and 1988
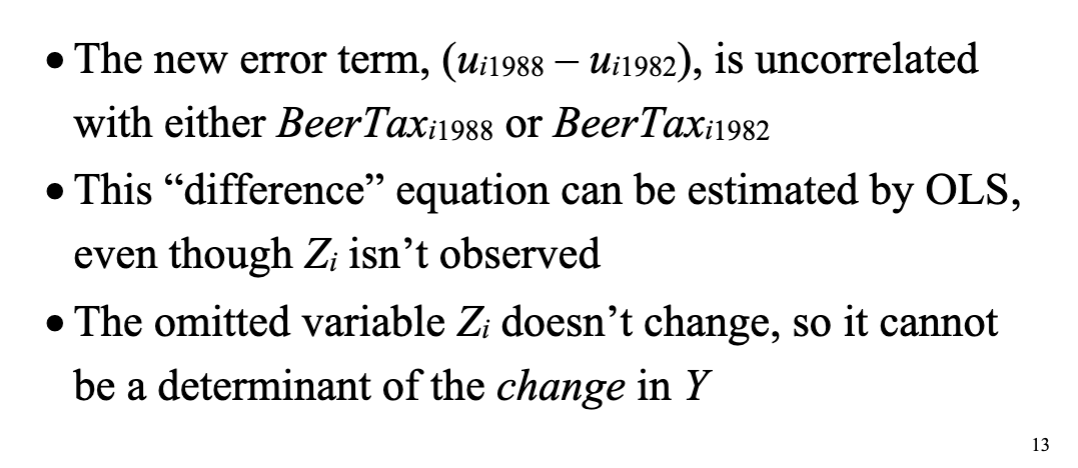
difference regression

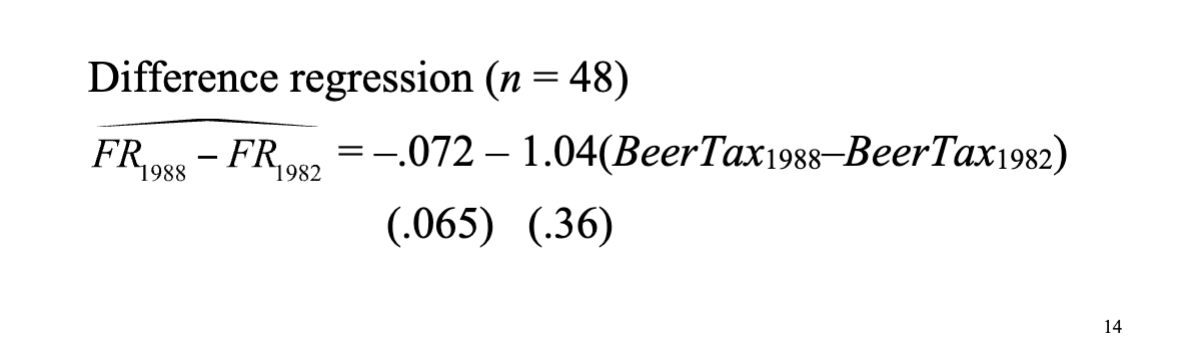
scatterplot changes in fatality and beer tax

what if you have more than 2 time periods?

2+ period rewrite - fixed effects form

population regression for California
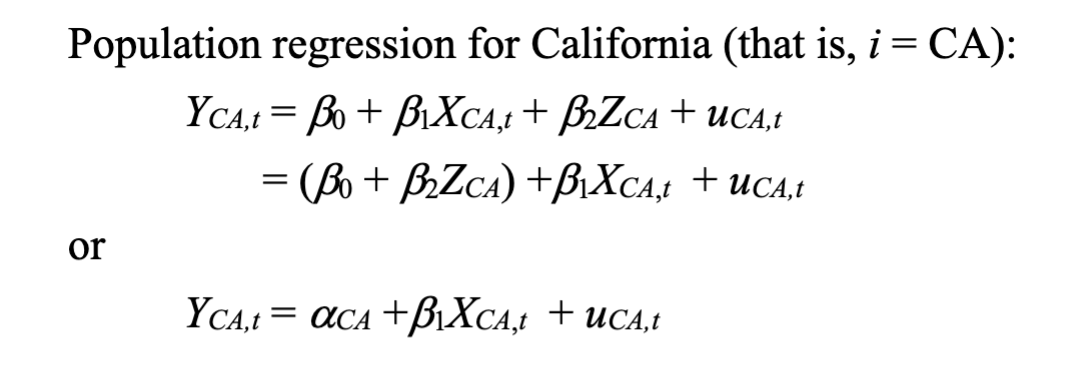
population regression for California notes

Population regression for Texas
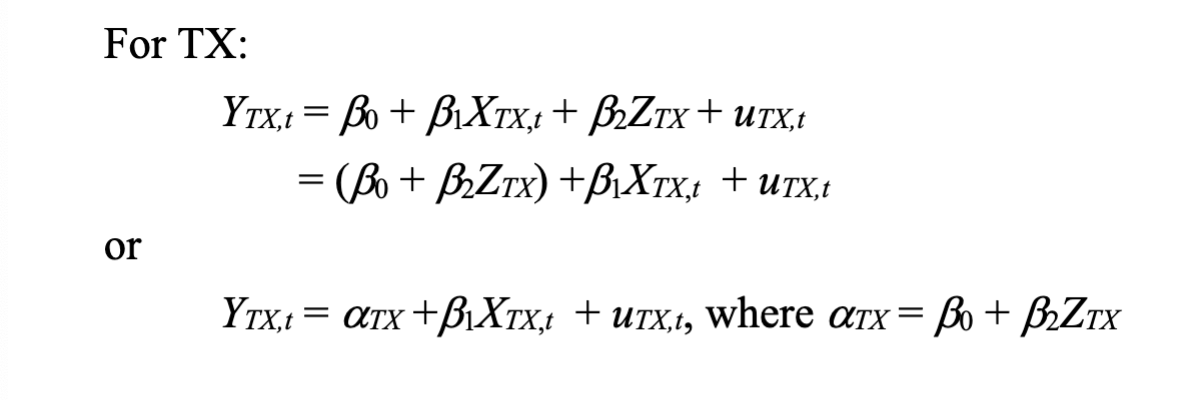
collecting lines for 3 states

graph of regression lines for each state
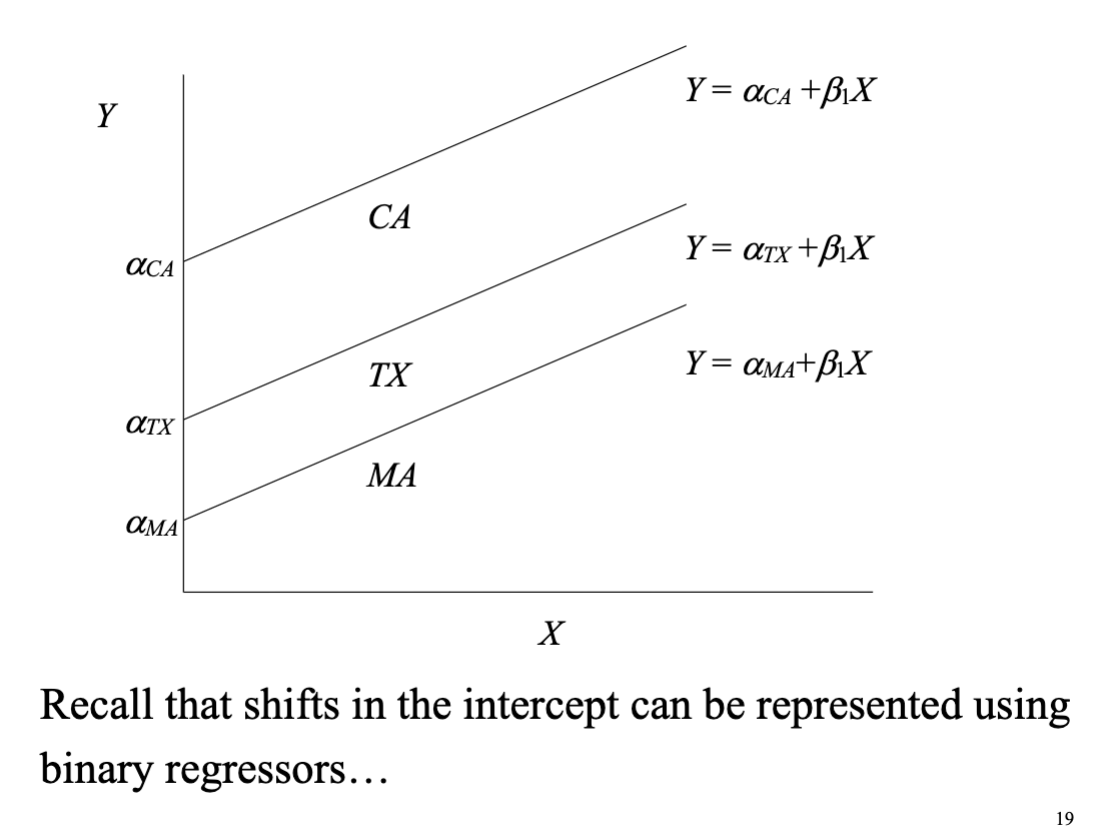
states in binary regressor form


fixed effects form

fixed effects regression estimation

fixed effects regression estimation notes

n-1 binary regressors ols regression

n-1 binary regressors ols regression notes

entity demeaned OLS regression
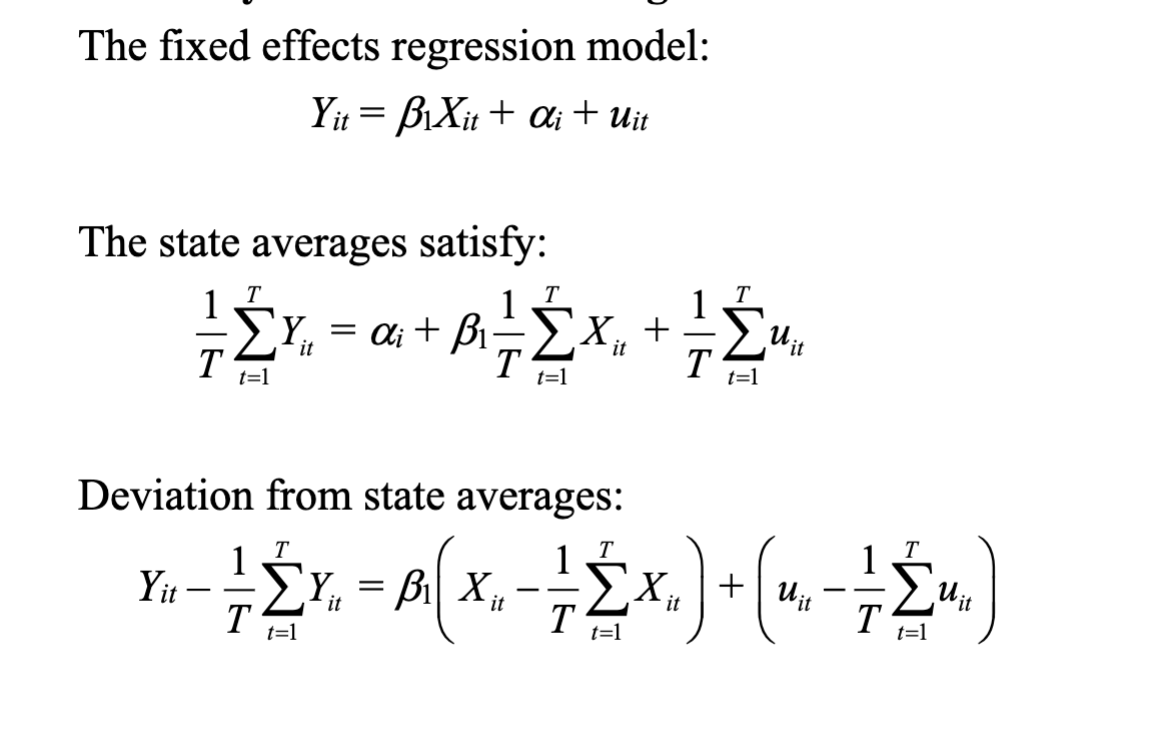
continued entity demeaned OLS regression

entity demeaned OLS regression for i = 1 and t = 1982

more on entity demeaned OLS regression

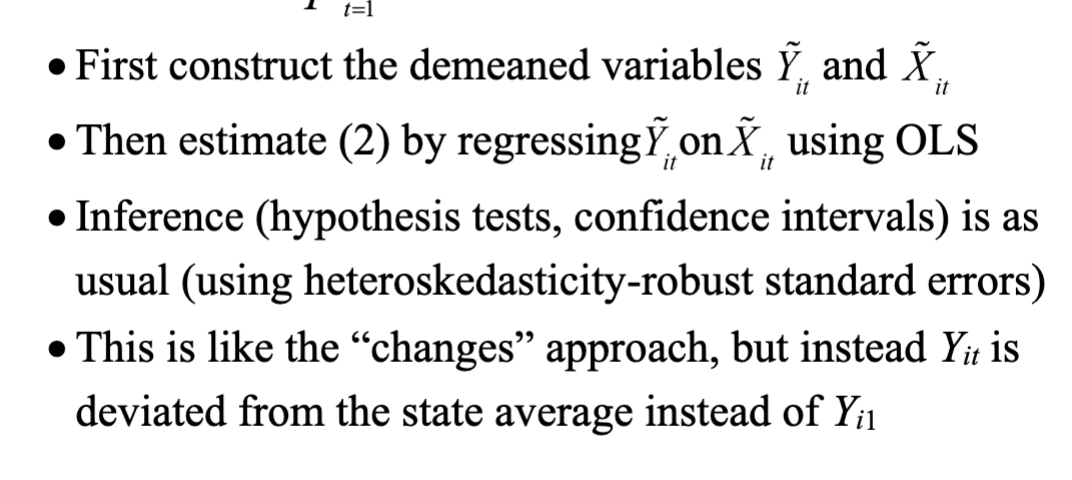
entity demeaned OLS regression steps
regression with time fixed effects is similar to
state fixed effects regression
An omitted variable might vary over time but not across
states!
Safer cars (air bags, etc.); changes in national laws
• These produce intercepts that change over time
changes in intercepts

time fixed effects only

In effect, the intercept varies from one year to the next:
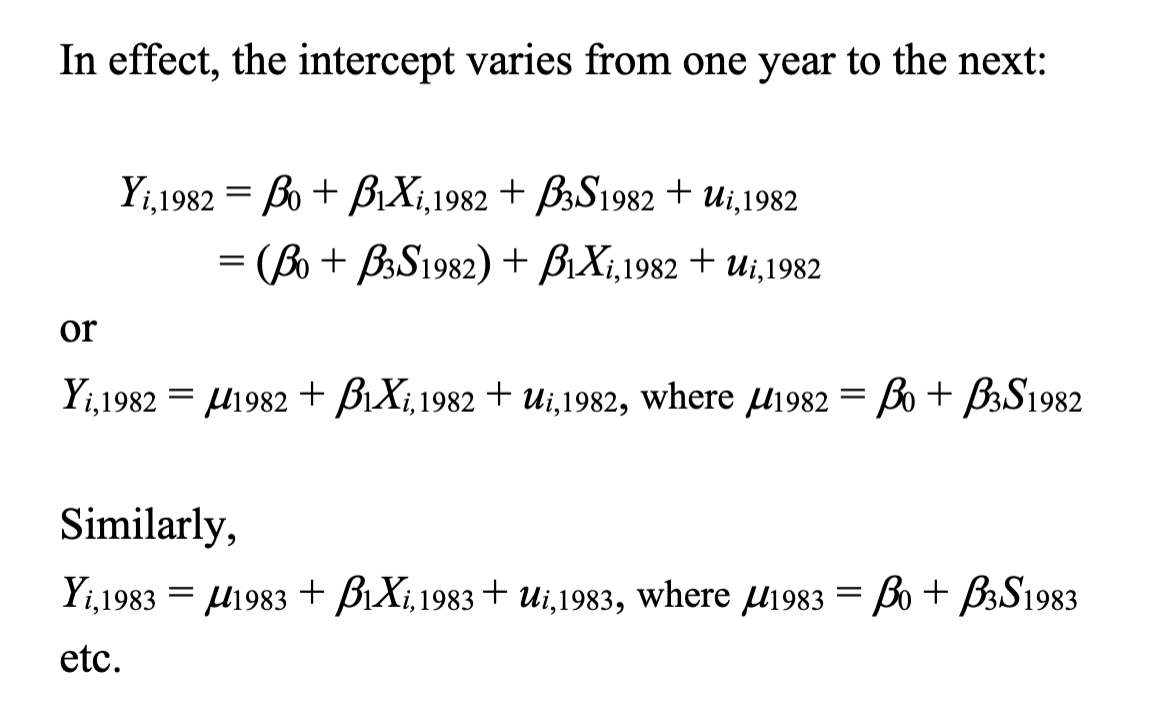
two formulations for time fixed effects
binary regressor and time effects formulations
binary regressor formulation

time effects formulation

time fixed effects estimation methods
“T-1 binary regressors” OLS regression
“year demeaned” OLS regression
“T-1 binary regressors” OLS regression

“Year-demeaned” OLS regression

state and time fixed effects
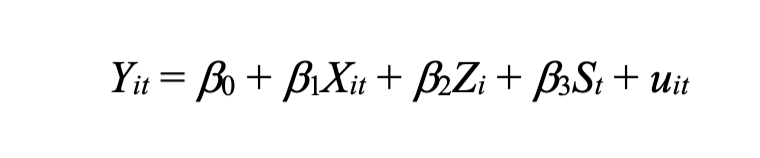
state and time fixed effects - binary vs state and time

state and time effects estimation metions
“n-1 and T-1 binary regressors” OLS regression
“State- and year-demeaned” OLS regression
“n-1 and T-1 binary regressors” OLS regression

“State- and year-demeaned” OLS regression

fixed effects regression assumptions


out of these assumptions
Assumptions 3, 4 are identical; 1, 2 differ; 5 is new
assumption 1
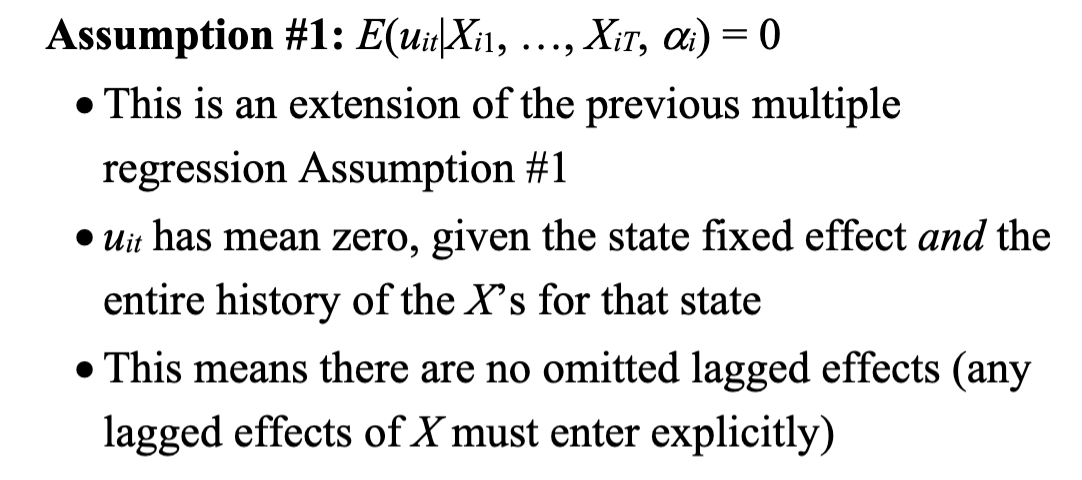
assumption 1: there is no feedback

assumption 2

assumption 5

notes on assumption 5

what if assumption 5 fails

cluster standard error

application to drunk driving laws: background

public polcy issues

balanced drink driving panel set

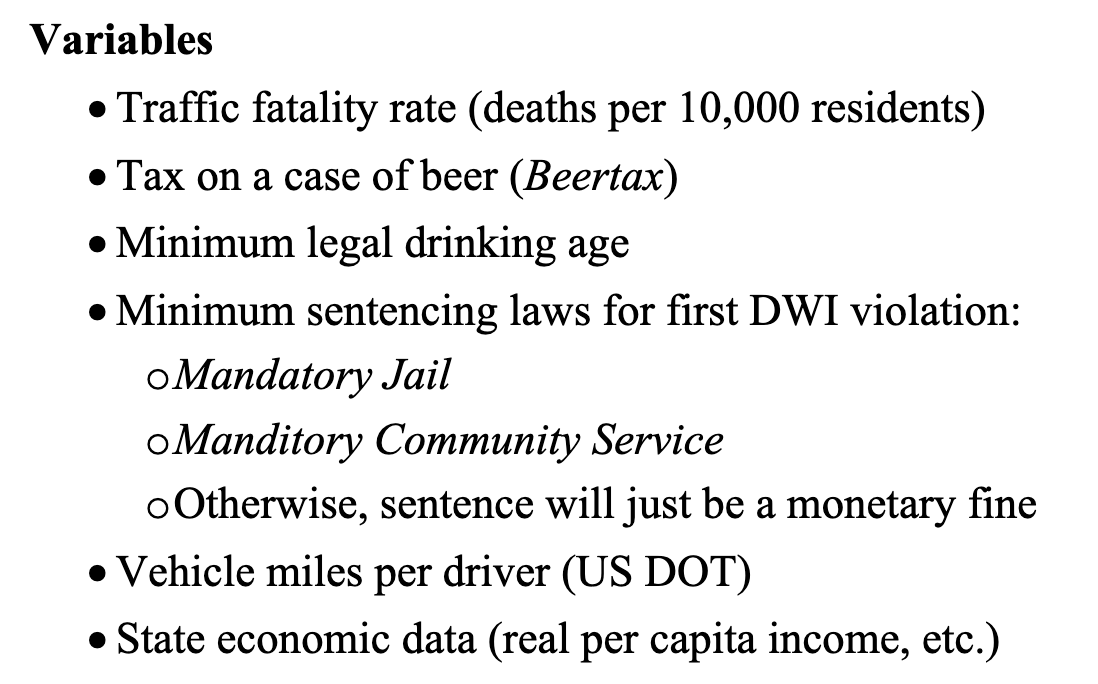
drunk driving variables
why might panel data help?
Potential OV bias from variables that vary across states but are constant over time
or
that vary across time but are constant across states
Potential OV bias from variables that vary across states but are constant over time
culture of drinking and driving
o quality of roads
o vintage of autos on the road
use state fixed effects
Potential OV bias from variables that vary over time but are constant across states:
o improvements in auto safety over time
o changing national attitudes towards drunk driving
use time fixed effects
regression analysis of effect of drunk driving: panel

f stats and p values

empirical analysis: main results

advantages of fixed effects regression

limitations of fixed effects

Fixed effects estimation can be done three ways:
