Basic ECon
 Call Kai
 Learn
 Practice Test
 Spaced Repetition
 Match
 Flashcards
 Knowt Play
1/15

There's no tags or description
Looks like no tags are added yet.
16 Terms
Coefficient of Determination (R²)

Adj. R²

Variance in Error Term

Variance in estimator

t test
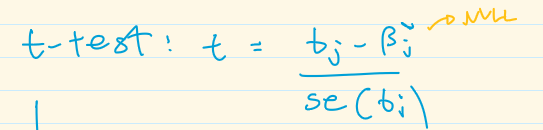
Standard error of estimator

RSS

Joint F test
signifiance / explanatory power of select set of variables (compares restricted to unrestricted)

Overall F test
explanatory power of entire model (compares unrestricted model to restricted model with literally just intercept)

standard normal density function
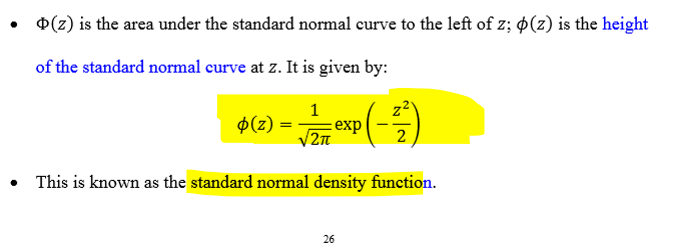
little phi
probability density function - height of curve (first deriv of CDF)
big phi
cumulative distribution function - area under curve to elft of z
index function
underlying propensity for Y=1
linear part of probit model (I = b0 + b1*Xi)
fed into CDF to yield probablilty, bounds between 0 and 1
probits coefficents are effects on the index/propensity, not on the probability tiself
coeffienet sign and signifnace remains comparable to LPM
probit
probablity y = 1 given explanatory variables.
start with LPM. goes outside 0,1 , so we map the dependat vairable to CDF isntead to its bound between
heckit model
adresses sample selciton, uses simultaneous selection (probit) and outcome (linear regression) to ensure model adjusts for self selection bias
probit models the self selection choice - it quantifies individuals propensity to self select into sample based on charactersits (explantoruy vairables), and introduced that to the outcome regression equaiton.
inverse mills ratio
little phi / big phi
measures how “selected” that indivudal is (high when their propensity to be in the sample is low)
INVERSE MILLS: 1 per person, tells yuo propensity. its coeffiecent tells you impact of that proprensity on outcome
result of selection equation, its coefficent quantifies how much selection bias would/is distort outcome equation. e.g) regressing wage on education is biased because not taking into account wage potnetial of unemployed people who do not self select into the sample