9 - Human impact
 Call Kai
 Learn
 Practice Test
 Spaced Repetition
 Match
 Flashcards
 Knowt Play
1/26

There's no tags or description
Looks like no tags are added yet.
27 Terms

These two slides present a snapshot of global human population demographics in 2023, focusing on growth rates, total numbers, and density distribution.
China and India have the most population, but India is far more densely packed
Biomass Comparison (Top Insert): The small tri-color chart at the top compares the global weight of carbon (Gt C) across living mammals. It reveals that livestock (0.1 Gt C) and humans (0.06 Gt C) vastly outweigh wild mammals (0.007 Gt C) on Earth.
main idea of this
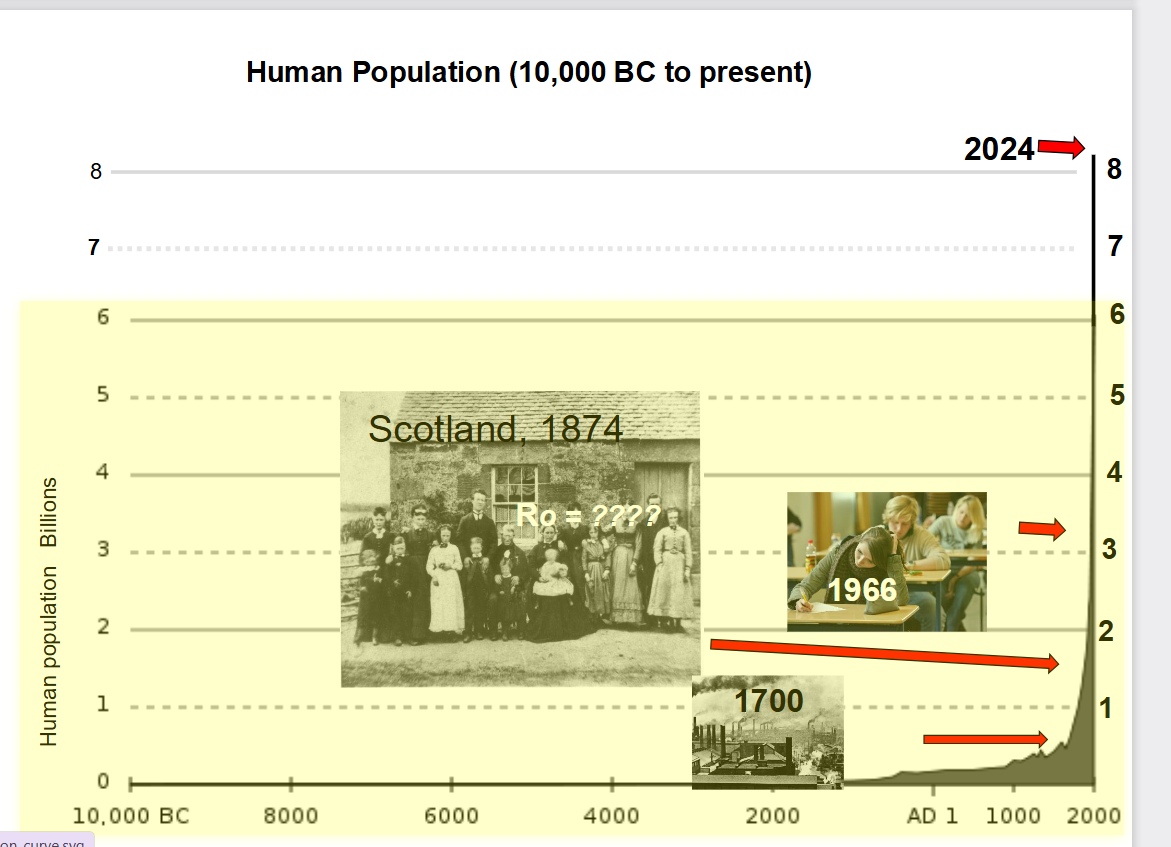
The main idea of this slide is to illustrate the unprecedented, exponential explosion of the global human population over the last few centuries compared to thousands of years of stagnation.
By 1966, the population crossed 3 billion (indicated by the classroom photo).
By 2024, the line completely spikes to the top axis, crossing 8 billion people.
The "J-Curve": The historical photos overlaying the graph emphasize how recent and sudden this transformation is—shifting from a agrarian, slow-growing world (like Scotland in 1874) to an incredibly crowded modern planet in just a few generations.
what number 1 major impact to earth ecosystems resulting from human population growth:


explain
This slide explains the ecological crisis of deforestation and severe soil erosion in Madagascar's equatorial rainforests.
It contrasts the incredible biodiversity of the island with the fragile nature of its tropical soil when the forest is destroyed.
1. Unique Ecosystem & Biodiversity (Top & Left)
Location: Madagascar is highlighted as an isolated island ecosystem off the coast of East Africa.
Flora & Fauna: The images show dense, lush equatorial forests inhabited by unique species found nowhere else on Earth, such as lemurs (including mouse lemurs and sifaka lemurs).
2. The Nutrient Cycle Trap (Center Pie Chart)
The chart reveals a critical vulnerability of equatorial forests: nearly all the nutrients are held above ground in the living plants and trees.
Unlike temperate forests where soil is rich and thick, tropical rainforest soil contains very few nutrients. Fallen leaves and organic matter decompose so quickly that the living trees suck up the nutrients immediately.
3. Deforestation and Soil Destruction (Bottom & Right)
Lateritic Soils: Once the trees are cut down or burned, the nutrient cycle is completely broken. What is left behind is highly weathered, iron-rich lateritic soil (often called "red earth").
Severe Erosion: Without a canopy to shield the ground and roots to hold it together, heavy tropical rains wash the topsoil directly into the river networks.
The "Bleeding" Island: The satellite imagery shows a dramatic aerial view of rivers running bright red-orange with sediment as they dump tons of eroded soil directly into the ocean.
Sterile Land: Because the remaining soil has "very low growth potential," it is incredibly difficult for the rainforest to naturally recover or for farming to succeed long-term.

explain
This educational infographic slide summarizes the primary drivers of deforestation in the Brazilian Amazon, highlighting the dominant role of cattle ranching and global beef production.
1. Causes of Deforestation (Chart Breakdown)
The pie chart, sourced from Mongabay, illustrates the direct causes of forest loss in the Brazilian Amazon between 2000 and 2005:
Cattle Ranches (60–70%). The largest green wedge represents extensive cattle pasture, which is by far the single biggest driver of forest clearing.
Small-Scale Agriculture (20–25%). Subsistence farming and smaller-scale crop production make up the second-largest portion.
Large-Scale Agriculture (5–10%). Commercial crops, primarily soybeans, account for a smaller direct share. However, soy expansion often pushes cattle ranchers deeper into untouched forest.
Logging & Other (3–5%). Direct timber harvesting (2–3%) and other factors like mining, fires, and infrastructure (1–2%) represent the smallest direct slices. Logging frequently degrades forests first, making them easier to burn and clear later.
Long-Term Land Conversion. The horizontal bar graph beneath the pie chart notes that 60% to 80% of all deforested land in the 1980s and 1990s ultimately ended up as extensive pasture for cattle.
2. Brazil's Beef Industry & 2025 Export Record
The bullet points on the left connect Amazon forest clearing to global economic demand:
Global Cattle Leader. Brazil maintains the world's largest commercial cattle herd, with roughly 194 million head.
Record 2025 Exports. According to the Brazilian Association of Meat Exporting Industries (ABIEC), Brazil broke historical records in 2025 by shipping 3.5 million tonnes of beef to more than 170 countries, generating over $18 billion in revenue. [1, 2, 3, 4]
3. Visual Context & Additional Prompts
Surrounding Photos. The collage illustrates the cycle of destruction. Illegal logging opens up the canopy (top left), slash-and-burn fires clear the remaining vegetation (top right), Indigenous communities lose their ancestral territories (bottom left), and cattle graze on the newly cleared pasture (bottom center).
Suggested Documentary (Cowspiracy). The slide recommends the 2014 environmental documentary Cowspiracy: The Sustainability Secret, which investigates how animal agriculture drives global deforestation, water consumption, and greenhouse gas emissions.
"Brazilian Govt Forestry Ministries???". This prompt at the bottom right invites discussion on government oversight and policy. In Brazil, forest protection and land use are managed primarily by the Ministry of the Environment and Climate Change (MMA)—alongside enforcement agencies like IBAMA—which frequently faces political and economic tension against agribusiness interests and the Ministry of Agriculture and Livestock (MAPA).

explain
This educational slide illustrates the historical pattern of forest clearing in southeastern Brazil alongside modern deforestation rates in the Amazon, connecting domestic environmental policies and citizen responses to international beef trade with Canada.
1. Historical Deforestation in SE Brazil (Maps: 1946–1988)
Rapid Forest Loss. The four maps on the right depict the dramatic clearing of forest cover (shown in black) in southeastern Brazil—specifically in states like São Paulo within the Atlantic Forest biome—over a 42-year period.
Near-Total Clearing. In 1946, dense forest covered the western and coastal portions of the region. By 1988, agricultural expansion, cattle pasture, and urban growth had reduced that forest to tiny, isolated fragments.
Context on the Left. The slide pairs this regional history with the same Mongabay pie chart from the previous slide—showing that cattle ranching drives 60–70% of clearing—and a photo of lush, intact forest waterfalls (similar to Iguaçu Falls) to contrast what is being lost.
2. Modern Clearing Rates (2019–2022)
11,000+ sq km Per Year. The bottom text notes that between 2019 and 2022, Brazil lost roughly 11,000 square kilometers of Amazon rainforest annually. [1, 2]
Recent Context. According to satellite data from Brazil's National Institute for Space Research (INPE), annual deforestation averaged about 11,600 sq km during the 2019–2022 period (an area roughly the size of Jamaica each year) before dropping sharply under stricter enforcement starting in 2023. [1, 2]
3. Public Response & Canadian Trade Connection
Citizen & Government Response. The slide notes that Indigenous peoples led the most consistent protests to protect their lands and ecosystems, whereas broader public and government action lagged behind until more recent environmental campaigns and policy shifts.
Canada's Beef Imports. The final line highlights global consumer responsibility by pointing out that Canada historically imported around $20 million worth of Brazilian beef per year (a figure that has grown significantly in recent years to over $30 million in 2025, primarily used in processed foods). [1, 2]
Would you like to examine how Canada tracks
explain
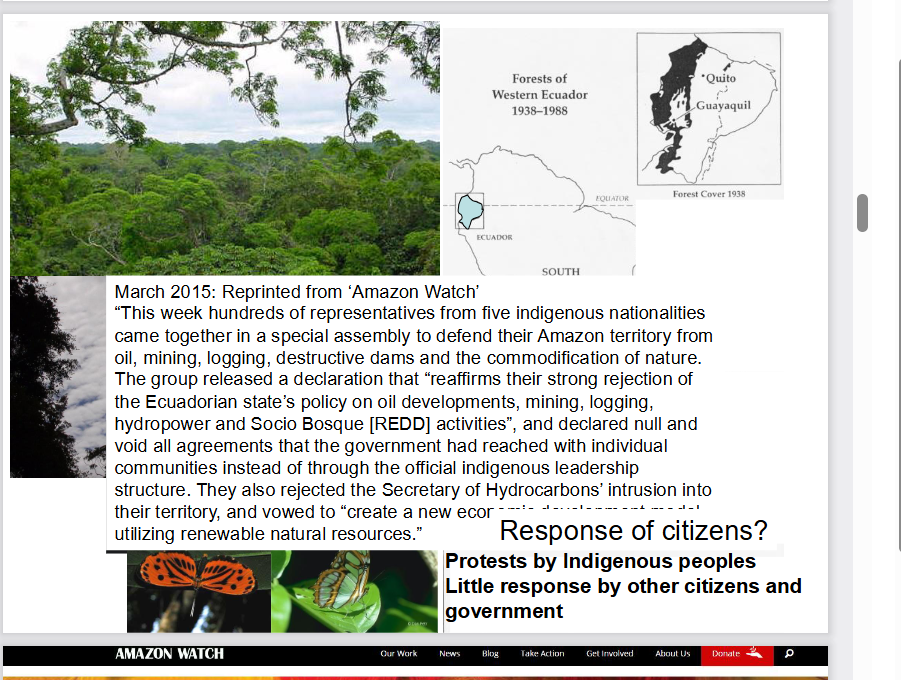
This educational slide examines deforestation and resource extraction in Ecuador, illustrating how historical forest loss in the west mirrors modern industrial pressures on Indigenous territories in the Ecuadorian Amazon.
1. Historical Forest Loss in Western Ecuador (Top Right Maps)
Widespread Clearing. The maps titled "Forests of Western Ecuador 1938–1988" track the rapid disappearance of coastal and lowland tropical forests between Quito, Guayaquil, and the Pacific Ocean.
Severe Reduction. In 1938, dense forest cover (shaded black) stretched across almost the entire western region. Over the next 50 years, agricultural expansion—particularly for export crops like bananas, cacao, and African oil palm—alongside logging and population growth eliminated over 90% of Western Ecuador's original native forests.
Biodiversity Impact. The surrounding photos of lush rainforest canopy and native butterflies highlight the extreme biodiversity found in Ecuador's ecosystems, which face severe habitat fragmentation when forests are cleared.
2. Indigenous Resistance in the Amazon (March 2015 Excerpt)
Resource Extraction Pressures. The central text reprints a March 2015 report from the nonprofit organization Amazon Watch. It describes an assembly where hundreds of representatives from five Indigenous nationalities united to defend their Amazonian lands against oil drilling, mining, logging, and hydroelectric dams.
Rejecting State Policies & "Divide-and-Conquer" Tactics. The Indigenous coalition officially rejected the Ecuadorian government's resource policies—including state-run conservation/carbon credit programs like Socio Bosque (REDD)—and declared individual community agreements invalid if they bypassed official Indigenous leadership structures.
Alternative Vision. Rather than extractive industries, the assembly vowed to build a sustainable economic development model centered on renewable natural resources and self-determination.
3. Citizen & Government Response (Bottom Right)
Frontline Defenders. Just like in the previous slide on Brazil, the summary notes that Indigenous peoples have led the primary protests and legal battles to protect the rainforest.
Limited Broader Action. The slide emphasizes that non-Indigenous citizens and government institutions offered little meaningful support or regulatory restraint at the time, prioritizing short-term economic revenue from oil and agriculture over long-term forest conservation.

explain
This educational slide illustrates the conflict between oil extraction and rainforest conservation in Ecuador's Yasuní National Park, comparing the government's 2016 push to expand drilling with a landmark 2023 public vote to halt it.
1. The 2016 Oil Expansion Push (Article Excerpt)
Major Drilling Project. The main text features an April 6, 2016 article by Kevin Koenig titled "Drilling Towards Disaster: Ecuador's Aggressive Amazonian Oil Push." It reports that Ecuador's government began constructing 276 oil wells, ten platforms, and pipelines inside the ITT (Ishpingo-Tambococha-Tiputini) oil field, also known as Block 43.
Debt-Driven Extraction. Alongside new oil leases in the southern Amazon, this rapid expansion was driven by Ecuador's urgent need to pay off massive oil-backed loans to China, its largest creditor at the time.
2. Ecological & Cultural Significance of Yasuní
Record-Breaking Biodiversity. Yasuní National Park is recognized as one of the most biologically diverse places on Earth. A single hectare in Yasuní holds more species of trees, insects, amphibians, birds, and mammals than nearly anywhere else globally.
Protected Status & Isolated Peoples. Designated a UNESCO Biosphere Reserve in 1989, the park is also home to the Tagaeri and Taromenane, Ecuador's last Indigenous groups living in voluntary isolation, whose survival depends on keeping the forest untouched.
3. The 2023 Referendum & Current Status (Bottom Update)
Historic Public Vote. The bold caption at the bottom updates the story: in August 2023, Ecuadorian citizens voted in a historic national referendum to permanently end oil drilling in Block 43 and leave the crude underground.
Delayed Closure. Although Ecuador's Constitutional Court ordered the state oil company (Petroecuador) to dismantle all infrastructure within one year (by August 2024), the physical shutdown and environmental remediation have faced significant political, financial, and logistical delays, leaving decommissioning well behind schedule.

explain
This educational slide introduces coastal temperate rainforests, shifting the focus from tropical rainforests (like the Amazon) to rare, high-latitude coastal ecosystems that hold the highest concentration of living plant mass on Earth.
1. Global Distribution (Top Right Map)
Rare & Geographically Restricted. Unlike tropical rainforests that span wide equatorial basins, coastal temperate rainforests occupy less than 1% of Earth's land surface.
Key Locations. The green shading on the world map highlights where cool, moisture-laden ocean winds meet coastal mountain ranges, generating heavy rainfall year-round:
Pacific Northwest of North America: Stretching from Northern California through Oregon, Washington, British Columbia (including the Great Bear Rainforest and Vancouver Island), and into Southeast Alaska—the largest intact tract in the world.
Southern Chile & Argentina: The Valdivian temperate rainforests along the southern Andes.
Small Pockets Elsewhere: Parts of New Zealand's South Island, Tasmania, the Pacific coast of Japan, and small remnants in northwestern Europe (such as Norway and the UK).
2. Ecosystem Characteristics (Visuals)
Mountain-to-Coast Geography. The background photo shows steep coastal mountains blanketed in dense evergreen conifers (such as Sitka spruce, western hemlock, and Douglas fir).
Lush Understory & Epiphytes. The inset photo on the left depicts an old-growth forest interior. Because the climate is cool and wet rather than hot, dead organic matter decays slowly, allowing thick carpets of mosses, lichens, and ferns to cover ancient trees and the forest floor.
3. Record-Breaking Biomass (Bottom Caption)
"Greatest biomass/ha of all ecosystems on the planet." Biomass per hectare measures the total weight of living organisms (mostly wood, roots, and foliage) in a given area.
Why It Beats the Tropics. While tropical rainforests have far more species diversity, coastal temperate rainforests grow massive, long-lived conifer trees (often over 500–1,000 years old and reaching heights over 70 meters) with minimal carbon loss to decay. As a result, old-growth coastal temperate rainforests store more total carbon and biomass per hectare than any other terrestrial ecosystem, including the Amazon.

explain
This educational slide illustrates the dramatic loss of old-growth coastal temperate rainforest on Vancouver Island, British Columbia, during the 20th century, drawing a direct parallel between local forestry history and the tropical deforestation cases seen earlier.
1. Map Comparison: Vancouver Island (1900 vs. 1999)
1900 (Left Map — 70% Old-Growth). At the start of the 20th century, roughly 70% of Vancouver Island (shown in dark green) was covered by intact, ancient coastal temperate rainforest, with the remaining 30% consisting of alpine mountains, lakes, and natural non-forested areas.
1999 (Right Map — 30% Old-Growth). After a century of intensive industrial logging, more than half of the island's original old-growth forest was cleared (shown in yellow, representing logged areas and younger second-growth plantations), leaving only about 30% intact—mostly confined to steeper, less accessible mountain valleys and protected parks.
Ecological Impact. Because coastal temperate rainforests hold the highest biomass per hectare on Earth, clear-cutting these ancient trees released massive amounts of stored carbon and fragmented critical habitats for species like marbled murrelets, salmon, and coastal wolves.
2. Social & Political Response (1900–1990)
Indigenous Leadership. Just as in the slides on Brazil and Ecuador, the bottom text notes that Indigenous peoples (First Nations) were the earliest and most consistent defenders of their unceded forest territories, protesting industrial logging that destroyed culturally significant cedar trees, salmon streams, and traditional lands.
Delayed Broader Action. For nearly 90 years (1900–1990), there was minimal pushback from the broader non-Indigenous public or the provincial government, which heavily prioritized timber revenue and forestry jobs.
The Turning Point (Context). Note that the date range stops at 1990—right before major public awareness campaigns and blockades erupted in the early 1990s (such as the 1993 "War in the Woods" protests at Clayoquot Sound), which finally forced broader citizen engagement and policy shifts in British Columbia.

explain
This educational slide builds directly on the previous map of Vancouver Island, adding detailed forest-type legends, pie charts quantifying the loss, and examples of post-1990 public protests aimed at protecting the remaining fragments of ancient coastal temperate rainforest.
1. Map Legends & Pie Charts (Sierra Club BC Data)
Forest Classification (1900 vs. 1999). Produced by the Sierra Club of British Columbia, the maps break down Vancouver Island's land cover into distinct ecological zones:
Ancient Forest (Dark Green): Productive, low-to-mid elevation old-growth temperate rainforests containing massive cedar, Douglas fir, and spruce trees.
Muskeg & Mountain Hemlock Forest (Light Green & Olive): Stunted bog forests and high-elevation subalpine forests, which are less commercially valuable for timber.
Bare Ground (White/Grey): Alpine rock, glaciers, and lakes.
Logged / Second Growth (Yellow): Areas clear-cut during the 20th century and replaced by young tree plantations.
The 71% Loss Statistic. The pie charts in the top-right corners of each map visualize the exact shift in productive ancient forest. While nearly 100% of the island's productive forest land was intact ancient forest in 1900, 71% had been logged by 1999 (represented by the large yellow slice), leaving less than 29% remaining—mostly scattered in steep, isolated valleys.
2. Post-1990 Citizen & Indigenous Protests (Bottom Caption & Inset Photos)
The caption at the bottom summarizes the shift in public response after 1990—moving from quiet Indigenous resistance to high-profile blockades to save the final "old-growth remnants" on southern and western Vancouver Island (indicated by the red arrow pointing to the Walbran/Fairy Creek region):
Clayoquot Sound (1993). Located on the west coast of the island, this was the site of the "War in the Woods," where over 850 people were arrested protesting clear-cutting, ultimately leading to UNESCO Biosphere Reserve status.
Walbran Valley (1990s–Present). Situated near Cowichan Lake and Port Renfrew, the Central Walbran is one of the last unprotected low-elevation ancient rainforest valleys on southern Vancouver Island and has been a flashpoint for decades of logging blockades and tree-sits.
Fairy Creek (2020–2021). Located just south of the Walbran Valley near Port Renfrew, Fairy Creek became the largest act of civil disobedience in Canadian history (over 1,100 arrests) as protesters—depicted in the bottom inset photos standing beside giant ancient trees and facing pol
explain
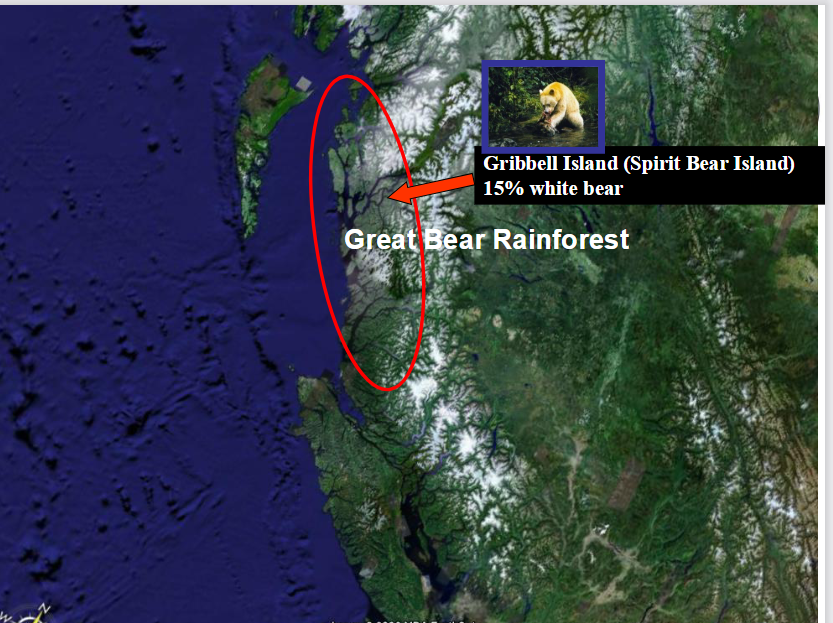
This educational slide highlights the Great Bear Rainforest on British Columbia's central and north coast, focusing on its geographic scale and its role as the primary habitat for the rare white Kermode bear (Spirit Bear).
1. Geographic Location (Satellite Map & Red Oval)
Largest Intact Coastal Temperate Rainforest. The red oval outlines the Great Bear Rainforest, stretching roughly 400 kilometers along BC's rugged mainland coast—north of Vancouver Island (visible at the bottom of the satellite image) and east of Haida Gwaii (visible in the upper left).
Global Significance. Covering approximately 6.4 million hectares (about the size of Ireland), it represents the largest remaining intact tract of coastal temperate rainforest on Earth, contrasting sharply with the heavily logged fragments seen on Vancouver Island.
2. Gribbell Island & The Spirit Bear (Kermode Bear)
What is a Spirit Bear? Pictured in the top inset, the Spirit Bear (Ursus americanus kermodei) is a rare subspecies of the North American black bear—not an albino or polar bear. Its creamy white coat is caused by a double recessive gene.
Why Gribbell Island Matters. The red arrow points to Gribbell Island (located within Gitga'at First Nation territory), often called "Spirit Bear Island." Because of geographic isolation on coastal islands, the recessive gene is much more concentrated here than on the mainland—roughly 15% to 20% of the black bears on Gribbell Island are born white (compared to about 1 in 10 on neighboring Princess Royal Island and far fewer on the mainland).
Ecological & Cultural Role. Known as Moksgm'ol to the Tsimshian peoples, the Spirit Bear holds deep cultural importance and is protected from hunting. Scientifically, white bears have been shown to catch more salmon during daylight hours than black bears because their white fur is less visible to fish looking up against a bright sky.
3. Conservation Context (Connecting to Your Previous Slides)
A Model for Co-Governance. Unlike the prolonged logging conflicts on Vancouver Island, the Great Bear Rainforest became a global model for conservation. Following intense campaigns and negotiations between Coastal First Nations, environmental groups, logging companies, and the BC government, the landmark 2016 Great Bear Rainforest Agreement permanently protected 85% of the forest from industrial logging and established strict ecosystem-based management for the remaining 15%.

explain
This educational slide zooms in on Gribbell Island within the Great Bear Rainforest, showing how industrial clear-cut logging directly threatened the core habitat of the rare white Spirit Bear before conservation protections were won.
1. Aerial View of Gribbell Island & Clear-Cut Logging ("Logged 1989")
Valley-Bottom Clear-Cutting. The black-and-white aerial terrain image looks across the steep, rugged mountains of Gribbell Island. The red arrow points directly to a pale, stripped valley floor labeled "Logged 1989."
Why This Specific Valley Mattered. In coastal temperate rainforests, the largest ancient trees and critical salmon-spawning streams are concentrated in flat, low-elevation valley bottoms rather than steep rocky ridges. Clear-cutting this valley removed essential old-growth shelter, winter denning trees, and riparian forest buffers right along a key salmon stream.
2. Impact on the Spirit Bear (Top Right Inset)
Direct Habitat Threat. The inset photo shows a white Spirit Bear (Kermode bear) feeding on a salmon in a forest stream. Because Gribbell Island holds the highest concentration of white Spirit Bears in the world (around 15–20% of the island's bear population), logging its richest salmon valleys posed a severe threat to the subspecies' survival.
Salmon-Forest Connection. Spirit bears rely heavily on autumn salmon runs to build fat reserves for winter hibernation. Clear-cutting valley slopes causes soil erosion and silt runoff that can smother salmon eggs in gravel beds, disrupting the entire food web.
3. Conservation Turning Point (Connecting to the Previous Slide)
Catalyst for the Great Bear Rainforest Campaign. Visual evidence of clear-cuts like the 1989 logging on Gribbell Island sparked intense public outcry in the 1990s. Environmentalists and the Gitga'at First Nation (whose traditional territory includes Gribbell Island) launched international awareness campaigns using the Spirit Bear as a symbol for protecting the entire coast.
Permanent Protection. Those efforts succeeded—Gribbell Island is now protected from industrial logging under the Great Bear Rainforest land-use agreements, safeguarding its remaining old-growth valleys and Spirit Bear habitat.

explain
This educational slide highlights
Haida Gwaii, an archipelago off British Columbia's north coast that serves as one of the most famous case studies in Indigenous-led rainforest conservation and land-use conflict.
1. Geographic Location (Satellite Map)
Isolated Coastal Archipelago. Located in the upper left of the satellite image—separated from the British Columbia mainland (and the Great Bear Rainforest) by Hecate Strait—Haida Gwaii (formerly known as the Queen Charlotte Islands) is a cluster of over 150 islands.
Unique Ecology ("Galápagos of the North"). Because Haida Gwaii was largely isolated from the mainland during the last Ice Age, it evolved distinct subspecies of plants, birds, and mammals (such as the Haida Gwaii black bear and saw-whet owl) found nowhere else on Earth, alongside massive old-growth Sitka spruce and western red cedar forests.
2. Logging Conflicts & The 1985 Lyell Island Blockade
Intensive Clear-Cutting. By the 1970s and 1980s, industrial logging companies were rapidly clear-cutting Haida Gwaii's ancient forests, stripping steep hillsides and damaging vital salmon streams without the consent of the Haida Nation.
The Athlii Gwaii (Lyell Island) Stand-Off. In 1985, Haida elders, hereditary chiefs, and community members formed a historic blockade on a logging road on Lyell Island (Athlii Gwaii) in the southern archipelago. Over 70 Haida citizens—including revered elders—were arrested, drawing nationwide media attention across Canada.
3. Conservation Victory & Co-Management (Connecting to Your Deck)
Creation of Gwaii Haanas (1993). Following the blockades, the Haida Nation and the Government of Canada signed the landmark Gwaii Haanas Agreement, permanently banning logging and mining across the southern third of the archipelago and establishing Gwaii Haanas National Park Reserve, National Marine Conservation Area Reserve, and Haida Heritage Site—one of the first true nation-to-nation co-management models in the world.
Broader Island Protections & Title Recognition. Subsequent agreements (such as the Kunst'aa guu – Kunst'aayah Reconciliation Protocol) protected roughly 52% of Haida Gwaii's total land base and dramatically reduced annual logging quotas. More recently, in 2024, British Columbia officially recognized Haida Aboriginal title over the entire terrestrial archipelago—a historic milestone for Indigenous land governance.

explain
This educational slide examines the history of logging on Haida Gwaii and highlights the stark contrast between physical deforestation data and official government messaging during the "War in the Woods" era.
1. Progressive Forest Clearing (1900 vs. 1967 vs. 2015)
1900 (Top Left). The earliest map shows the central region of Haida Gwaii (around Skidegate Inlet, Graham Island, and Moresby Island) completely covered in intact, ancient temperate rainforest (dark green).
1967 (Top Right). By the late 1960s, industrial clear-cutting (highlighted in bright yellow) had carved large blocks out of the accessible lowland forests along the inlets and eastern coast.
2015 (Center Satellite Overlay). By 2015, yellow clear-cut zones and logging road networks had spread across vast swathes of the island's interior valleys.
Quantifying the Loss (Bottom Left Inset). The text box titled "Logging to date" summarizes the impact: 156,000 hectares of forest were logged, eliminating 70% of the best forest—referring to the productive, low-elevation valley-bottom stands containing giant ancient Sitka spruce and red cedar (as illustrated by the inset photo showing a person dwarfed beside a massive mossy trunk).
2. Institutional Silence in the 1980s (Bottom Left Text)
Frontline Haida Resistance. During the 1980s (notably the 1985 Lyell Island/Athlii Gwaii blockades), the Haida Nation led direct protests to halt clear-cutting on their unceded lands.
Lack of Institutional Support. The slide points out that at the time, there was virtually no meaningful support or intervention from the BC government, provincial forestry and environment ministries, or even major academic institutions like UBC and UVic faculty.
3. Government Spin vs. Ecological Reality (Bottom Right Quote)
Public Concern (1980–2000). As public outrage grew over the rapid disappearance of ancient coastal forests across BC, government officials attempted to downplay the crisis.
The Dec. 6, 2002 Quote. A BC government spokesperson famously claimed: "There is more old-growth forest in British Columbia now than 100 years ago, amounting to 62 million acres."
Why This Claim Was Misleading. Ecologists and foresters widely criticized this statement because it relied on an overly broad legal definition of "old-growth" (often counting any trees over 140–250 years old, including stunted, commercially worthless alpine or bog trees). While fire suppression may have allowed some low-productivity interior forests to age past 140 years, high-productivity coastal valley-bottom ancient forests—like those on Haida Gwaii and Vancouver Island—had been overwhelmingly wiped out.

explain
This synthesis slide brings together global coastal temperate rainforest statistics, historical tropical deforestation maps, and British Columbia's conservation gap circa 2000 to show why protecting BC's remaining ancient forests became globally urgent.
1. Global Temperate Rainforest Loss (Top Right Bullets)
55% Cleared Worldwide. More than half of Earth's original temperate rainforests have already been logged or converted to other land uses.
95% Gone in the U.S. Pacific Northwest. In Washington, Oregon, and California, industrial forestry eliminated roughly 95% of original ancient coastal rainforests.
British Columbia's Global Responsibility. Because southern regions were so heavily cleared, BC holds roughly one-quarter (25%) of the world's remaining coastal temperate rainforest, making local forestry decisions globally significant.
2. Visual Parallel: Temperate vs. Tropical Deforestation (Left Side)
The left half of the slide places three regional deforestation timelines side by side to show that the pattern of rapid forest clearing is identical across both temperate and tropical regions:
Vancouver Island (Top Left — 1999). Shows 71% of productive ancient coastal temperate rainforest logged in yellow.
Southeastern Brazil (Bottom Left — 1946–1988). Shows the near-total disappearance of the Atlantic Forest (shaded black) over four decades.
Western Ecuador (Bottom Center — 1938–1988). Shows over 90% of western lowland tropical forests cleared over 50 years, noting that this loss extinguished or doomed over half of the area's plant and animal species.
3. BC's Protection Gap Circa 2000 (Bottom Right Pie Charts)
The four pie charts display how little of BC's coastal rainforest was legally protected around the year 2000 (green = Protected Areas, red = Not Protected):
Haida Gwaii: Only 11.1% protected.
North & Central Coast (Great Bear Rainforest): Only 13.9% in protected areas (with an additional 28% subject to partial logging regulations).
Vancouver Island: Only 7.9% protected.
South Coast: Only 5.9% protected.
4. The Turning Point After 2000 (Bottom Caption)
Major Policy Shifts. The caption notes that these dismal protection figures represent the baseline before Indigenous nations, environmental campaigns, and government negotiations produced landmark conservation agreements—specifically the Great Bear Rainforest agreements (2006/2016) (which raised protection to 85% across the region) and the Haida Gwaii land-use agreements (2009) (which raised protection on Haida Gwaii to over 50%).

explain
This map illustrates the global distribution of the world's major grassland and savannah biomes. While the underlying map displays multiple terrestrial ecosystems, the red outlines highlight the specific regions where open, grass-dominated landscapes thrive across different continents.
Legend & Highlighted Biomes
The bottom key categorizes the world's land biomes, with red boxes emphasizing the two primary grassland types:
Prairie (Temperate Grasslands): Represented by the light blue-gray areas on the map, these are found in mid-latitude regions with hot summers, cold winters, and moderate rainfall.
Savanna (Tropical Grasslands): Represented by the light olive-green areas, these are located near the equator and feature warm temperatures year-round with distinct wet and dry seasons and scattered trees.
Major Regions & Inset Photos
The red outlines group these biomes into major geographical zones, accompanied by photos of their native wildlife:
North America (The Great Plains & Prairies): Stretching from central Canada through the midwestern United States into northern Mexico. The inset photo shows American bison grazing on open plains.
South America (The Pampas & Llanos): Covering large parts of Argentina, Uruguay, and southern Brazil (the temperate Pampas), as well as tropical savannas further north. The inset photos depict guanacos (wild relatives of llamas) and open plains.
Eurasia (The Eurasian Steppe): A massive belt of temperate grassland extending from Eastern Europe (Ukraine and Russia) across Central Asia into Mongolia and northern China. The inset photo shows wild horses (such as Przewalski's horses) on the steppe.
Africa (The African Savanna): Wrapping around the central tropical rainforests in a wide horseshoe shape across West, East, and Southern Africa. The inset photo features wildebeest and other grazing herds beneath scattered acacia trees.
Australia (Australian Savanna & Downs): Forming a crescent across northern and eastern Australia, transitioning between tropical northern coastlines and the arid interior outback. The inset photo shows kangaroos in an open grassland habitat.
Why They Form Here
Notice how the outlined grasslands consistently act as transitional zones between wetter forests (like tropical or temperate forests) and drier deserts. In these areas, rainfall is high enough to support dense grasses, but too seasonal or scarce—often combined with wildfires and grazing herds—to allow thick forests to take over.

explain
This slide illustrates the North American grasslands (Great Plains) around the year 1700, showing their historical geographic zones, native wildlife, and how the landscape has transitioned toward agricultural use.
Historical Grassland Zones (1700 Map)
The map in the top left divides the central plains of the United States and Canada into three distinct bands based on rainfall and grass height:
Tallgrass Prairie: Located in the wetter eastern regions (such as Iowa, Illinois, and parts of Minnesota, Missouri, and eastern Kansas). Dense grasses here could grow over six feet tall.
Midgrass (Mixed-Grass) Prairie: Stretching through the central transition zone around the 100th Meridian (from Manitoba and Saskatchewan down through the Dakotas, Nebraska, Kansas, Oklahoma, and Texas). This area blends both tall and short grass species.
Shortgrass Prairie: Found in the drier western rain shadow of the Rocky Mountains (covering parts of Alberta, Montana, Wyoming, Colorado, and New Mexico). Grasses here are low-growing and drought-resistant.
Native Wildlife & Landscape
The photos along the bottom and left show the natural ecosystem that dominated this region prior to widespread European settlement and farming:
Keystone Grazers: American bison (bottom left) and pronghorn (middle left) roamed the plains in massive herds, shaping the ecosystem through grazing and fertilizing the soil.
Native Predators: Grizzly bears (bottom center) once lived across the open plains alongside wolves, relying on bison and smaller prairie mammals for food before being pushed back into mountain habitats.
Rolling Plains: The wide photo on the right shows the vast, treeless, rolling terrain typical of the prairie biome.
Modern Transition: Cattle Grazing
Agricultural Shift: The photo labeled Cattle grazing in the top right highlights how modern livestock ranching replaced wild bison herds across much of the remaining rangeland, while the fertile tallgrass and midgrass regions were largely converted into farmland.

explain
This slide illustrates how human population growth has driven the widespread conversion of natural ecosystems—especially grasslands—into cropland and pastureland over the last 7,000 years.
Expansion of Cropland (Left Maps)
The three maps on the left track the spread and intensity of farming alongside global population growth, using a color scale from light pink (low intensity) to dark red (high intensity):
5000 BC (Population: 18 million): Early farming is concentrated in small pockets along major river valleys, such as the Fertile Crescent, Egypt, northern India, and eastern China.
1800 (Population: 989 million): Cropland expands dramatically across Europe, India, China, and parts of Africa, while early European settlement begins clearing land in eastern North America.
2000 (Population: 6.15 billion): Intensive farming covers vast portions of every inhabited continent, with the darkest red zones overlapping directly with the world's fertile grasslands (like the North American Great Plains, European steppes, and South American Pampas).
Pasture Land & Grassland Loss (Right Map)
Livestock Grazing: The green map labeled Pasture Land shows global areas used for grazing livestock in the year 2000, accompanied by a small photo of cattle on open grass.
Biome Replacement: Notice how the top color key explicitly labels the starting baseline as GRASSLAND. Together, intensive crop farming (red) and livestock pasture (green) have replaced the vast majority of the world's natural prairies and savannas.
Core Takeaway
As indicated by the cut-off heading at the very bottom ("Major threats to earth's ecosystems"), the slide demonstrates that agricultural expansion is one of the primary human pressures transforming natural habitats and reducing biodiversity worldwide

explain
This slide introduces the first major threat to Earth's ecosystems caused by human population growth: habitat loss and fragmentation.
Main Concepts on the Slide
Habitat Loss: Natural ecosystems—specifically forests and grasslands—are cleared to make room for human agriculture, cities, and infrastructure.
Habitat Fragmentation: Instead of one continuous natural area, remaining habitats are broken up into smaller, isolated patches surrounded by human-modified land.
Visual Explanations
The slide uses two sets of visuals to illustrate how fragmentation affects wildlife:
Before-and-After Comparison (Bottom): The solid green rectangle on the left represents an intact, continuous forest or natural habitat. The aerial photograph on the right shows that same landscape after human development, where cleared farmland and roads have carved the forest into disconnected, angular patches.
Island Biogeography Diagram (Top Right): These three panels illustrate how isolated habitat patches behave just like islands in an ocean:
Distance Effect (Left Panel): Patches closer to a large "mainland" habitat receive more arriving species than distant patches.
Size Effect (Middle Panel): Larger habitat patches attract and support more species than smaller patches.
Extinction Rate (Right Panel): Smaller, isolated patches experience higher local extinction rates (shown by the red "no" symbols) because populations are too small to survive environmental changes or cannot easily migrate to find mates and food.

explain
This slide builds on the concept of habitat fragmentation by introducing edge effects, which occur when natural habitats are broken into smaller pieces and exposed to surrounding human-altered land.
What Are Edge Effects?
Changed Conditions: When a forest or grassland is cut into fragments, the outer boundaries (edges) are exposed to different conditions than the sheltered interior. Edges receive more sunlight, stronger winds, warmer temperatures, and lower moisture.
Increased Vulnerability: Wildlife living near habitat edges face higher risks from predators, invasive species, human disturbance, and agricultural runoff.
Loss of Interior Habitat: Certain "interior specialist" species require deep, undisturbed habitat to survive and reproduce. As fragments get smaller, the ratio of exposed edge to safe interior increases dramatically.
Visual Breakdown
Patch Diagram (Bottom Left): This illustration traces the remaining green forest patches from the aerial photo on the right. Notice how the largest block on the left is shaded dark green, representing a patch big enough to maintain a true, sheltered interior habitat. The smaller, irregular fragments are shaded bright light green, showing that they are almost entirely made up of edge habitat with little to no protected core left.
Aerial Photo (Bottom Right): Shows the real-world fragmented landscape where cleared farmland and roads create long, sharp boundaries cutting into the remaining woodland.

explain
This slide visually breaks down how edge effects shrink usable habitat and trigger a chain reaction that reduces biodiversity.
The Ecological Chain Reaction (Bottom Text)
The text at the bottom summarizes the core consequence of dividing a landscape:
Reduced Usable Size: Edge effects penetrate inward from newly created borders, shrinking the effective size of the original habitat fragment.
Smaller Populations: Less intact interior space means each remaining patch can support fewer individuals of a given species.
Fewer Species: Smaller, isolated populations are more likely to die out locally, resulting in an overall drop in biodiversity.
Visual Breakdown
Four-Square Road Diagram (Top Left): Two roads (represented by the crossing yellow-orange bands and inset highway photos) cut through a single large forest, splitting it into four smaller squares. Each square now has a light green border representing the degraded edge zone (exposed to road noise, wind, sunlight, and predators), leaving much smaller bright green cores of undisturbed interior habitat.
Real-World Deforestation Examples (Right):
Aerial Photo (Top Right): Shows narrow strips and islands of forest left behind after clearing land for pasture. Because these strips are so thin, almost the entire remaining woodland is exposed edge habitat.
Deforestation Map (Bottom Right): Shows a historical clearing pattern (from 1988, adjacent to a blue river line) where roads carve deep networks into a forest, breaking up contiguous habitat into small dark fragments.


explain
This slide explains ecotones—natural transition zones where two distinct ecosystems meet—and shows how edge effects shape wildlife populations within them.
What Is an Ecotone?
Transitional Boundary: An ecotone is a blend zone between two different habitats, such as a forest and a grassland, wet and dry land, or shaded and sunlit areas.
Mixed Conditions: Because environmental conditions here are intermediate, the ecotone is often not fully suitable for interior specialists from either neighboring community. Instead, it favors adaptable "edge species" (such as the deer shown grazing near the tree line) that use the forest for cover and the open grass for food.
Visual & Graph Breakdown
The slide pairs a landscape illustration (top) with a population graph (bottom) divided into three vertical zones:
Left Zone (Deciduous Forest Ecosystem): Dense trees dominate the landscape. On the graph below, deciduous forest species thrive at high population levels, while grassland species are completely absent.
Middle Zone (Grassland–Forest Ecotone / Edge Effect): Trees thin out into scattered shrubs and tall grass. On the graph, the populations of both forest and grassland specialist species drop sharply (shown by the crossing dashed lines) because neither group finds its ideal habitat conditions here.
Right Zone (Grassland Ecosystem): Open grass dominates with no tree cover. Grassland species reach high, stable population levels, while forest species disappear.
Key Takeaway for Fragmentation
While natural ecotones are normal parts of healthy landscapes, human habitat fragmentation creates artificial edges everywhere. Turning deep forest or open prairie into endless ecotone strips causes populations of both forest and grassland specialists to decline.

explain
The main idea of this scientific abstract is that human-created forest edges dramatically reshape vertebrate populations worldwide, driving steep habitat loss for vulnerable species that depend on deep forest interiors.
Key Findings from the Study
Widespread Impact: Forest edges influence over half of the world's forests and alter the population numbers of 85% of the 1,673 vertebrate species studied (causing some edge-tolerant species to increase while forest-core species decline).
Deep Buffer Needed: Interior ("forest-core") species—which are much more likely to be threatened with extinction—only reach healthy peak populations more than 200 to 400 meters away from sharp forest borders.
Most Vulnerable Groups: Smaller amphibians, larger reptiles, and medium-sized non-flying mammals suffer the greatest loss of usable habitat when forests are fragmented into smaller patches with more edges.
What are the two major threats to Earth's ecosystems driven by human population growth?
Habitat loss (clearing forests and grasslands, causing fragmentation and edge effects).
Global habitat change (climate change / global warming).


This NASA visualization compares global surface air temperatures in 1888 and 2011 against the mid-20th-century average (1951–1980), showing how dramatically the planet has warmed over a single century.
Color Scale (Temperature Anomalies)
The color bar indicates whether a region was cooler or warmer than the historical baseline:
Dark Blue to Light Blue: Temperatures cooler than the mid-20th-century average.
White: Temperatures close to normal.
Yellow, Orange, and Dark Red: Temperatures warmer than the mid-20th-century average.
Map-by-Map Comparison
Top Map (1888): Nearly the entire globe is shaded in cool blues, with especially cold anomalies across North America and the Arctic. This reflects global climate conditions before widespread industrial greenhouse gas emissions accelerated.
Bottom Map (2011): The map shifts almost entirely to warm yellows, oranges, and deep reds. Warming is most extreme across northern landmasses and the Arctic—a pattern known as Arctic amplification, where polar regions heat up two to four times faster than the global average.
Connection to Your Presentation
Following the previous IPCC temperature graphs, this visual highlights the geographic footprint of climate change. It shows that continents and high-latitude ecosystems experience the steepest temperature spikes, putting intense stress on wildlife that must adapt or migrate to cooler areas.


This slide presents key data from the Intergovernmental Panel on Climate Change (IPCC) showing that human activity has warmed Earth's climate at an unprecedented speed compared to the past 2,000+ years. Both graphs measure global surface temperature changes relative to the pre-industrial baseline of 1850–1900.
Graph (a): 2,000-Year Temperature History (Left)
This chart compares long-term historical climate reconstructions with modern thermometer records:
Reconstructed Data (Year 1 to 2000): The gray line and shaded band represent temperatures estimated from natural climate archives (like tree rings, ice cores, and corals). For nearly two millennia, global temperatures fluctuated gently within a narrow band, cooling slightly until the mid-1800s.
Observed Spike (1850 to 2020): The sharp black line on the far right shows modern instrument measurements. Global temperatures shoot upward past 1.0 °C, making this the warmest multi-century period in more than 100,000 years.
Speed of Change: As noted at the bottom, this modern warming is occurring roughly 10 times faster than the natural warming that ended the last ice age.
Graph (b): Natural vs. Human Causes (Right)
This chart zooms in on 1850–2020 to test what is driving the rapid temperature rise using climate models:
Natural Factors Only (Blue-Green Band): Shows what global temperatures would have done if only natural forces—specifically solar cycles and volcanic eruptions—were acting on the climate. Without human influence, temperatures would have remained flat near 0.0 °C.
Human & Natural Factors Combined (Brown-Tan Band): Includes greenhouse gas emissions and land-use changes alongside natural factors. This simulation closely matches the jagged black line of observed real-world temperatures, proving that human emissions are the primary driver of modern global warming.
Connection to Your Presentation
In the context of your previous slides on habitat loss and fragmentation, rapid climate change acts as a second major threat to Earth's ecosystems. When temperatures shift 10 times faster than natural historical rates, species struggle to adapt or migrate—especially when their habitats are already broken into isolated patches by farms, roads, and cities.
