H355 Data Analysis and Research Midterm
 Call Kai
 Learn
Learn Practice Test
 Spaced Repetition
 Match
Match Flashcards
 Knowt Play
1/188

There's no tags or description
Looks like no tags are added yet.
Name | Mastery | Learn | Test | Matching | Spaced | Call with Kai | Chat |
|---|
No analytics yet
Send a link to your students to track their progress
189 Terms
What question is stats always trying to answer
Define the empirical method
systemic observation and experimentation to determine whether what is observed is consistently different from what is expected
Define population (N)
a group of objects or people that are alike on one or more dimestions as defined by the researcher
Define sample (n)
a group of cases selected from the population for the prupose of research
Define statistic
estimates derived from a sample (can be generalized back to the original population)
Define parameter
Infinite number of values between any 2 values, equal intervals (interval/ratio level of meaurement)
Continuous variable
finite number of categories
categorical/discrete variable
What are the four levels of measurement
nominal, Ordinal, Interval, Ratio
True or false: quantitative date can be converted into qualitative data
true
True or false: Qualitative date can be converted into quantitative data
false
Define nominal data
Simplest level of measurement- number are just used as names, showing sameness or differentness of a particular quality
Categories in nominal data are:
exhaustive (all possibilities fit into a category) and exclusive (can not fit into more than one category) and in no particular order (no ranking)
The measure of central tendency is appropriate for nominal data
mode (most frequently occurring value)
A researcher allows participants to choose between married, divorced, separated, or never married. What kind of data is this?
nominal data
Define ordinal data
also referred to as “discrete” data, finite number of values for each variable
Categories in ordinal data must be:
rank ordered (each category is higher/lower but don’t know level of difference between categories)
Observations of pain in a study are arranged as mild/severe/moderate. What type of data is this?
ordinal data
What measurements of central tendency are appropriate for ordinal data?
Median, range, mode
Define interval/ratio data
Highest form of measurement
Categories in interval/ratio data must be:
exhaustive, exclusive, and ordered with equal intervals
What kind of data is temperature?
interval/ratio
What is the EBP process using Melnyk’s model
ask the question, collect the best evidence, critically evaluate evidence, integrate evidence into practice, and evaluate practice change to revise or expand
How does a nurse collect the best evidence for EBP and then critically evaluate this evidence?
find current research articles and determine the quality of the research
What would measuring temperature be in a study?
variable
What would evaluating how likely temperature readings are above 50 degrees in January be?
probability
What would the mean age of college students in a class be?
statistic
What would the mean age of all college students in the US be?
parameter
only 2 categories (yes/no; hot/cold; normal/abnormal; pass/fail)
dichotomous variable
What is an extraneous variable?
variables we may/may not understand (can influence findings)
What is a variable we have not measured but noticed we should have measured?
extraneous variable

What type of scale is this?
visual analog scale
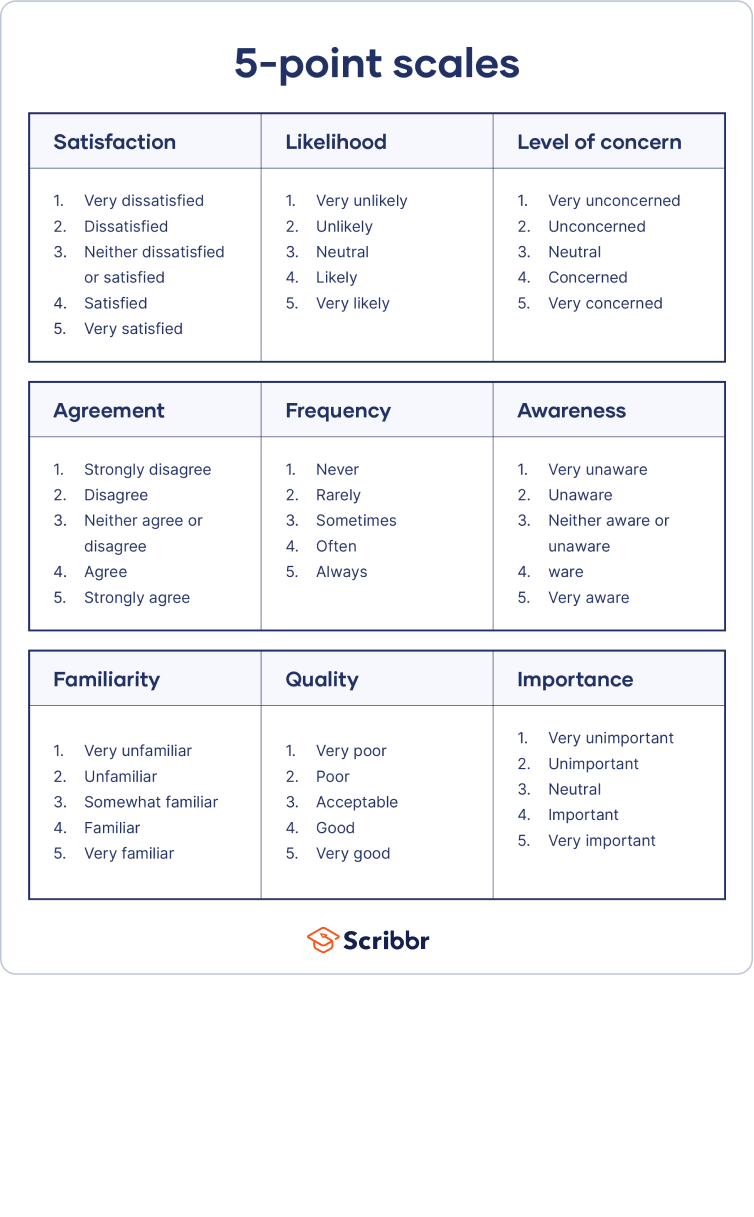
What type of scale is this?
likert-type scale

What type of scale is this?
sematic differential scale
Describe frequency distribution
frequency of each measure of a variable (summary of numerical counts of the values)
Calculate cumulative frequency
Calculate cumulative percentages
summing of percentages from the first category fo the table, ending with a cumulative percentage of 100%
Develop a frequency distribution
Calculate a percentage
(score/total score) x 100
What visual presentation is best for this data
Interpret meaning of percetile rank results
What does the symbol N represent
number of subject
What does the symbol X represent
raw score(s)
What does the symbol X-bar represent
mean
What is a cumulative frequency?
cumulative measure of frequency of a variable (number of observations with a value less than the max value of the variable interval)
What is a grouped frequency?
The frequency distribution with distinct intervals or groups to simplify the information (used when entirety of frequency distribution would be too large)
What is the drawback of grouped frequency?
Some data may be lost
How should this data be presented?: Nominal data
bar charts
How should this data be presented?: Ordinal data
Bar charts or histograms
How should this data be presented?: Interval/ratio, continuous data
histograms or line graphs
What graph has spaces between the vertical bars because each answer is in no particular order?
bar charts
what bar graph has no spaces between the bars?
histograms
what graph is developed by joining a series of points to show variable changes over time
line graph
what graph shows dots, each a subject placed where the score for variable x and variable y intersect?
scatter plot
what does an upward slope on a scatterplot show?
positive relationship/correlation
define descriptive stats
define inferential stats
define mean
average
define median
the 50th percentile or point at which 50% of subjects scored below and 50% scored above
define mode
most frequently occurring measure or category in the data
Define standard deviation
the average distance the values in your distribution fall from the mean
identify unimodal distributionse
one peak in the curve (one mode)
identify bimodal distributions
two modes (two measures or categories with the same highest frequency)
identify multimodal distributions
more than two modes (more than two measure with the same highest frequency)
determine which measure of centeral tendency is appropriate in a given data set
calculate and interpret a standard deviation adn range given for a data set
Explain descriptive results from a given data set using SPSS
Define probability and explain the range of possible probabilities.
Compare and contrast frequency and probability distributions
Frequency distributions
reflects the frequency of all outcomes in a data set (varies based on the sample)
Probability distributions
graphs the probability of all possible outcomes of a variable (uniform and never changes)
Contrast positive and negative distribution skews and describe where the outliers are present.
whats the best measure of central tendency for interval/ratio (continuous) data because all of the scores in the distribution are used to calculate it
standard deviation (s, S, SD, σ)
within one SD of the mean there is __% of data
68
within two SD of the mean there is __% of data
95
within three SD of the mean there is __% of data
99.7
Large Sd indicates ___ variability in a distribution and a ___ range of scores
more; large
small SD indicates ___ variability in a distribution and a ___ range of scores
less; small
Platykurtic Distribution
”heterogeneous” (no real similarities in scores/responses) so the distribution is flatter than a normal curve. The kurtosis (peakedness) would be negative or “platykurtic” with a short tail like a platypus.
Leptokurtic Distribution
“homogeneous” distribution that is tighter and taller than a normal distribution. The kurtosis (peakedness) would be positive or “leptokurtic” with a long tail like a kangaroo.
range
the simplest measure of variability (used with ordinal and interval/ratio data)
When outliers are to the right there is a ___ skew
positive
When outliers are to the left there is a ___ skew
negative
inferential stats
The ability to make inferences about populations based on sample measurements and the probabilities of each variable
what factors impact feasibility of a study
define validity
establishes the accuracy of an instrument in measuring the intended variables
identify methods for estabilishing validity and example of each
define reliability
what are th main components of reliability
when does inter-rater reliability needs to be assessed
whats a plan for assessing inter-rater reliability
Formulate a 2x2 table
define sensitivity
the probability that the patient will test positive for the disease if the patient has the disease [ true positive/all with disease x100]
define specificity
the probability that the patient will test negative for the disease if the patient does not have the disease [ true negative/all without disease x100]
Calculate positive predictive value of a screening test
the probability that a patient who receives a positive test result truly has the disease [ true positive/positive test result ccx100]
Calculate the prevalence of an illness and describe how the positive and negative predictive values of the screening test are affected by the prevalence of the illness among the test population
Critique a screening test utilizing a given data set
Prepare an argument for why or why not a particular screen should be utilized based on current research
Subject matter experts (SMEs) determine whether the instrument:
includes the major elements relevant to the concept being measured, maintains focus on major elements, is complete, concise, clear, and reliable
What is construct validity?
the ability of an instrument to measure a hypothesized phenomenon such as motivation, health, wellness, etc.