Question Types
 Call Kai
 Learn
 Practice Test
 Spaced Repetition
 Match
 Flashcards
 Knowt Play
1/23

There's no tags or description
Looks like no tags are added yet.
Name | Mastery | Learn | Test | Matching | Spaced | Call with Kai | Chat |
|---|
No analytics yet
Send a link to your students to track their progress
24 Terms

30% of observations are between 12 and what number?
30% is 0.30 of the population (proportion)
Rectangle Area = base x height
0.30 = b x 0.1 (perform algebra), so the length of the base will be = 3.
With the base length of 3, this means that 3 from 12 would be 15.
What proportion of observations are between 11.5 and 14?
The proportion of observations = the area under the density curve.
"What proportion of observations are between 11.5 and 14?"
"What area is under the density curve between x = 11.5 and x = 14?"
Step 1: Identify the shape
Most introductory density curve questions use a rectangle (uniform distribution).
For example, suppose the density curve runs from 10 to 15 with a constant height.
        _______
       |       |
       |       |
_______|       |_______
10             15
Since the total area under any density curve must equal 1: height = 1/15 − 10 = 1/5 = 0.2
Step 2: Find the width of the interval you want
The question asks for the area between 11.5 and 14.
So the width is 14 − 11.5 = 2.5
Step 3: Use area = base × height = Area=(2.5)(0.2)
Step 4: Interpret 0.5 = 50%
50% of observations are between 11.5 and 14.

"95% of the data falls between 110 and 190"
Whenever you see 95%, think: μ±2σ because 95% of observations in a normal distribution lie within 2 standard deviations of the mean. If they give you 68%, 95%, or 99.7% and ask for the standard deviation, immediately translate those to 1σ, 2σ, or 3σ away from the mean and solve.
Match the percentage to the Empirical Rule:
68% → μ±1σ
95% → μ±2σ
99.7% → μ±3σ
Identify the endpoint of the interval.
Write an equation:
Lower endpoint: μ − kσ
Upper endpoint: μ + kσ
Solve for σ
Example
Mean = 150
95% lies between 110 and 190
Since 95% = μ±2σ
150 − 2σ = 110
σ = 20


Random Variable X has a triangular distribution in the interval from 3 - 7. What must the height of this triangle be in order for it to be a true density curve?
Formula for area of a triangle: A = 0.5 x base x height
Get the length of the base (3 - 7 = 4)
1 = 0.5 × 4 x h
Solve for h = 0.5 or ½
When to Use the 68%, 95%, 99.7% Rule
This rule can only be used with symmetric distribution curves, and not skewed or unbalanced distribution curves.
Distribution is normal/bell-shaped.
Problem involves 68%, 95%, or 99.7%.
Values are 1σ, 2σ, or 3σ from the mean.
Asking for:
a percentage/proportion
an interval
a standard deviation
a value one, two, or three SDs from the mean

Recognizing a Z-Score
Look at the beige shaded area on the left side of the curve in your image. The vertical line marks a particular z-score. The shaded area represents the proportion of observations that fall below that z-score.
The entire curve represents 100% of the observations.
The shaded area represents the percentage of observations to the left of the z-score.
The unshaded area to the right represents the percentage of observations above the z-score.
For example, if the shaded area is 0.30, that means 30% of observations fall below that z-score.
The standard normal table (also called the z-table) is a tool that tells you the area under the curve to the left of a particular z-score.
Reading a Z-Table
Negative Column (Left Z Score):
If there column of the z table is negative, this means that the areas in the body of the table have to all be less than 0.5.
Positive Column (Right of Z Score):
Area to the left of the positive z-scores will be numbers between 0.5 - 1.
Columns: Anything found in the side column margins, are values that can be found on the axis in the z table.
Body: Anything that is found in the body of the z-table is considered the proportion of the distribution.

What Do You Say for An Area at An Exact Point?
You say that an area at an exact point on the curve is comparable to 0 (=0). Because density curves are continuous (infinite numbers), we are always looking for a specific area of an interval. So if the proportion of the observations at a certain point will always be = to 0.
P(Z = 2) = 0
P(Z < 2) + P(Z=2)

Standardization of X Values into Z-Scores
This uses the formula for standardization.
Z-score: The number of SDs above or below the mean.
For example, the z-score of 2.30 means the x value of 196 is 2.30 Standard Deviations above the mean of 150 (0).

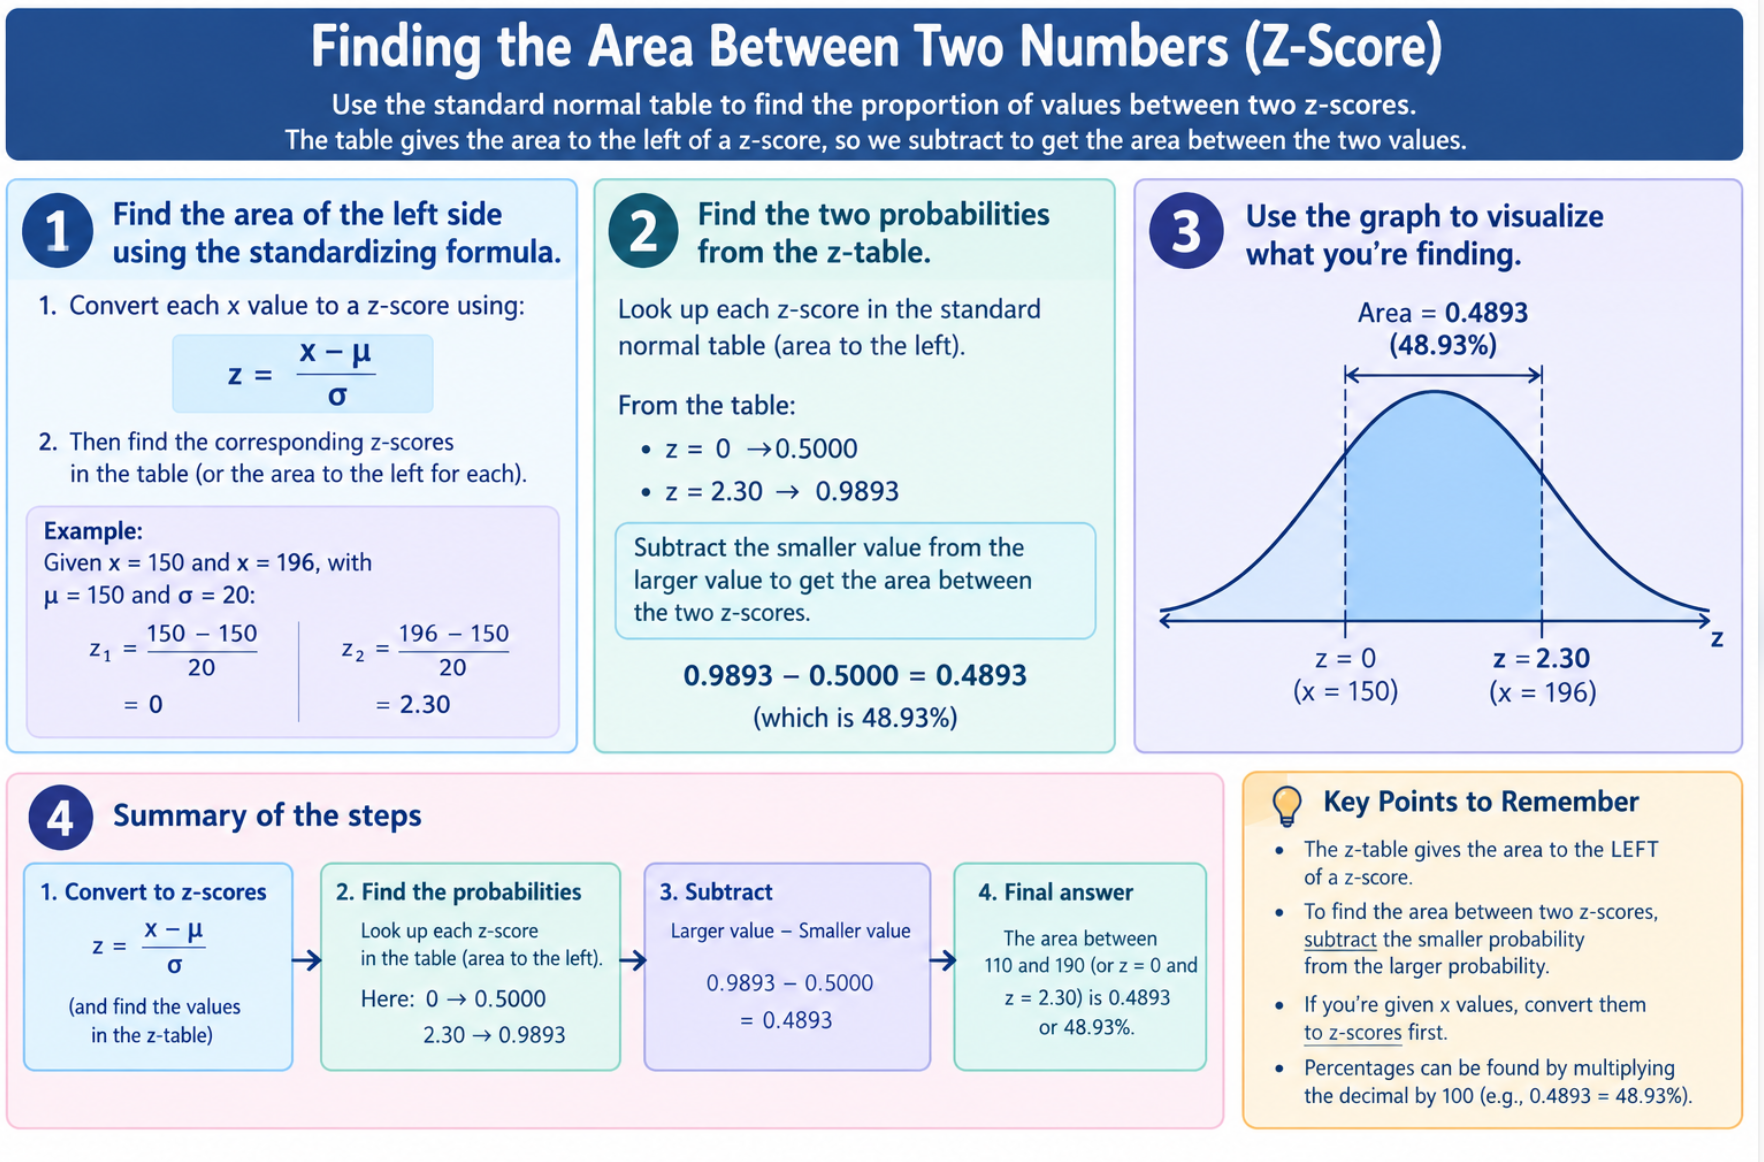
Finding the Area Between Two Numbers (Z-Score)
For this we are going to need to find the variables for two numbers. This includes first recognizing that the Z-Score table only provides us with numerical values to the left of the z-score.
Find the area of the left first through using the standardizing formula.
x = 150 / x = 196
Corresponding z score for x = 0 | x = 2.30
Subtract the two numbers (found in the z table from each other)
0.9893 - 0.5000 = 0.4893. Therefore the proportion of our observations falling within the range of 150 and 196 is 0.4893 or 48.93%.
P(Z < 0.67)
What is this asking for?
Step 1: Ask yourself what you're looking forIf you're given a Z-score and need a probability/area:
Use the BODY of the table.
P(Z<0.67)
Find row 0.6
Find column 0.07
Where they meet in the body = 0.7486
Answer: P (Z < 0.67) = 0.7486
Step 2: If you're given a probability/area and need a Z-score.
Look inside the BODY first for the probability.
Example:
P (Z < z) = 0.6700
Search the body for 0.6700
Find the closest value (about 0.6700)
Read the row and column that point to it
Suppose it lies at:
Row = 0.4
Column = 0.04
Then z = 0.44
Answer: z ≈ 0.44

P(Z < z) = 0.1660 (for example)
Big Z: Referring to the standard normal curve itself.
So it would never make sense to say what is the value of capital x, because it is a variable referring to the curve.
Little z: Specific value on the axis.
Particular value.
Notes
Whatever is inside the brackets is a number on the axis.
Whatever is outside the brackets is an area (proportion) (0.1660).

Finding a Z Score Given the Area
When given an area on the right side 0.1170. Do not look up 0.1170 in the table because we are looking for the right side.
Has to be a positive if it is on the right side.
1 - 0.1170 = 0.8830
Instead of looking up 0.1170, now look up 0.8830 in the z table body.
z score = 1.19 (positive).
For the standard normal density what is the value of x for which 11.7% of the values are larger?
How is this written in notation
P(Z > z) = 0.1170
Find little z, such that the area to the right that that little z underneath the standard normal curve is 0. 1170.
Given that Z is a standard normal variable and P(Z > z) = 0.1949 what does z equal?
What is Standard Normal Distribution?
A special normal (bell-shaped) distribution that has:
Mean (μ) = 0
Standard deviation (σ) = 1
Instead of working with actual data values, we work with z-scores, which tell us how many standard deviations a value is above or below the mean.
P(Z < z): "The probability that Z is less than a certain value."
P(Z < 0.67). Read this as "The probability that Z is less than 0.67." This is the area to the left of 0.67.
What is the 87th percentile of the standard normal distribution?
What does this mean?
What is the value of little z such that the P(Z < z) = 0.8700?
Look up 0.8700 in the body of the Z-table.
Look for which of the numbers in the body is closest to the number we are looking for 0.8708 is closest.
The number (z-score) in the margin = 1.13 (on the axis).
Forward Problems
P(X < x) | P(X < 60) | Converting the x normal curve into a z curve using this formula
Find the z-score.
Use the standardized formula to convert to a z-score.
Corresponding z-score = 1.51. Look up 1.51 in the margin which gives you 0.9345, 93.45% of the runners complete the 400-meter race in less than 60 seconds (1 minute).
P(150 < X < 196) | X~N(150, 20)
Given x values that you convert into Z scores, and find the corresponding area.

Backward Problem
You are given the area instead of the z-score.
When you are talking about anything on the x scale, you can never solve the problem directly. You have to go to your z-scale.
Any z-score is a conversion of an x value.
There are three different types of backwards problems which includes:
Take the area and look it up in the z table for a corresponding z score
This is only if the area was to the left of the diagram.
Might have to subtract the area from 1 (1 - 0.9505 = 0.0495)
This is for the right side, as the table does not cover it.
What is the value of mu (u)
Convert into the units that we are able to use.
Subtract 1 - 0.9505 = 0.0495
Look up this 0.0495 in the body of the table, which = -1.65.
Use the μ = x − zσ
When Something Follows a Normal Distribution…..
What is this question asking
X ∼ N (μ,σ)
This is referring to a normal curve (that is not a standard normal, so that rule cannot be used).
Waiting times are uniformly distributed between 0 and 20 minutes.
Uniform rectangular curve

Unit 5 Checklist
Whenever you see a density curve question, ask:
1. What shape is the curve?
Bell → Normal
Rectangle → Uniform
Triangle → Geometry
2. Is the answer supposed to be:
A probability/percentage? → Find area.
A value/x-value? → Work backwards.
3. What region is needed?
Left of a value
Right of a value
Between two values
4. What tool do I use?
Rectangle → Length ÷ Total Length
Triangle → Area formulas
Normal Curve → z-scores or 68-95-99.7 Rule
Exam scores are normally distributed with mean 70 and standard deviation 10.
What Type of Question is This
Normal (Bell Shaped) Curve

Questions usually ask:
Find an area
Find a proportion
Use triangle area formulas
Triangular Curve
