Unit 2 Graphing AOL
 Call Kai
 Learn
 Practice Test
 Spaced Repetition
 Match
 Flashcards
 Knowt Play
1/19

There's no tags or description
Looks like no tags are added yet.
20 Terms
AS/AD model graph
Key Graph Components
Vertical Axis: Price Level (PL)
Horizontal Axis: Real GDP (Y)
Aggregate Demand (AD): Downward sloping due to the wealth effect, interest rate effect, and foreign purchases effect.
Short-Run Aggregate Supply (SRAS): Upward sloping because nominal wages and input prices are sticky in the short run.
Long-Run Aggregate Supply (LRAS): Vertical line at Full-Employment Output (Yf). In the long run, wages and prices are fully flexible.

Aggregate Demand (AD) Shifters
AD shifts whenever components of Total Spending (C+I+G+Xn) change:
Consumer Spending (C): Consumer confidence, household wealth, personal taxes, household debt.
Investment Spending (I): Real interest rates, business expectations, business taxes, technology adoption.
Government Spending (G): Federal budget allocations for public goods, infrastructure, or defense.
Net Exports (Xn): Foreign consumer income, exchange rates (currency appreciation/depreciation).
Short-Run Aggregate Supply (SRAS) Shifters
SRAS shifts when the overall costs of production change:
Resource Prices / Input Costs: Prices of raw materials, energy/oil, or nominal wages.
Actions of Government: Business subsidies (increase SRAS) or business taxes and regulations (decrease SRAS).
Productivity: Improvements in technology or worker training reduce per-unit costs (increase SRAS).
Inflation Expectations: If workers/businesses expect higher inflation, nominal wages rise, shifting SRAS left.
Long-Run Aggregate Supply (LRAS) Shifters
LRAS shifts only when there is a structural change in the economy's overall production capacity:
Quantity or quality of resources (land, labor, capital).
Technology advancement.
Capital stock accumulation.
Long-Run Equilibrium
AD, SRAS, and LRAS intersect at the exact same point (Y=Yf).
Recessionary Gap
Aggregate output is below full employment (Y1<Yf)
Unemployment rate > Natural Rate of Unemployment (NRU).
AD or SRAS shifts left
Inflationary Gap
Aggregate output exceeds full employment (Y1>Yf).
Unemployment rate < Natural Rate of Unemployment (NRU).
AD or SRAS shifts right.
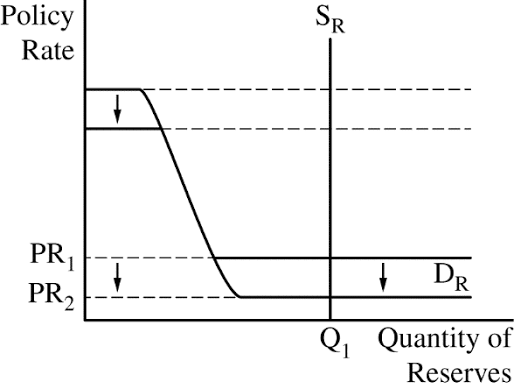
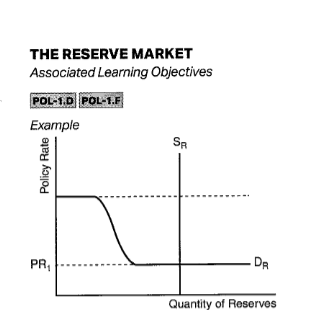
Ample Reserves Market (Modern Reserve Market) look like
Vertical Axis: Policy Rate (Interest Rate, such as the Federal Funds Rate).
Horizontal Axis: Quantity of Reserves.
Demand Curve (DR):
Downward-sloping at higher interest rates.
Flattens into a completely horizontal line at lower interest rates, bounded by the Interest on Reserves (IOR) rate set by the central bank.
Supply Curve (SR): A vertical line set far to the right, intersecting the demand curve in its flat (horizontal) region.
IORB (Interest on Reserve Balances) and Discount Rate
IORB (Interest on Reserve Balances): The primary tool used to set the floor for the policy rate (e.g., Federal Funds Rate target range).
Discount Rate: Serves as a ceiling above the policy rate for direct central bank lending.
Effect of Shifting Supply for ample reserves
Shifting the vertical supply curve left or right does not change the policy interest rate because it intersects along the horizontal portion of the demand curve
The Limited Reserves Framework (Traditional System)
Demand Curve (DR): Downward-sloping throughout the relevant range.
Supply Curve (SR): A vertical line that intersects the demand curve on its downward-sloping section.
Interest Rate VS Administered Interest Rate
Interest Rate (Market Rate): Compensates lenders for time and risk when providing funds to consumers or businesses.
Administered Interest Rate: Used as a monetary policy tool to guide and anchor market interest rates across the entire economy.
Fiscal Policy
Executing Body | Action | Tool Used | Graph Effect (AD Curve) |
Congress / President | Expansionary | Increase Spending (↑G) or Cut Taxes (↓T) | Shifts Right (→) (GDP ↑, Price Level ↑) |
Congress / President | Contractionary | Cut Spending (↓G) or Raise Taxes (↑T) | Shifts Left (←) (GDP ↓, Price Level ↓) |
Monetary policy
Executing Body | Action | Primary Tool Used | Graph Effect (AD Curve) |
Central Bank (Federal Reserve) | Expansionary (Easy Money) | Lower Policy Rates (IORB/Discount) or Buy Bonds (OMOs) | Shifts Right (→) (GDP ↑, Price Level ↑) |
Central Bank (Federal Reserve) | Contractionary (Tight Money) | Raise Policy Rates (IORB/Discount) or Sell Bonds (OMOs) | Shifts Left (←) (GDP ↓, Price Level ↓) |
Monetary Policy (recessionary gap)
(Y1<Yf)
Goal: leads to an increase in the money supply which lowers interest rates which will increase AD
reserve Ratio decreases
Discount rate decrease
buy bonds
Expansionary Monetary Policy (Easy Money):
Lower the IORB / Policy Rate.
Buy government securities via Open Market Operations (increases banking system reserves).
Monetary Policy (Inflationary Gap)
(Y1>Yf)
Goal: (leads to a decrease in the money supply which raises interest rates which will decrease AD)
Reserve Ratio increases
discount rate increase
sell bonds
Contractionary Monetary Policy (Tight Money):
Raise the IORB / Policy Rate.
Sell government securities via Open Market Operations (decreases banking system reserves).
Fiscal Policy (recessionary gap)
government spending increases and taxes decrease (leads to AD increase)
Fiscal Policy (Inflationary Gap)
government spending decreases, taxes increase (lead to AD decrease)
AS/AD graph recessionary gap

AS/AD graph inflationary gap
