Exam 2 - Systematic Review/Meta-analysis Appraisal
 Call Kai
 Learn
 Practice Test
 Spaced Repetition
 Match
 Flashcards
 Knowt Play
1/48

There's no tags or description
Looks like no tags are added yet.
49 Terms
Meta-analysis (Definition + usage of it)
Def: Systematic Review with additional
statistical techniques that combine the
results of multiple quantitative studies to
provide a more meaningful measure of
the effects
Can use it, b/c someone already appraised it
The only thing is that you’ll have to appraise it again
Scoping Review
Def: Preliminary assessment of the evidence
to establish the size and nature of
evidence base; no formal quality
assessment
No statistical analysis
It gives scoping sense of what is there
Narrative Review (definition + usage)
Def: Articles are discussed around an organizing theme in a user-friendly format; methodology may not be formal
Opinion and is biased
No statistical analysis in it
Umbrella Review (definition)
Def: Review of Reviews; summarizes the
results from multiple systematic reviews
on a topic; useful when research topic is
broad and substantial amount of
evidence exists.
Cochrane database of SRs
They are gold standard b/c they adhere to the standard
Meta analysis have ____ plots
forest plots
Good vs Poor Systematic review makes
Good Systematic Review makes a more powerful and informative result than any single study can give
Poor Systematic Review makes multiplied bias and multiplied flaws of analysis and conclusion
What does a Good Systematic review have
A focused research question
A comprehensive search of the literature
A careful appraisal of applicability and validity of each study
An appropriate analysis of the cumulative results
Quantitative and Qualitative depend on the heterogeneity
of the studies
Contents of a Meta-analysis
Introduction (background and objective)
Methods
Study selection criteria and search strategy
Study review and analysis
Results (description of studies, methodological quality, and
results of meta-analysis if possible)Discussion and conclusions
Standard tables and figures: showing characteristics of the included studies
Results of the included studies
Log of the studies that were excluded
References
How to know if the SR is external valid/applicable?
if the study’s purpose is relevant to my clinical question
if the study population (sample) sufficiently similar to your patient to
justify expectation that your patient would respond similarly to the
populationinclusion and exclusion criteria (related to which studies
were included) clearly defined and are studies that would answer
your clinical question likely to be includedif the types of interventions investigated relevant to your clinical
question (feasible and explained in enough detail to be replicable)if the outcome measures relevant to the clinical question and are
they conducted in a clinically realistic mannerthe outcome measures spanning the ICF model
How to know if the study is internally valid (overall good study)?
if literature search is comprehensive (consider publication bias from protocol)
If there is an objective, reproducible, and reliable method used to judge the quality of the studies in the systematic review
if there is a standardized method used to extract data from studies
included in the systematic reviewif there was clinical heterogeneity assessed to determine whether a meta-
analysis was justifiedif meta-analysis conducted and statistical heterogeneity was assessed
if methods used to report the results of the SR is good
if systematic review inform clinical practice related to my clinical question in a good manner
What are search terms
single word, phrase, question, or voice input that a user enters into a search engine, database, or library catalog to find information
example: critical care, physical therapy, mobilization, exercise, physiotherapy or mobility, mobility
Pedroscore interpretation
High Quality = PEDro Score 6-10
Fair Quality = PEDro Score 4-5
Poor Quality = PEDro Score < = 3
Clinical Test of Heterogeneity
Variability caused by differences in clinical variables
such as the patient population, interventions, outcome
measures or setting of the studies included.
Common Sense Test
Does the pooling/combination of studies make sense?
Patient populations
Interventions
Outcomes
similar → more similar and precision
diff → harder for interpretation and more variable
Vote counting qualitative analysis (and is it GOOD or NOT?)
a simple method that tallies the direction or outcome of multiple independent studies or evaluations rather than pooling their raw statistical effect sizes
NOT good
do not do it b/c studies have different level of precision, variability—meaning that you can NOT say the studies are equal
More about Meta-Analysis
Statistical synthesis of the data from multiple studies that address the same question
Results in a "pooled" result from the combined studies
Generally compares one intervention to another and identifies which was more beneficial
Standardized mean difference/effect size (to know magnitude of significance btw groups in the studies and overall effect sizes)
Relative risk (dichotomous, example of RRisk: mortality)
Data are commonly presented as a Forest Plot

Effect size
number of standard deviations of difference between the means of the control and intervention groups
it is also standardized mean difference (continuous data)
It is Dimensionless
The General classification is
≥ 0.8 = large
> 0.5 = moderate effect
> 0.2 = small effect
< 0.2 = trivial (follows for distance from 0 for negative numbers)
How to calculate Effect size
(mean avg experimental group - mean avg control group) ÷ standard deviation
(mean avg experimental group minus mean avg control group) and all divided by standard deviation

Relative Risk (for dichotomous data)
Compares rate of an event in one group to another
Event example, “disease/no disease” or “dead/alive”
Same general classification as Effect size
≥ 0.8 = large
> 0.5 = moderate effect
> 0.2 = small effect
< 0.2 = trivial (follows for distance from 0 for negative
numbers)
How to calculate Relative Risk (for dichotomous data)
Intervention Event Rule ÷ Control Rate

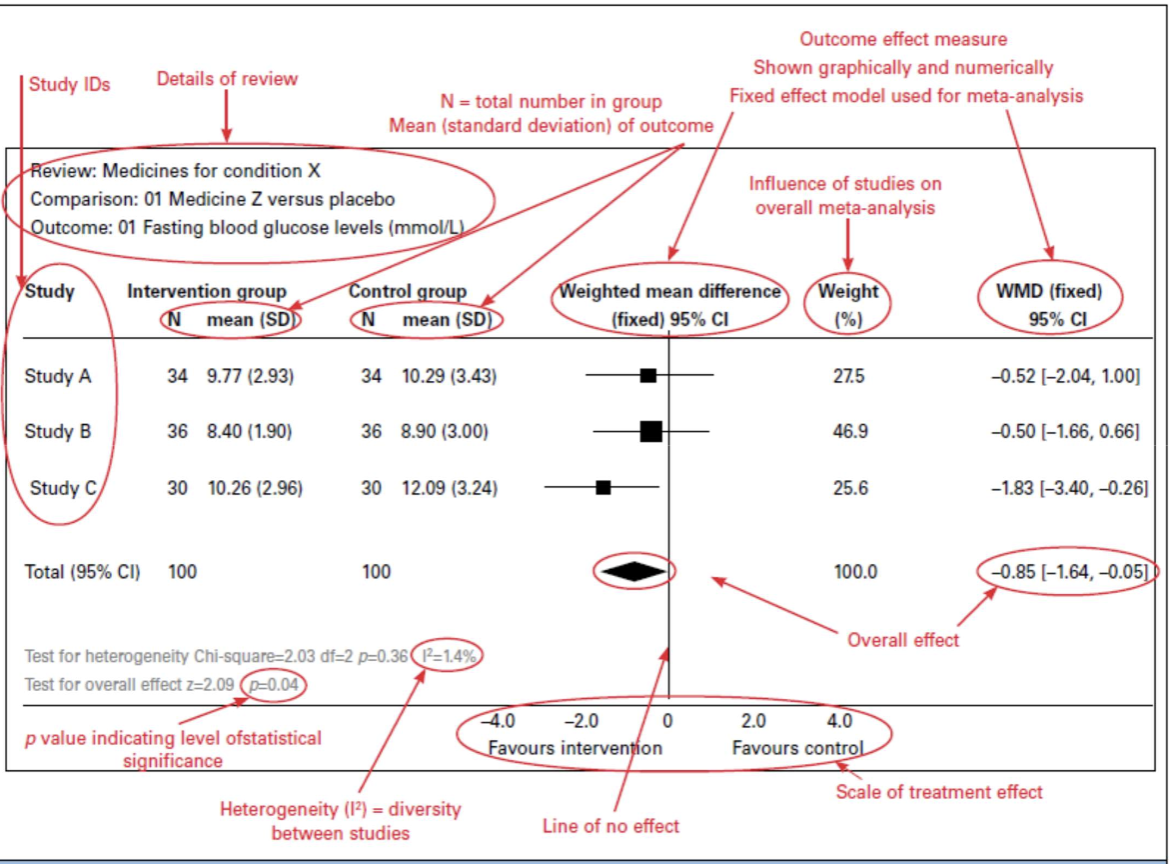
Define the parts of this Meta-analysis of continuous outcome measures
Opaque Squares = groups (effect sizes)
opaque diamond = overal effect
vertical line = line of no effect
horizontal line attaches to both ends of opaque squares = Confidence Interval
Favours control, favours intervention w/ the numbers = scale of treatment effect
What does this mean?
if it crosses line of no effect → NO effect or NO superiority (NOT significant)
Bigger squares, mean some of the studies are weighted differently → larger sample size and narrower confidence interval

Forest plot A (Interpret it)
hedges = effect sizes
lower limit and upper limit = confidence interval
what does it mean?
b/c studies (diamonds) cross over each other it means they are homogenenous
touching line also represents crossing the the line of NO effect
if higher scores are better → interventions are on the right
in this case you want more physical function, quality of life, peripheral muscle strength, respiratory muscle strength, ventilatory-free days

Forest plot B(Interpret it)
lower limit and upper limit = confidence interval
What does it mean?
if lower scores are better → interventions are on the left
in this case, want less length of hospital stay and less length of ICU stay
Muehling et al has biggest effect size b/c farthest from the line of NO effect and big value
Schweickert et al has more weight square and shortest line meaning more higher quality and good effect size and more variable and narrower CI
Pooled effect size for Length of ICU studies → significant and effect size is small

Forest Plot C (Interpret it)
for dichotomous data
lower limit and upper limit = confidence interval
what does it mean?
1 is the line of No effect for dichotomous data due to the ratio of 1 = NO difference
In this data there is NO difference in mortality due to the crosing of the line
lower limit and upper limit = confidence interval
Statistical Test of Heterogeneity
Measures the variability between studies – gives an indication how comparable studies in meta-analysis are.
Q statistic: If p < 0.05 indicates that there may be diversity between
studies that is not due to chanceI² ranges from 0-100%
If I² = < 25%
it means that studies are regarded as homogenous and fixed effect
model of meta-analysis can be use
If I² = > 75%
it means that heterogeneity is very high and a random effects
model for meta-analysis should be used.
Quick visual check to assess homogeneity is to check overlap of the CI’s (horizontal lines or whiskers in the meta-analysis graph). Studies are homogenous if CI’s of all studies __________
Studies are homogenous if CI’s of all studies overlap.
Sensitivity Testing
If heterogeneity is high, a sensitivity analysis (sub-analysis) should be performed
Secondary analysis with "suspect" studies removed
Ex: "suspect" = poor quality
Looking to see if pooled result changes
If pooled result changes, results are less valid
A bigger square means
larger sample size and more precision (b/c the lines that represent Confidence intervals are smaller)
Hohn and Yahr (H & Y) stages
1-5
1 means low disease severity
5 means high disease severity
motor severity range and meaning
20-30, means moderate motor severity
<20-30, means less motor severity
Is 6-12 subjects per group is too small, what is bad about it
small studies,
aren’t the same at baseline
have high standard deviation
do Not have precise confidence intervals
have decreased generalizability
Sureness /power of what percent is good
80% and should include a point difference (clinical)
More than 20% dropout is good or bad for experiment
BAD
3 types of Data
Nominal data:
categories where the order does NOT matter (e.g. red, blue, green)
if only 2 categories = dichotomous (heads or tails)
Ordinal data:
categories where the order matters (example MMT, GROC, NPRS)
NOT consecutive and can NOT be added (ex: pain = 6 is not 3 pain + 3 pain)
Continuous data:
data measured by consecutive numbers that represent equal intervals such as 0 to 100 (ex: time)
can be added: (ex: you can add seconds )
How are the data types commonly reported?
Nominal: proportion
Ordinal (MMT): proportion + range
Continous normally distributed (ROM): mean, SD, range
Continous NOT normally distributed (ROM): mean, interquartile range
95% confidence interval means what?
95% chance that the actual population value falls w/in 2
if we were to do the same experiment 100 times, we will see the same result
Power
Def: probability that study will detect a statistically significant difference btw variables or groups if it exists
The threshold power in most studies: 80%, meaning
80% chance of detecting a diff btw groups if it is really there
20% chance of committing a Type 2 error
This is determined before experience and also determines sample size
it is part of estimation
Type 1 error vs Type 2 error
Type 1 error:
study might find diff btw groups when a diff does NOT exist
Type 2 error:
study might NOT find diff btw groups when a diff does exist
Power is a function of
1) Alpha level
2) Sample size (most dependent on this)
3) Effect size
4) Type of stats test being conducted
5) Type of study design used
When to make alpha small or large
small (like 0.02):
analyzing airplane crashes due to engine failure
want lower probability of making a wrong decision
larger (like 0.10):
analyzing airplane crashes using paper airplanes
want to accept higher risk of making wrong decision
MCID (minimal clinically important difference) aka MID (minimal important difference)
It measures responsiveness, which reflects an outcome measure’s ability to detect change over time
it is the smallest difference in score that is important
represents the minimum # of change that pts perceive as good and that would justify a change in care
If MCID is smaller than MDC
the natural variability of measure hides the ability to detect clinically meaningful change
F-Ratio for variance
Between group variance divided by within group variance
larger the F-ratio, means what?
more likely you will have a p-value that will tell you that you’ll have statistical difference
Between group vs Within group
Btw group variance:
compares separate groups of participants where each group experiences 1 specific condition or treatment
treatment effect
With-in groups/ Error variance:
compares the same group of participants across multiple time points, conditions, or treatments
chance (random error + individual differences)
MDC (Minimal Detectable Change)
smallest amount of change required on an outcome measure to exceed measurement error and variability
it must be observed before being confident that real changed happened and the score change should NOT be linked to measurement error and variability