Stat 100 First Midterm
 Call Kai
 Learn
 Practice Test
 Spaced Repetition
 Match
 Flashcards
 Knowt Play
1/137

There's no tags or description
Looks like no tags are added yet.
138 Terms
statistic definition
numerical measure calculated from sample
parameter definition
numerical measure calculated from whole population
difference in parameter and statistic?
parameter is calculated from the whole population, while the statistic is from a sample data set
the index value(i) means what
where in the data set we start from
n means what in sigma notation? (with the funky looking E)
end of the index
nth percentile means what?
n% of the sample lies below the value and 100-n% of the values lie above it
what does this equation give us? (P/100)(n+1)
index position number
T/F. to find percentiles we do not need to order data.
F, need to order data points
y tilde = what?
50th percentile
the 50th percentile is y tilde which is also known as the _____ or the ____ ____
median or the second quartile
the first quartile is also what percentile?
25th
third quartile is the ___ percentile
75th
mode is the…
most occurring value of y
can a data set have more than one mode?
yes
unimodal =
one mode
bimodal =
2 modes
trimodal =
3 modes
multimodal =
more than 3 modes
IQR is calculated how?
Q3 - Q1
what does the IQR give us?
the middle 50% of the data
sample variance is denoted by
s squared
sample variance is the what?
average squared distance from mean
T/F. We usually interpret sample variance.
F, it is in units squared so not usually interpreted
the denominator the fraction in the equation for sample variance is n-1, why?
to better estimated the population variance; removes bias
sd =
average distance from mean
relative frequency
frequency of event relative to total sample
relative frequency is usually in what numerical form?
decimal from 0 to 1
subject
thing that is what data is being measured on
variable
characteristic of subject that can be assigned number or category
random variable
variable whose outcome is result of random process
Do we know the outcome of a random variable in advance?
no
population
collection of all subjects of interest
sample
subset of population
n
sample size
simple random sample
sample where each subject has equally likely chance of being selected
a random variable, prior to being measured, is usually denoted how?
with a capital letter
observed values are denoted how?
lower case letter
in simple random sampling, the subjects are chosen…
independently of each other; choosing one does not change probability of choosing another
technical definition of srs
every sample of size n is equally likely as any other sample of size n
numeric random variables =
naturally measured as numbers
what are the two kinds of numeric random variables?
discrete and continuous
discrete random variable =
has specific number values
continuous random variable =
can take on any value
categorical random variable =
measured as groups/labels
what are the two kinds of categorical random variables?
nominal and ordinal
nominal random variable =
no natural order
ordinal random variable
has order
bar charts show…
frequency
if the scale of a bar chart is changed, say from percentage to relative frequency, is the interpretation of the graph changed?
no
stacked bar chart
data is grouped and stacked
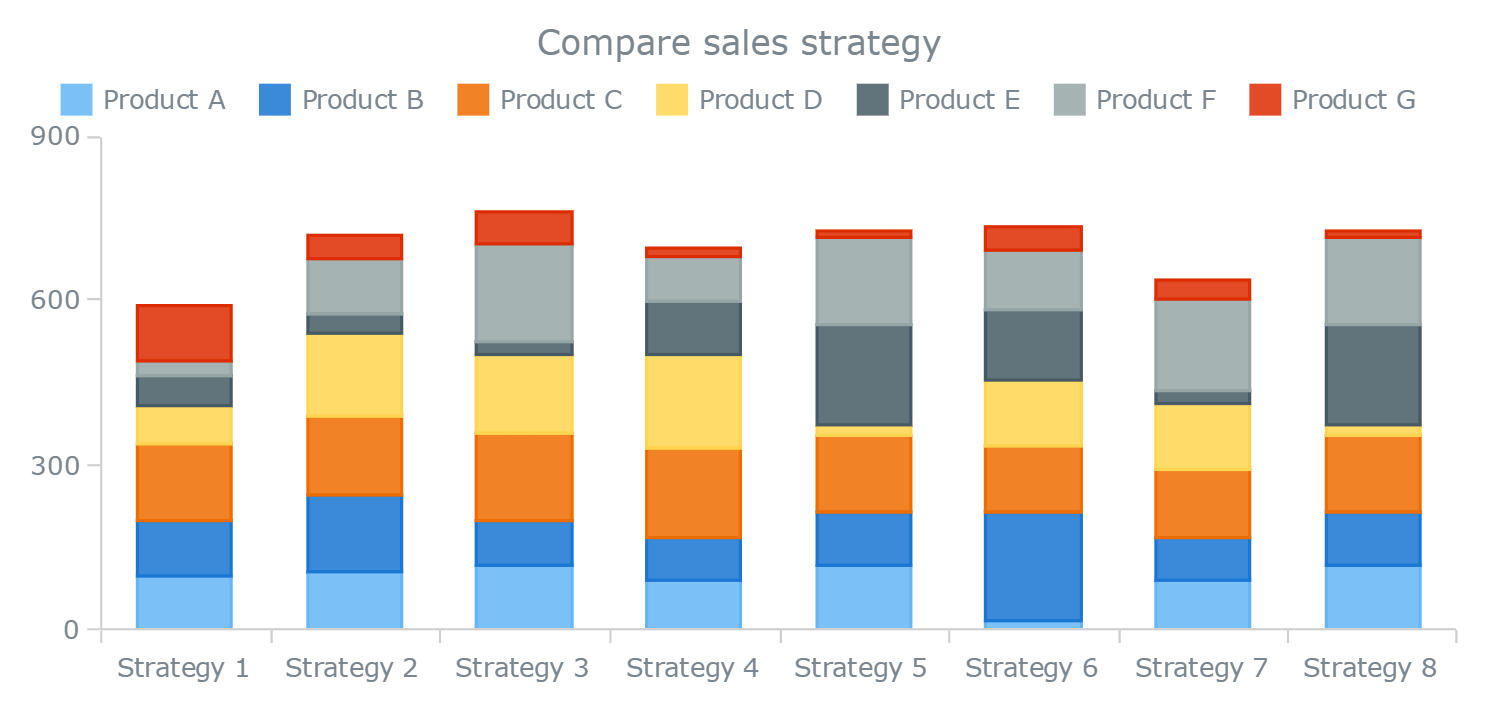
stacked relative frequency plot
data is grouped, stacked, and on adds up to 100 percent

which is easier to interpret, stacked bar chart or stacked relative frequency?
stacked relative frequency since it is proportioned to all add up to 100
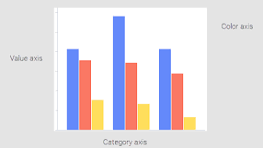
what is this?
side by side bar chart
histogram, data is shown how?
in intervals of equal width
since the values of data in a histogram are put into intervals, are there any gaps between them?
no
the intervals of data in a histogram can be graphed against what kinds of frequencies?
frequency, relative frequency, and percent
whiskers in a box plot show…
max and min values within fences
outliers are…
values outside fences
side by side box plots are good for…
comparing different groups
symmetric data can be seen visually when…
one half of data is the mirror of the other
left skewed data means that the…
left tail is longer

what is this skewed to?
left skewed
right skewed data means that..
the right tail is longer

what is this skewed to?
right skewed
normal dist. is usually seen visually as a…
symmetric bell shape
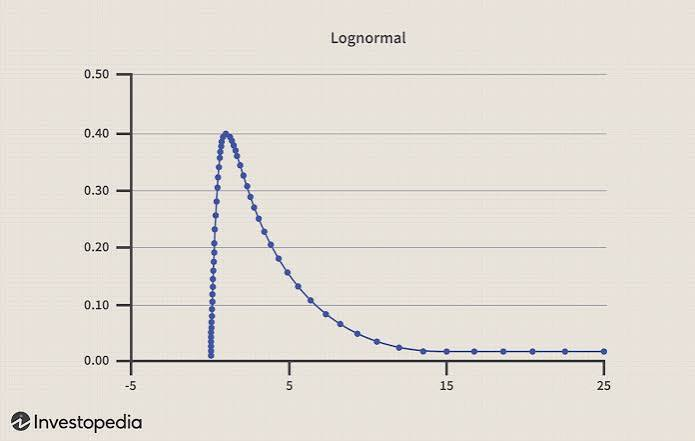
when a graph is right skewed, where are the mean, mode, median relative to each other?
mean is more towards the right where the outliers are. mode is the most left, since it is the most frequent value. median is the middle value, so it is between the mean and mode.
T/F. the mean of a dataset is NOT sensitive to outliers and will not be affected by them.
F, it is sensitive to outliers
is the mode affected by a skew in data?
yes, since it is the most frequent value, it will be affected by this
in a symmetric histogram, Q1, Q2, and Q3 are all _____ distanced from e/o.
equally
in a left skewed histogram, Q2 is closer to…
Q3
in a right skewed histogram, Q2 is closer to…
Q1
statistic = numerical measure of the…
sample
parameter = numerical measure of the…
population
y bar denotes the…
sample mean
s denotes the…
sample sd
p hat denotes the…
sample probability
p denotes the…
population probability
mu denotes the…
population mean
sigma denotes the…
population sd
experiment =
random process where outcome is not known
sample space
all possible outcomes of an experiment
event
a possible outcome
the theoretical probability assumes what two things?
that we know all possible outcomes and possible probabilities
empirical probability is also known as the ____ _____.
relative frequency
theoretical probability describes….
a population
empirical probability/relative frequency describes the probability within…
a sample
empirical probability is based on…
sample
law of large numbers
as sample size gets larger, the probability of event occurring in a sample approaches the theoretical probability of an event
sum of all probabilities for a situation should always equal
1
union of a and b is…
a occurs, b occurs, or both occur
intersection of a and b is…
a and b occur
disjoint/mutually exclusive means…
two events cannot occur at the same time
what is the notation for mutually exclusive?
p(A intersection B ) = 0(0 with cross through it)
independence means that the…
probability of one event does not affect prob of other event
If two events are mutually exclusive, does that mean that they are independent?
no
why, if two events are mutually exclusive, are they dependent?
if one event occurs, then the probability of B occurring within that same time is 0
sensitivity
probability of testing positive given that you have the condition
specificity
probability of testing negative given that you dont have the condition
False negative
individual with condition testing negative
false positive
individual without condition testing positive