Scatterplots and Correlation
 Call Kai
 Learn
Learn Practice Test
 Spaced Repetition
 Match
Match Flashcards
 Knowt Play
1/12

There's no tags or description
Looks like no tags are added yet.
Name | Mastery | Learn | Test | Matching | Spaced | Call with Kai | Chat |
|---|
No analytics yet
Send a link to your students to track their progress
13 Terms
What ist he response and explanatory variable in a scatterplot?
X variable — explanatory = independent
Y variable — response = dependent
How do we interpret a scatterplot?
Characteristics
Form — Overall pattern (linear, exponential, etc…) and outliers
Direction — Positive or negative slope
Strength — How close do the points conform to a line
What is Correlation
Correlation — The strength and direction of the linear relationship between two quantitative variables
— Correlation is a number that lies between -1 and 1
-1 is a negative linear relationship
1 is a positive linear relationship
0 is no correlation — Data that has a pattern but isn’t linear has a correlation of 0
Correlation is a non-resistant
— STRONGLY AFFECTED BY OUTLIERS
How do we solve for the slope of a LSRL?

How do we solve for the y-intercept of LSRL

What is Extrapolation?
Extrapolation — The use of a regression line to make a prediction/inference outside of the interval of values examined.
What is the Coefficient of Determination?
The coefficient of determination describes the proportion of the response variable that is explained by the linear relationship
Coefficient of Determination is calculated by squaring the correlation
— R = r2
What are the residuals of a scatterplot?
The vertical distance between the observed value and the expected value
Residuals = observed - predicted
Interpretation of residuals: What does the prediction say?
Positive — Underestimation
Negative — Overestimation
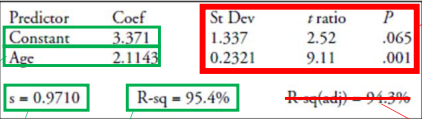
How do we interpret a Computer Output and Standard Deviation of Residuals?

How do we transform a curve if it contains (0,0) and has a slight upward curve?
Take the natural log of both x and y
(x, y) → (ln x, ln y)

How do we transform a curve with a non-zero intercept and appears exponential?
Take the natural log of just y
(x, y) → (x, ln y)

How do we transform a curve if it contains (0, 0) and appears logarithmic?
Take the square root of the x
(x, y) → (√x, y)


How do we transform a curve with a non-zero intercept that appears logarithmic?
Take the natural log of the x value
(x, y) → (ln x , y)