NSCI 270 Content Review
 Call Kai
 Learn
 Practice Test
 Spaced Repetition
 Match
 Flashcards
 Knowt Play
1/47

There's no tags or description
Looks like no tags are added yet.
Name | Mastery | Learn | Test | Matching | Spaced | Call with Kai | Chat |
|---|
No analytics yet
Send a link to your students to track their progress
48 Terms
What is structural MRI? What is the difference between T1 and T2 weighted images, and how is MRI’s resolution (spatial vs. temporal)? What things can be measured using MRI?
Magnetic Resonance Imaging
Structural MRI provides detailed images of brain anatomy using magnetic fields and radio waves (non-invasive)
Static, does not measure brain activity — used to examine brain structure, anatomy, and pathology
Resolution:
Spatial: Very high (sub-millimeter possible)
Temporal: N/A, doesn’t capture time-varying signals
Weighted Images:
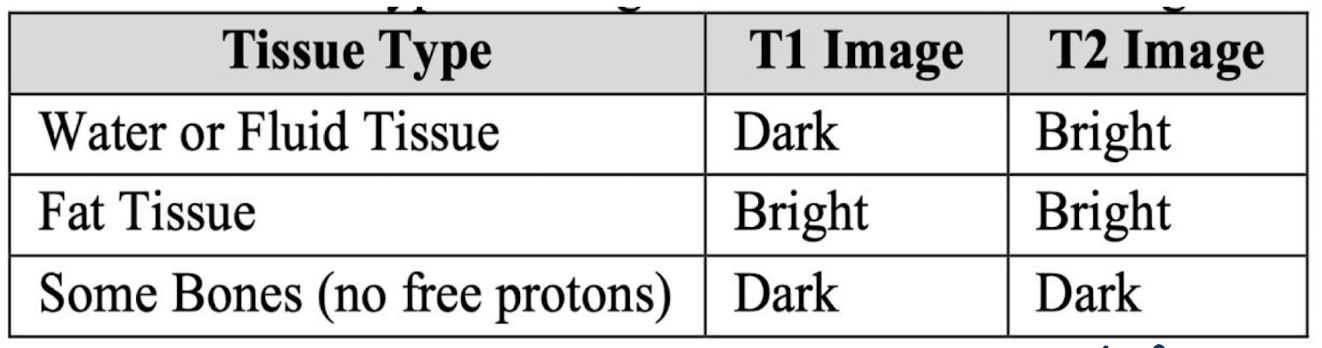
T1: highlight gray vs. white matter
T2: show fluid differences
What is fMRI? How does it work and what does it actually measure? What is it’s resolution (spatial vs. temporal)?
Functional Magnetic Resonance Imaging
How does it work?
Nerve cells communicate with each other in the brain, neurons in active parts of the brain require oxygen to communicate
Hemoglobin is a protein found in blood that transports oxygen to different parts of the body
Signal recorded by the MRI scanner = Blood Oxygen Level-Dependent (BOLD) Signal → reflects changes in blood oxygenation that occur with neural activity
Hemodynamic Response (HDR): Process by which blood flow increases to active brain regions, causing changes in oxygen levels that generate the BOLD signals
Measures brain activity indirectly via BOLD changes, increased blood flow to active areas
Resolution:
Spatial: high (depending on # of voxels, ~ millimeter)
Temporal: low, due to slow HDR
What is DTI? What does it measure? What is its resolution and how can we use it in neuroscience?
Diffusion Tensor Imaging
MRI-based structural connectivity technique that measures how water diffuses in brain tissue, particularly along white matter fibers (myelinated axons)
Resolution:
Spatial: moderate to high, depends on scan parameters (~ 1-2 mm)
Temporal: N/A, static structural measure
Example of use: studying corpus callosum connectivity in multiple sclerosis or mapping major tracts before neurosurgery
What is tractography and how is it modeled with DTI? What measurements are necessary?
Tractography: color-coded brain tractography image showing major white matter pathways
This technique models anisotropy (directional preference of water movement) to map the orientation of fiber tracts
Anisotropy vs. Isotropy:
Anisotropy: Restricted diffusion of water moving along a preferred direction
Isotropy: Random, equal diffusion of water everywhere
Measurements:
Fractional Anisotropy (FA):
Summary measure of microstructural integrity
Directional diffusion of water
Highly sensitive to microstructural changes
Less specific measure: reduction in FA does not indicate with biological process is driving change
[0,1]
Mean Diffusivity (MD):
Inverse measure of the membrane density
Represents the average overall magnitude of water diffusion
Very similar for both gray and white matter, and higher for CSF
MD is sensitive to cellularity, edema, and necrosis
Axial Diffusivity (AD):
Tends to be variable in WM changes and pathology
Measure diffusion parallel (axial) to the main directional vector
AD decreases in axonal injury
The ADs of WM tracts have been reported to increase with brain maturation
Radial Diffusivity (RD):
Increases in white matter with demyelination or dysmyelination
Measure diffusion perpendicular (radial) to the main directional vector
Changes in the axonal diameter or density may influence RD
What is PET and what does it detect? How is it measure and what is its resolution? How may we use it in research?
Positron Emission Tomography
Measures molecular activity by detecting gamma rays from injected radiotracers
Radiotracer: a safe, injectable radioactive chemical the scanner detects — diseased cells absorb large amounts of the radiotracer
Reflects metabolism, receptor binding, protein aggregation, etc.
Resolution:
Spatial: moderate
Temporal: low (minutes) — depends on tracer kinetics
Minimally invasive — requires radiotracer injection but gives molecular specificity you can’t get from fMRI or EEG
Example of usage: mapping hypometabolism in neurodegenerative disorders or using receptor-specific tracers to study psychiatric disorders
What is EEG? What is it’s resolution and how is pertinent neural activity extracted? What’s the difference between wet and dry EEG?
Electroencephalography
Measures electrical activity from the scalp, generated by large populations of neurons
Wet EEG: gel on scalp, placed electrodes
Dry EEG: head set
Signal Measurement:
Event-Related Potential (ERP): derived from EEG data by extracting and averaging the brain responses time-locked to specific events
Averaging process reduced background noise and highlights the neural activity related to the event of interest
Resolution:
Spatial: low (cm), due to signal distortion by skull and scalp
Temporal: extremely high (milliseconds) — great for studying the timing of brain processes
What is MEG? What is it’s resolution and how is it used? What are the pros and cons of it?
Magnetoencephalography
Non-invasive technique detecting tiny magnetic fields generated by synchronized neural currents
Resolution:
Spatial: Better than EEG
Temporal: High (ms)
Usage:
Magnetic fields are less distorted by the skull and scalp than electric potentials → cleaner timing and localization
Requires magnetically shielded room, which is expensive and deeper sources are still harder to detect
Uses: timing of language/memory processes, mapping epileptic foci pre-surgery, studying sensory processing dynamics
Often combined with MRI (for anatomical constraints) or EEG (to leverage complementary strengths)
What are some modalities (beyond neuroimaging) we can use to study the brain?
Electrophysiology:
Invasive recordings (Single-Unit, Local Field Potential, ECoG) offer high temporal and spatial resolution
Capture neural activity from individual neurons to local populations
Used in animals and clinical contexts to study sensory processing, motor planning, and disease
Genetic and Transcriptomic Data:
Provides insights into gene expression across brain regions and cell types
Tools like Allen Brain Atlas help connect molecular biology with brain structure and function
Crucial for understanding developmental trajectories and neurological disorders
Behavioral and Cognitive Data:
Assesses task performance, decision-making, and reaction times
Often used in combination with neurophysiology for integrative brain-behavior analysis
Techniques include eye-tracking, Stroop tasks, and other cognitive paradigms
Why is organization needed in any dataset? What are some common methods used to organize data?
Standardization: ease of interpretation
Modes of Organization
Brain Imaging Data Structure (BIDS) format
Contains folders for each participant, separated by modality and tasks
MRI suffix = nii.gz
OpenNeuro Specific Organization: BIDS format with additional constraints for sharing and validation, includes metadata (acquisition parameters and task information)
NWB: Standardizes how raw signals, stimulus events, and metadata are stored
XCEDE: Older format for metadata
COINS: Database system for multi-site studies
DataLad: Data management tools for large datasets
HDF5-Based Formats: Hierarchal data format for large datasets
Why does open science matter?
Reproducibility: Allow other researchers to validate findings by repeating analyses
Reduces errors, builds confidence in results
Collaboration: Fosters collaboration across labs, disciplines, and countries
Accelerates discovery and enables interdisciplinary work
Transparency: Lets everyone see exactly how conclusions were drawn, combatting questionable research practices and promoting ethical science
Accessibility/Equity: Lowers barriers for researchers laving funding for expensive data collection
Democratizes research and fosters diversity in ideas and approaches
Reuse/Efficiency: Allows researchers to ask new questions without costly or time-consuming data collection
Maximizes the scientific value of data, saves resources, and speeds up innovation
Real-World Impact: Allows for large-scale projects like the Human Connectome Project and Open Neuro
Encourage open practices and prepare students to contribute to research
What is Metadata?
Provides important information that describes, explains, or gives context to the main data you are working with
Helps researchers understand, interpret, and properly use the data
Makes sharing and reusing datasets possible because others can know exactly what the data represents and how it was collected
Ex:
When/how MRI scans were collected (scanner type and settings)
Participant info (age, gender, clinical diagnosis)
Experimental conditions or task descriptions
File formats and data organization details
What are some pros and cons with using existing data, as opposed to collecting new data?
Using existing open access data sources:
Pros:
Fast and efficient
Can build off existing work
Transparency and replicability
Cons:
Data collection practices may be unethical or irresponsible
May not directly answer question
Collecting new data in a lab:
Pros:
Can best align data with question
Can ensure ethical and responsible data collection practices
Cons:
Can be resource-intensive (costly/time-consuming)
Requires considerable expertise
What is Big Data? How is it described by leaders in the field? What techniques are required for its analysis? How is it evolving in our field?
Observational study data, large datasets, technology-generated outcomes
Machine-learning algorithms
Extremely large datasets to be analyzed computationally to reveal patterns, trends, and associations
Application of mathematical techniques to large datasets to infer probabilities for prediction and find novel techniques
Require specific technologies and analytical methods
High volume, velocity, and variety
Large, more varied, and complex structure with challenges in storing, analyzing, and visualizing it
More availability of data, new technologies to collect data
What are three types of data we have in neuroscience?
Cross Sectional: Collects data from a specific group of individuals at a single point in time
Static (snapshot)
Multiple subjects at one time point
Identifying differences between groups
Limitation: cannot track changes over time
Longitudinal: Collects data from the same group of subjects over an extended period of time
Same group of people, tracking progression
Limitations: Very large, complex data sets
Multimodel: Integrates different types of observations or imaging (ex: neuroimaging, ultrasound, etc.)
What are the 5 V’s of Big Data? What are some opportunities and challenges that each present?
Volume
Scale enables discovery (rare event detection, multi-cohort/site data)
Challenges: Storage and processing
High-volume data leads to significant costs, which requires careful forecasting of data growth and computational needs (budget planning)
May need institutional support ($$) and high-capacity clouds
Collaboration and shared resources can mitigate costs
Velocity
Real-time neuroscience (rapid data acquisition)
Challenges: Computational complexity
More data = harder to clean (removing data - inherently losing signal)
Variety
Multi-model insight
Challenges: Computational complexity
High dimensionality problems
Many modes of imaging data → more complex analysis
Veracity
Trusted data from reliable science
Challenges: Cleaning and pre-processing
Inconsistent data can bias our results and lead to misinterpretation
Data harmonization between projects
Common templates (like the MNI) can align data from a particular voxel/time-series
Value
Impact (important, clinically applicable research)
Challenges: Reproducible science
Allows for new abilities in psychiatry, use of AI-supported predictive modeling
Ex: Diagnostic models, prognostic models and disease progression measurements, patient stratification
What is preprocessing and why is it necessary? What does it do?
Pre-Processing: Series of automated and manual steps used to clean, correct, and standardize raw brain data before running statistical analysis or creating maps of brain function
Why?
Raw data from scanners/sensory is noisy and highly dimensional (1000-millions of measurements per subject)
Data is always contaminated by scanner instability, physical flaws and head movements
Ex: magnetic/electrical interference, scanner drift, head movements, etc.
What does preprocessing do?
Removes noise — eliminates scanner instability, thermal static, and environmental interference
Corrects artifacts — fixes image distortions caused by body physiology (heartbeats, breathing) and patient movement
Standardizes space — aligns individual brain scans to a universal anatomical template (MNI/Talarich) so data can be compared across groups (data harmonization)
Pre-processing improves signal-to-noise ratio (SNR), measuring the physiological/metabolic brain signal relative to the unwanted background fluctuations, determining the clarity and reliability of the data
Ensures comparability between subjects and meaningful statistical analysis
What are some common artifacts and what are their impacts on data? How are movement artifacts mitigated?
Movement Artifacts:
Blurring: Movement spreads signals across pixels, reducing spatial resolution and clarity
Ghosting: Displaced data creates faint, repeated “shadow” images across the scan matrix
Ring: Sudden jerks cause bright concentric ripples around brain boundaries
Cardiac Pulsation: Leads to periodic ghosting streaks or focal blur around major blood vessels, the brainstem, and ventricles
Breathing: Impacts global brain activity
In EEG specifically: Eye blinks, respiration, lateral eye movement, and jaw clenching
Equipment Drift and Environmental Interference: Gradual signal change over time (scanner drift), power line interference
Impacts:
False Connectivity: Can falsely look like neural synchronization
Motion-Related False Positive Activation: Signal in a region interpreted as a response to a task, but may be related to physiology (ex: vascular/CSF/cardiac pulsations, eye motion)
Corrected by algorithms post-imaging and by physical head restraints/real-time prospective motion correction during imaging
What are the 3 core goals of pre-processing?
Standardization/Normalization: Harmonizes the scanner hardware and imaging protocols/Mathematically rescales the resulting data’s spatial dimensions and pixel intensities for consistent analysis
Denoising: Suppresses physiological and scanner artifacts to reveal the true underlying neural signal
Feature Extraction: Converts raw structural and functional neuroimaging data into quantifiable biomarkers for statistical and clinical analysis
Ex: cortical thickness, tract density, functional connectivity metrics
Pull out areas of interest
What are the differences between data normalization, transformation, and standardization in pre-processing?
Data Normalization: Ensuring features are on a consistent scale across subjects and measurements
Rescale data to a fixed range
Adjust voxel intensities and sensory readings to a shared scale (ex: 0 to 1, z-scores, or %s)
This enables signals to be compared accurately across different tasks and subjects
Spatial normalization warps uniquely shaped brains onto a standardized 3D template to ensure anatomical structures along across everyone in a study (common reference space)
Data Transformation: Mathematically adjusting raw data to meet statistical assumptions for reliable group analyses
Reduces skewness, stabilizes variance, and improves the validity of downstream statistical tests or models
Data Standardization: Transforms data so it’s in the same numerical space (ex: mean = 0, standard deviation = 1)
Allows for group-level comparisons
How are outliers detected/is quality controlled in neuroimaging?
Removing outliers → removing bias and data skew
Ensures data is accurate, reliable, and free from major artifacts or errors
Identification of substantial deviations:
Visual Inspection (gold standard) — manual removal
Statistical Methods:
Feature extraction
Thresholds, z-scores > 5
Outliers flagged
Machine Learning Approaches:
Isolation forest algorithm detects abnormal connectivity and patterns deviating from cohort distribution → abnormality score
Things to check for in QC:
DTI: Motion artifacts, signal dropout, distortions
MRI: Image quality, contrast, coverage
fMRI: Head motion, low SNR, ghosting
EEG: Noisy/flat channels, muscle/eye-blink artifacts, amplifier saturation, power spectrum consistency, correlation across electrodes
What is dimensionality? Why do we need to do dimensionality reduction?
Dimensionality:
Refers to the number of data points that make up a single brain scan
1 scan: > 100k to 1 million voxels
Dimensionality Reduction:
Re-representing massive, multi-dimensional brain data (complex 3D data sets)
Into a lower-dimensional space
Has fewer features
Still preserves most critical, meaningful structural or functional properties
Why?
Beat the curse of dimensionality — reduction in the number of features prevents overfitting (finding trends that aren’t there)
Fixes multiple comparisons — minimizes false positives (Type I Error), reduces the # of independent statistical tests used
Eliminates spatial redundancy — resolves collinearity by compressing correlated neighboring voxels into a single unified network signal
Boosts computational speed
What are some common dimensionality reduction techniques?
Region of Interest (ROI) Analysis:
Instead of analyzing 1,000,000 individual brain voxels, researchers use an anatomical atlas to segment the brain into 100 or 200 distinct regions
The voxels within each region are averaged together, instantly shrinking the dataset’s dimensions by several orders of magnitude
Principal Component Analysis (PCA):
A mathematical approach that finds orthogonal (uncorrelated) linear combinations of voxels that explain the maximum amount variance across the subjects
It condenses the entire brain’s variance into a handful of principal components
Independent Component Analysis (ICA):
Widely used in functional (MRI), ICA separates a massive, mixed spatiotemporal dataset into distinct, independent brain networks
Turns thousands of voxel time-courses into a few meaningful network signals
Compare and contrast PCA and ICA in terms of goal, components, focus, use case, and assumptions.
PCA (components that explain the most variance):
Goal: Reduce dimensionality while preserving maximum variance
Components: Orthogonal (uncorrelated)
Focus: Captures variance in the data
Use Case: Noise reduction, feature compression, identifying major patterns (Dimensionality reduction, visualization)
Assumption: Data can be represented by uncorrelated components (linear combination)
ICA (components that are statistically independent even if variance is small):
Goal: Separate mixed signals into statistically independent sources
Components: Statistically independent (not necessary orthogonal)
Focus: Captures independent signals in the data
Use Case: Artifact removal, source/signal separation, identifying functional networks
Assumption: Observed signals are linear mixtures of independent sources (Linear combinations, non-Gaussian sources)
What is feature extraction and why is it important? How do you choose a feature?
Feature Extraction: Process of transforming raw neuroimaging data, often high-dimensional and noisy, into meaningful summary measures that can be used for analysis, modeling, or ML
Extracted features summarize key patterns, and making downstream statistical or ML analyses feasible and interpretable
Neuroimaging produces enormous, noisy arrays (voxels x time for fMRI, channels x time for EEG/MEG)
Directly feeding raw arrays into statistical tests or ML models is feasible because of:
Computational cost and storage
High-dimensional → overfitting with limited subjects
Noise and artifact sensitivity (motion, physiological artifacts, eye blinks)
Difficult interpretability of model weights in raw space
Feature extraction compresses the signal into smaller sets of interpretable, task-relevant summaries (ex: time-series, band powers, connectivity edges, spatial maps) so models are faster, more robust, and results are more interpretable
What is feature selection and what are some methods we can use?
Filter Methods: Sort and select features using quick statistical tests before any machine learning begins
Instantly screen out millions of useless background brain voxels to save computing power
Select features based on statistics (independence of model)
Pros: Fast, simple
Cons: Ignores feature interactions
Role of ML: None
How it works: Scores each brain region individually and drops low scores
Key Examples: ANOVA, correlation, t-tests
Main Advantage: Extremely fast, handles massive voxel data instantly
Wrapper Methods: Use trial-and-error to test different combinations of features directly inside the AI model
Excellent for detecting how different brain regions interact together as complex functional networks
Use a predictive model to evaluate feature subsets
Pros: Considers interactions, can be highly predictive
Cons: Computationally intensive
Role of ML: Used as an external judge to grade feature combinations
How it works: Trains the model repeatedly using trial-and-error subsets
Key Examples: Recursive Feature Elimination (RFE) with classifier feedback
Main Advantage: Tests how different brain regions interact together
Embedded Methods:
Automatically choose the most important features while the AI model is actively training
Naturally reward key brain networks and ignore noise during learning, balancing speed and accuracy
Happens during model training via regularization
Pros: Efficient, integrates selection with modeling
Cons: Requires parameter tuning
Role of ML: Built directly into the training algorithm itself
How it works: Trains the model exactly once, picking features automatically
Key Examples: LASSO, ElasticNet regression
Main Advantage: Very efficient and highly resistant to overfitting
What is Multi-Modal Feature Integration? What information can be obtained from different modalities?
Complementary information: Different modalities capture distinct aspects of the brain
fMRI: Functional connectivity, network dynamics
DTI: Water matter integrity and tract-specific metrics
Structural MRI: Cortical thickness, gray matter volumes
EEG: Oscillatory activity and temporal dynamics
PET: Molecular and metabolic activity
Enhanced prediction: Combining features can improve accuracy in classification, disease detection, or cognitive outcome prediction
Biomarker discovery: Multi-modal integration helps identify robust, multimodal biomarkers that may be more sensitive and specific than single-modality features
What are the key steps of Multi-Modal Feature Integration?
Feature extraction per modality: Compute modality-specific features (ex: fMRI connectivity matrix, DTI FA, PET SUVR)
Dimensionality Reduction: Apply PCA, ICA, or other methods to reduce feature dimensionality within each modality — prevents model overload and overfitting due to high-dim data
Normalization/Scaling: Bring all features onto comparable scales
Feature Integration: Concatenate or fuse reduced feature sets into a single multiple-modal dataset
Analysis/Modeling: Apply ML or statistical modeling for prediction, classification, or biomarker discovery
Why do we visualize data, and how do we decide how to visualize? What dimensions does neuroscience data have?
Why? — Answering research question in a clear and simple manner
Question dictates type of visualization
Dimensions:
Time — When does activity happen?
Space — Where does activity occur?
Participants — How do people differ?
Connections — Which regions are related?
Frequency — What rhythms are present?
Condition — Control vs. patient, task A vs. B
Timepoint — Baseline vs. follow-up
What is being visualized in EEG? What are some key visualization questions we have? What are the 5 frequency broad bands in EEG?
EEG measures: electrical potential, measured at electrodes with very high temporal resolution (=/= individual neurons)
Key Visualization Questions:
When did activity occur?
What does the signal look like?
Where on the scalp did it occur?
What frequencies are present?
Frequency Broad Bands:
Delta (0.3-4 Hz): Dreamless sleep, subconscious, loss of bodily awareness
Theta (4-8 Hz): Inner peace, REM sleep, deep meditation
Alpha (8-13 Hz): Creativity, flow state, focus
Beta (13-30 Hz): Concentration, arousal, alertness
Gamma (30 Hz +): Multi-processing
What are some common visualizations used in EEG? What are FFS, PSD, and wavelet?
Visualizations:
Topographic Maps:
A 2D representation of EEG activity across the scalp
Each electrode has a location
Color represents voltage/activity (intensity)
Used when visualizing spatial distribution of EEG activity, event-related potentials, frequency band power, differences between conditions, changes over time (not a time-series), etc.
Time-Series Visualization:
Wave form visualization
Oscillations: Repeated peaks and troughs
Amplitude: How large are the fluctuations?
Frequency: How quickly does the signal oscillate → brain state
Artifacts: Large or unusual changes may arise from eye blinks, muscle activity, movement, and electrical interference
Multiple time-series → superimposing several different channels (comparative view)
Average Signal/Variability:
Overall activity across the brain → mean
Is variation resulting as a result of an event or is it an outlier → use standard deviation
Group Comparisons
Frequency Visualization:
Time domain: what happens over time? Freq. domain: what frequencies make up the signal? Freq. spectrum: can show peaks
Fourier Frequency Spectrum (FFS): Shows the individual frequency components (amplitude and phase) that make up a signal
Power Spectral Density (PSD): Shows how the total power of a signal is distributed across those frequencies
Wavelet: Maps how brainwave frequencies change over time
What does fMRI visualize?
BOLD signal (=/= direct measurement of neural firing)
High spatial resolution
Relatively slow temporal dynamics
Data is inherently 3D + time
Key Question: Where in the brain is the signal changing?
What is correlation? How are correlation heat maps used?
Correlation asks: Do two variables tend to change together?
Correlation DOES NOT TELL US that one variable causes the other (Correlation =/= Causation) — requires stats to back it up
Correlation Coefficient:
Used to find how strong a relationship is between data
Value between -1 and 1
1 indicates a strong positive relationship
-1 indicates a strong negative relationship
0 indicate no relationship at all
Correlation Heat Maps:
A heatmap represents numbers using color → instead of looking at hundreds of individual lines, we can see many patterns across many measurements simultaneously
EEG: rows → channels, columns → time, color → voltage
fMRI: rows → participants, columns → voxels/regions, color → activation
DTI: rows → participants, columns → connections, color → connectivity strength
How to read a heatmap:
Read the axes — what does each row/column represent?
Read the colorbar — what does dark/light or blue/red mean?
Look for patterns — horizontal patterns, vertical patterns, blocks/clusters and isolated extreme values
Biological meaning — do several channels show a similar pattern at the same time? (synchrony/correlation)
What are some common visualizations used with fMRI?
Brain Networks:
Correlation networks
A network is only as meaningful as the definition of the nodes. edges, and threshold
Lower threshold = more edges = potentially more noise
Higher threshold = fewer edges = potentially hides meaningful relationships
Changing the threshold changes the network
Adjust threshold based on literature
Node: A brain region or channel (EEG electrode, fMRI region, DTI brain region)
Edge: A relationship between two nodes
Edge weight: A relationship between two nodes
Hub: A highly connected node
Brain Maps/fMRI Slice Montage:
A brain map shows where an effect occurs
Typical visualization: anatomical brain image, statistical/activation overlay, color represents the direction or magnitude of the effect
Important questions: Which anatomical region? Which direction? How strong is the effect? What statistically threshold was used? What comparison produced the map?
What are we visualizing in DTI? How is directionality displayed in DTI?
Measures the directionality of water diffusion
Used to estimate: White matter organization, fiber orientation, structural connectivity, tract integrity and properties
Key Question: How is white matter organized and connected?
Directionality:
Depending on the visualization: color can encode diffusion direction, brightness can encode diffusion properties
Color is an encoding of a variable
What does DTI tractography represent?
Lines represent estimated white-matter pathways
ESTIMATED using mathematical properties
Based on diffusion measurements (diffusion properties of water)
They are not photographs of individual axons
What are some common ways to visualize data distributions? Why do we visualize outliers?
Boxplot (box and whiskers):
Middle Line: Median
Box: Middle 50% of observations
Whiskers: Spread according to the plotting convention
Points beyond whiskers: Potential outlier
Scatterplots:
Are two variables related?
Upwards/downwards trends, obvious relationships or outliers, different groups
Histograms:
Visualizes data distributions using discrete, blocky bars grouped into intervals (bins)
Density Plot: Uses Kernel Density Estimation (KDE) to smooth those points into a continuous, fluid probability curve — estimate the shape of distribution
Violin Plots
Clustering/Dendrograms:
Clustering group observations based on similarity
Tree-like visualization showing how observations are progressively grouped
Outlier Visualization:
Outlier: Observation that is unusually different from the rest of the dataset
Causes: Measurement error, artifact, data-entry problem, unusual participant, genuine biological variation
Not automatically bad data — but do we choose to keep or neglect?
How do we compare measurements longitudinally?
Longitudinal Visualization: Comparing measurements at different time points
Baseline → follow-up, before → after treatment, younger → older, task A → B
Visualization options
Connected dot plots
Line plots
Mean ± error
Change/delta plots
Change heat maps
Delta = Follow-up - Baseline
Positive = value increased
Negative = value decreased
0 = No change
Makes patterns more noticeable (participant/connection changes, consistency, outliers)
What is a Scree Plot and a Cumulative Variance Plot?
Scree plot: shows how much variance each PCA component explains
PC1 explains the most variance, PC2 explains the next largest, etc.
Elbow: Point where adding more components explain progressively smaller amounts of variance

What are normality and variance and why are they important? How are parametric and non-parametric tests different?
Normality: Whether the data are approximately normally distributed
Variance: How much the data vary within each group (groups have similar variance = equal variance)
Violations of normality or unequal variance can affect statistical interference, so they should be checked when choosing and evaluating an appropriate model
Parametric vs. Non-Parametric:
Parametric tests assume data is normality distributed (bell-shaped) and variances are roughly equal across groups
Non-parametric tests make fewer assumptions and are safer when assumptions are violated
What are features and labels? What is the difference between labeled and. unlabeled data?
Data = information organized in rows and columns
Each row = one observation
Each column = a feature that describes the data
The label = the feature we want to predict
Labeled data: specifically named inputs and outputs
Unlabeled data: not distinctly labelled (may be used to find patterns)
Labels can represent numbers or categories/classes

What are the four types of machine learning?
Supervised: The algorithm learns to make predictions or decisions based on labeled data with input-output pairs, and the goal is to minimize the error between predicted and actual outputs
Unsupervised: The algorithm learns to identify patterns and relationships in unlabeled data, with the goal of discovering hidden structure and using it to make predictions or decisions
Reinforcement: The agent learns to make decisions based on feedback received from the environment in the form of rewards or punishments, with the goal of maximizing cumulative reward over time
Semi-supervised: The algorithm learns from a combination of labeled and unlabeled data, which can improve accuracy and reduce the need for labeled data
How does supervised machine learning work? What models can predict labels?
The algorithm learns from labeled data which includes both inputs (features) and outputs (labels)
The goal is to learn a mapping function that connects inputs to outputs by minimizing the error between predicted and actual labels
Models learn from examples so it can predict the label of new, unseen data
Steps:
The model first remembers the dataset
The model formulates a model or a rule
When a new image comes in, the model makes a prediction about what the label of the new image is
Regression and Classification Models:
Regression Models: Predict a number (continuous output which can take any value within a range)
Classification Models: Predict a category or state, handling more than two classes (multi-class classification)
How does unsupervised machine learning work? What are some common algorithms they employ and tasks they complete?
Algorithm learns from unlabeled data (only features, no labels) with the goal of discovering hidden patterns or structure
Algorithms:
K-means: Groups points around random centers, adjusts iteratively
Ex: Segment voxels in fMRI data into regions with similar activation patterns
Hierarchical: Groups closest points first, builds a tree/cluster step by step
Ex: Build a hierarchy of brain regions based on connectivity strength
DBSCAN: Groups dense areas, ignores isolated points as noise/sparse points
Ex: Detects clusters of high activity fMRI while ignoring noisy voxels
Gaussian Mixture: Assigns probabilities of belonging to multiple clusters
Ex: Identify overlapping functional networks where a voxel may belong partially to multiple networks
Tasks:
Clustering: grouping similar data points
Grouping data based on similarity
Algorithm learns relationship
Dimensionality Reduction: simplifying data while keeping essential information
Simplifying our data and describing it with fewer features without losing much generality
Preprocessing data: for supervised learning
How does reinforcement machine learning work?
The agent has a goal or set of goals
Using this type of machine learning, the agent learns to make decisions based on the feedback (rewards or punishments) it receives from its environment
The goal is to learn a policy that maximizes the cumulative reward over time
There is no labeled dataset, the agent learns by trial and error
What are training and testing datasets? What is overfitting and how can we prevent it?
Data is usually split (~70-80% training, ~20-30% testing) to ensure the model generalizes well, not just memorizing the training data
Training data: Used to teach the model, the algorithm learns patterns and relationships from this data
Algorithm studies the hidden patterns and insights from observations and learns from them
Testing data: Used to evaluate the models performance on unseen data
Should not contain any training dataset data
Predict unknown results
Checks the performance, accuracy, and precision of the model
Overfitting:
Model learns the training data too well, including the noise
Failure to generalize beyond what it’s seen
Performs very well on training data, but poorly on new data
Prevention:
Use a validation dataset during training
Apply cross-validation techniques
Simplify the model or gather more data
What is validation data? What are some basic techniques for splitting training data?
Validation data: A subset of training data used to tune/optimize the model (adjust parameters, choose features, prevent overfitting)
Techniques:
Holdout Method: Dataset split once into separate training, validation, and testing sets to evaluate model performance on unseen data
Random Sampling: Data is shuffled and split into training/validation/test sets based on a user-defined ratio (defined in literature)
Works best on balanced datasets, may create bias if imbalanced
Stratified Sampling: Ensures each split preserves the class distribution of the dataset
Ideal for imbalanced datasets to maintain representative samples
What is K-Folds cross-validation? What is Leave-One-Out Cross Validation?
K-Folds Cross Validation:
Dataset is split into K equal-sized folds (subsets)
One-fold is used for validation, and the remaining K-1 folds are used for training — the process repeats K times, each fold serves once as the validation set
Validation accuracy is recorded for each round
Final model accuracy = average
Common choice: K = 10 (balances bias and variance)
More representative of the dataset
Leave-One-Out Cross Validation:
Algorithm loops n times for n total data points, with one data point being reserved to test the model
Final score = errors from all n tests averaged together
Pros: low bias, same result every time
Cons: high computational demand (time and money)
How are Machine Learning models evaluated using accuracy and confusion matrices?
Accuracy: Measures the proportion of correctly predicted samples (# correct/total predictions)
Confusion Matrix: Table showing how well the model performs across classes
Rows = actual classes, columns = predicted classes
Identifies types of errors
Derived Metrics from Confusion Matrix:
Precision = TP / (TP + FP) — out of all predicted positives, how many were actually positive?
Recall/Sensitivity = TP / (TP + FN) — out of all actual positives, how many did the model correctly find?
F1-Score = 2 (precision x recall) / (precision + recall) — harmonic mean of precision and recall
