bio stats ch 11
 Call Kai
 Learn
 Practice Test
 Spaced Repetition
 Match
 Flashcards
 Knowt Play
1/14

There's no tags or description
Looks like no tags are added yet.
15 Terms
Sampling distribution of the mean
Instead of looking at the values of individual observations, we look at the average of each sample
Steps conceptually:
• Take a sample from the population.
• Calculate the sample mean.
• Repeat this many times.
• Plot all those sample means.
• The result is the distribution of sample means.

Important properties
• The mean of this distribution equals the population mean (μ).
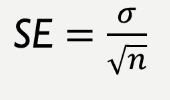
• The standard deviation is called the standard error:
Example of sampling distribution of the mean
Suppose a population has heights.
• You take many samples of n = 30 people:
• Sample 1 → mean = 170 cm
• Sample 2 → mean = 168 cm
• Sample 3 → mean = 172 cm
• Sample 4 → mean = 169 cm
• If you plot all these means, you get the distribution of sample means.
Distribution of sample means additional equations
Recall that Y has a sampling distribution that is normal
Z standardization for distribution of sample means:

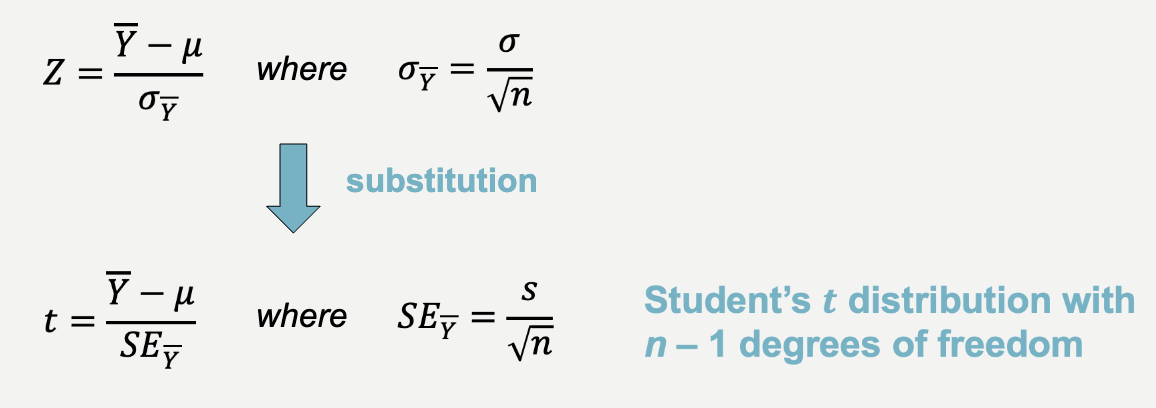
Similar formula but we are working with standard error now
Distribution changes based on sample size
Good for small sample size
Normal distribution good for large sample size (inc in sample size makes it narrower)
This allows you to use t values and get accurate conclusions based on small sample size
Student’s t distribution (Gosset)
Useful conclusions from small-scale studies
made statistics a useful way for Guinness to increase its profits
tell which products were better based on a few samples
didn’t want other companies to steal it so he had to publish it anonymously

similar to standard normal distribution (Z) but with fatter tails
the t-distribution here has df=4
as the sample size increases the t distribution becomes more like the standard normal distribution

always work with 2-sided
as critical value like Z
get values with table


Assumptions of one-sample t test
Data are a random sample from the population
Variable is normally distributed in the population
Few variables in biology are exact match to normality
But in many cases the test is robust to departures from normality (more on this later)
When to use Z or T test
Use a Z-test when:
✔ The population standard deviation (σ) is known
✔ Sample size is usually large (n ≥ 30) (not strictly required if σ is known)
✔Data is approximately normal (or large n → CLT helps)
central limit theorem
Use a One-sample t-test when:
✔The population standard deviation (σ) is unknown
✔You use the sample standard deviation (s) instead
✔Especially important when n is small (< 30)
Why t instead of z?
Because when you don’t know σ, there is extra uncertainty, and the t distribution accounts for that (wider tails).
can use the t-distribution to accurately calculate a confidence interval for the mean of a population with a normal distribution
Example: Stalk-eyed flies

1) what is the confidence interval?

if mean is inside confidence interval you know the CI is right
df = 8

Example

1) Value from the table
2) Standard error
3) CI
4) Is the mean inside the confidence interval?

df = 5
2) SE

3) CI

4) Yes
Example
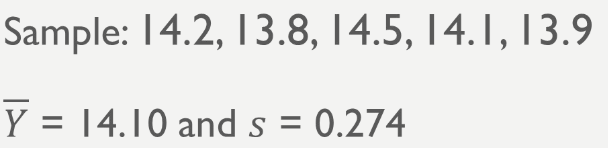
1) Value from the table
2) Standard error
3) CI
4) Is the mean inside the confidence interval?
1) Df = 4

2) SE

3) CI

Example
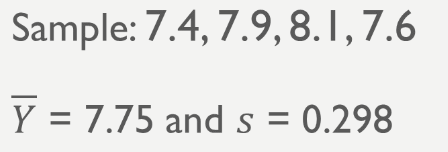
1) Value from the table
2) Standard error
3) CI
4) Is the mean inside the confidence interval?
df = 3

2)

3)

One sample T-test
the one sample t-test compares the mean of a random sample from a normal population with the population mean proposed in a null hypothesis

compute p-value: probability of this t-statistic (or more extreme) given the null hypothesis (u=98.6) is true


even with t test as sample size increases your data is more certain and you can have more certainty

Example: Human body temp
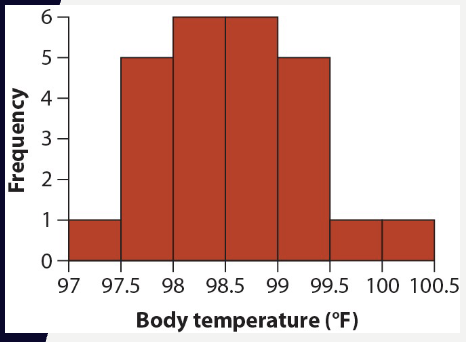
normal: 98.6 degrees F
is this really normal?
Sample of 25 healthy people
One sample t-test
H0: mean body temp = 98.6
HA: mean body temp does not equal 98.6
1) Standard error
2) t and Df
3)P-value —> H0
4) How much uncertainty is there in our estimate of u
1)
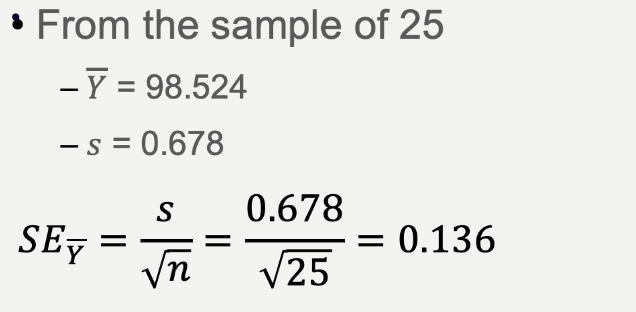
2)


3) compute p-value: probability of this t-statistic (or more extreme) given the null hypothesis (u=98.6) is true


Fail to reject the null hypothesis because the t-value is inside the confidence interval range
So the data is consistent with the true H0
4)

Example: Sleep duration
Recommended sleep duration = 8 hours
Is this really the case?
A researcher collects a sample of 20 college students and records the number of hours they sleep per night.
One-sample t-test
H0: mean sleep duration = 8 hours
HA: mean sleep duration ≠ 8 hours
1) Standard error
2) t and Df
3)P-value —> H0
4) How much uncertainty is there in our estimate of u (CI)
1)

2)


3)
Decision rule: Reject H0 if ∣t∣ > 2.09:
Since 3.51>2.09
The test statistic falls outside the 95% central region. Because the statistic falls in the rejection region, we reject H0.
Interpretation:
There is statistically significant evidence that the average sleep duration of college students is different from 8 hours
4)

because 8 hours is not contained in the 95% CI we reject H0
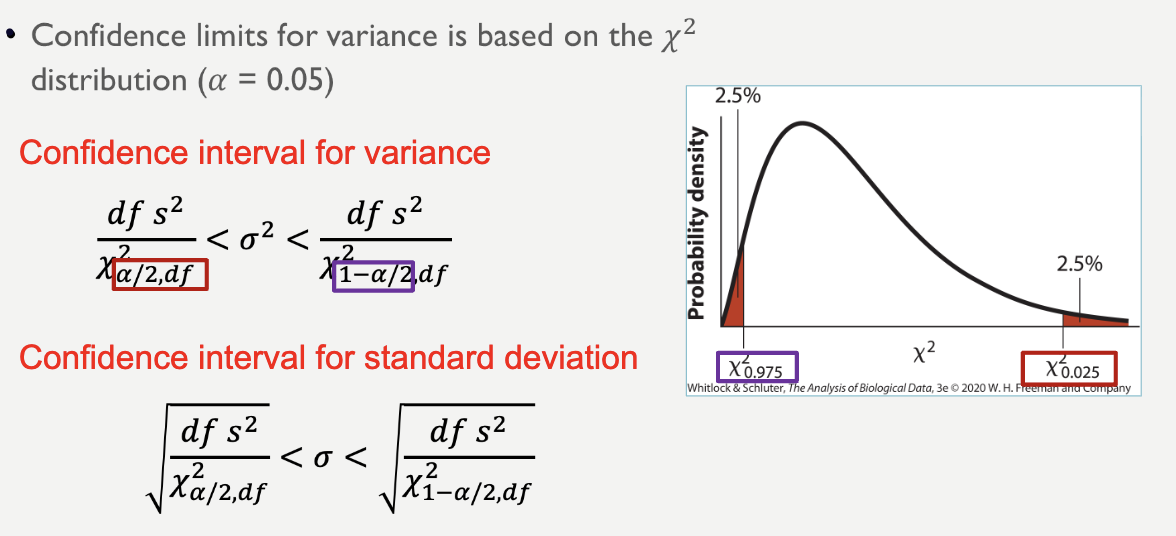
Estimating other statistics (spread of the sample distribution —> standard deviation or variance)


df = 19


Example: Birth weight
Average birth weight in the population = 3400 g
Is the average birth weight in this hospital the same?
A sample of 30 newborns is collected. (small so t-test)
One-sample t-test
H0: mean birth weight = 3400g
HA: mean birth weight ≠ 3400g
1) calculate SE
2) calculate t value
3) calculate df and compare with table
4) calculate CI
5) decision
6) CI for variance

2)

3)



4)

5)
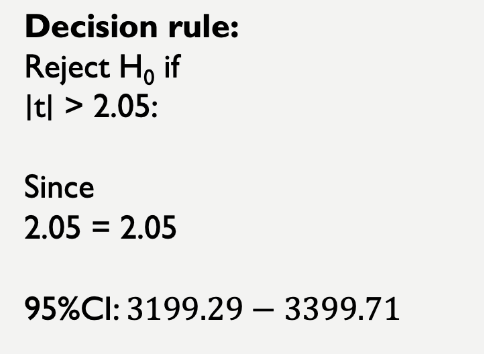
Value falls just beyond cutoff
Association really weak because you are very close to the borderline
Because you are slightly outside you must reject. DON'T ROUND TOO EARLY

6)


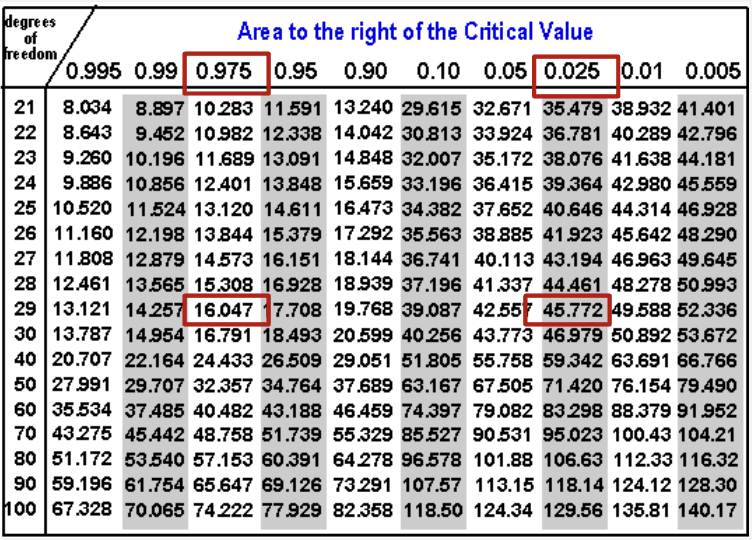
df= n-1 = 30-1 = 29

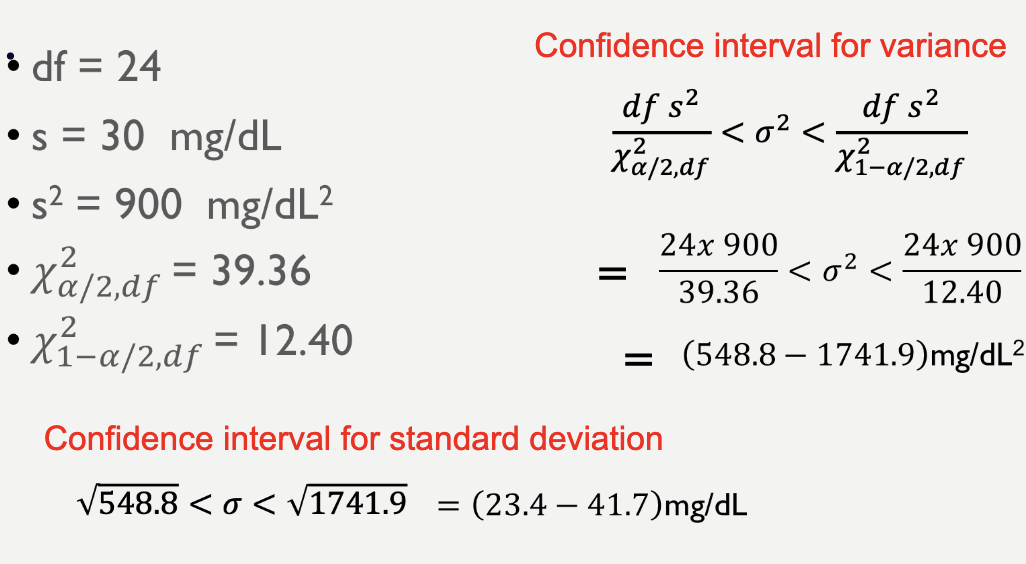
Example: cholesterol
Average cholesterol level in the population = 200 mg/dL
Is the average cholesterol level in patients at this clinic the same?
A sample of 25 patients is collected.
One-sample t-test
H0: mean cholesterol level = 200 mg/dL
HA: mean cholesterol level ≠ 200 mg/dL
1) what is standard error
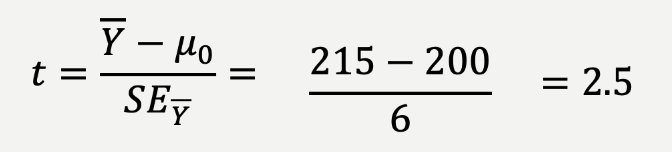
2) what is the t value
3) df and table value
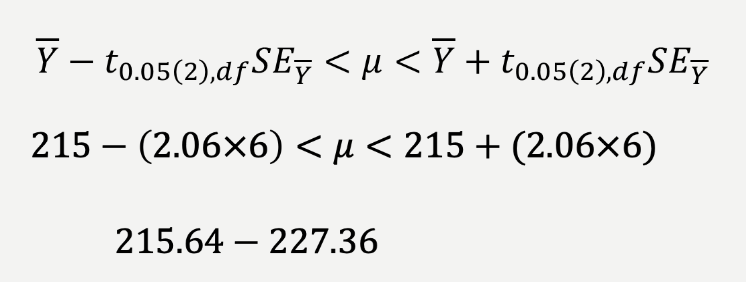
4) CI
5) decision
1)

2) what is the t value
3) df


4) CI
5)