mbb2 rm
 Call Kai
 Learn
 Practice Test
 Spaced Repetition
 Match
 Flashcards
 Knowt Play
1/42

There's no tags or description
Looks like no tags are added yet.
43 Terms
quantitative psychological research aims to
generate knowledge about populations
we can make inferences about
the population based on the evidence observed in the sample
a distribution of data can be fundamentally described according to its
central tendency (m) and variability (s)
we can use the 2s rule of thumb to
how can we more reliably decide what counts as typical vs extreme, define a critical limit, beyond which, cases are considered extreme
in a distribution with a normal shape… scores and sd of mean
95% of scores fall within approx 2 standard deviations (s) of the mean - typical scores
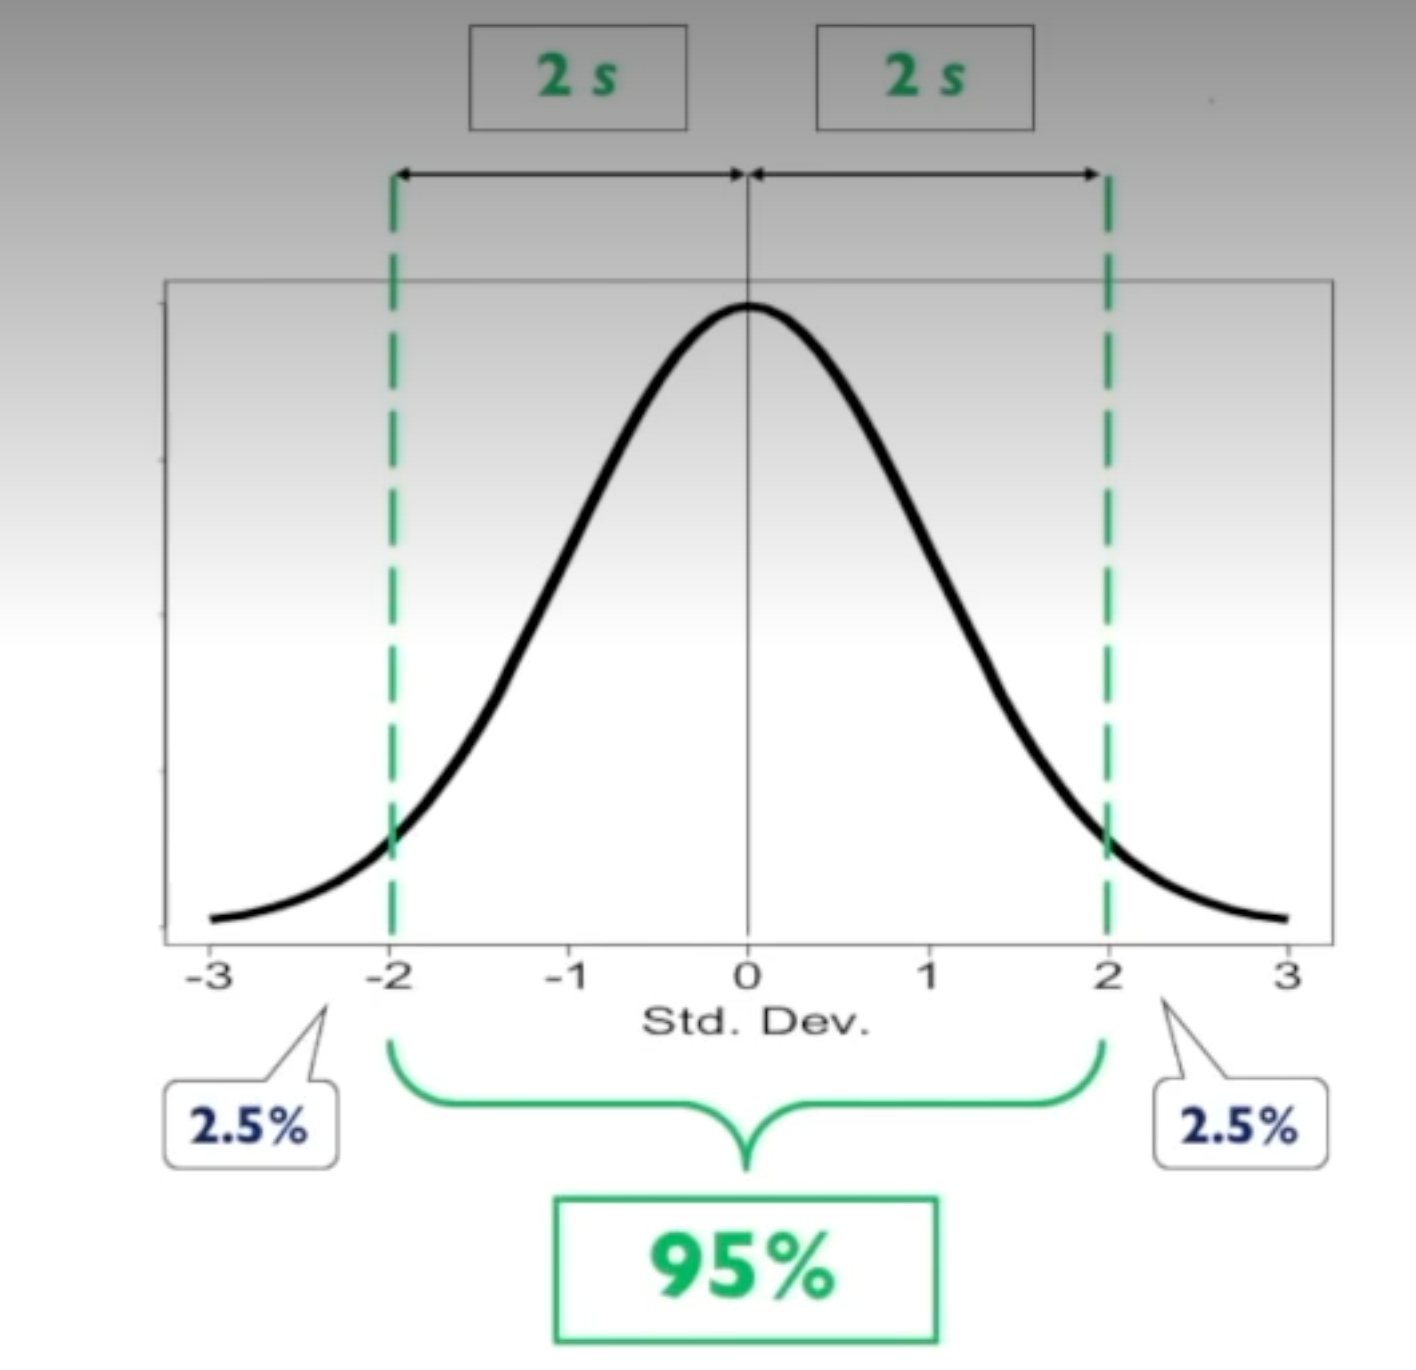
how to find critical limits?
add and subtract 2s from the mean to find critical limits for determining what is extreme and what is typicalbtract 2s from mean
we can decide if individuals scores are typical or extreme by
comparing one score with a distribution of other individuals scores
central limit theorem tells us: (3)
1) distribution of sample means has a mean equal to pop mean
2) details of SE, as sample size increases, SE decreases → estimation of pop mean more precise
3) for large sample sizes (=>30), distribution of sample means will have normal shape
distribution of sample means is made up of
the sample means from all of the random samples of a certain size (n) that could possibly be obtained from a sample
the distribution of sample means - in real research
not pragmatically possible to collect all possible random samples from a pop. however, we don’t need to
distribution of sample means is a theoretical distribution governed by central limit theorem
the central limit theorem tells us and implications
the precise characteristics of the distribution of any distribution of sample means
if sample large enough, distribution of sample means will be normal
mean of distribution of sample means = pop mean, and we can calculate its SE
therefore, we can use our 2s rule of thumb to test if our sample mean is typical or extreme
SE what is it and its formula
SD of distribution of sample means
sigma = pop SD

how determine if a sample is typical or extreme
2s rule of thumb, with the use of our sample mean and a distribution of sample means
e.g. my sample mean is 50 and the mean of the distribution of sample means is 30 with a SE of 5, so my sample mean would be extreme as its outside 2SE range
null hypothesis significance testing involves (4)
assigning a value to h0 that is equal to a population parameter e.g. pop mean
proceed assuming h0 is true, collect data
conduct statistical test to determine pr of sample mean occurring if null hypothesis is true
reject or dont reject null hypothesis
when would we reject vs not reject null hypothesise
if sample mean is extreme then our pr would be low and we would reject null hypothesis if sample mean is not extreme, pr would be high and we would not reject the null hypothesis
null hypothesis what does it predict
always predicts that nothing is happening. a hypothesis of no effect - no difference, no association, nothing happening in data
null hypothesis significance testing
process by which we can determine if our sample data provides evidence for some sort of difference in terms of whatever is being measured.
in a normal distribution of sample means, the 5% alpha level corresponds to
+/- 1.96 SE from the null hypothesised mean value
the alpha level defines
which sample means in a distribution of sample means are expected or typical, and which are unlikely or extreme, if the null hypothesis is true
when the comparison distribution is perfectly normal, the critical limits set by the 5% alpha level are precisely
+/- 1.96 standard errors from the mean of the distribution

how determine the probability of our sample mean occurring
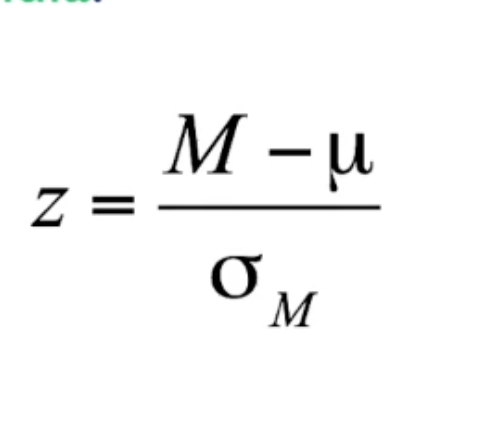
performing a single sample z-test → calculate a z-score for our sample mean
z-score will express
how many SE our sample mean is away from H0 pop mean value e.g. z = 1.5 → sample mean is 1.5 SE above the mean of the distribution of sample means
z score formula
M = our sample mean, μ = pop mean, σM= SE of mean. note that pop SD is known when calculating a z score/z test
why are t tests used instead of z tests
pop SD rarely known
use sample SD as estimate of pop SD.
formulas same apart from source of sd
t test formula
s = sample SE

one difference about the t-distribution
unlike z test which operates with standard normal distribution, t-distribution critical limit corresponding to our alpha level of 5% will not be fixed at +/-1.96 as it was with the z-test and normal distribution.
instead t-distribution requires that we consider sample size and df when determining pr of sample mean.
critical limit varies along with df
how do we see if t score is extreme taking into acc df
table at the back of textbook
single sample t test in SPSS (sig = pr of sample mean occuring/sig level)
Standard Error (SE) –
An estimate of how much the sample mean is likely to vary from the population mean, standard deviation of the distribution of sample means
How to calculate SE:
Divide the standard deviation by the square root of the sample size.
independent groups research design
participants are assigned to or come from two or more different groups
the independent samples t-test - assesses if
the difference between the two sample means is different to zero OR if one sample mean is < or > than the other
JASP output gives
descriptives, t-score, p value, effect size
the appropriate research design for use with an related samples t-test is .. which tests if
related samples t-test = paired samples t-test
a repeated measures research design, samples before/after an event come from same pop or not
the related or paired samples t-test assesses if the
diff between the time 1 (pre) and time 2 (post) means (on the same measure) is different to zero OR if one sample mean is < or > than the other
pearsons r is .. and may be
statistical measure of correlation in a sample
either pos or neg depending on direction of association
ranges from -1 to +1
pearsons r strength of association
coefficient values closer to -1 or +1 indicates stronger association. 0 indicates no association at all
the size of r specifies
how close the data is to a straight line (i.e. how strong is the linear association) e.g. -0.9 and 0.9 is close to a straight negative/pos association
neg vs pos linear association
in a positive linear association, as scores on x increase, scores on y also increase
in a negative linear association as scores on x increase scores on y decrease
correlation checklist what does it examine, what does each participant provide, and what manipulation
examines relationship between 2 variables x and y
each participant provides 2 pieces of data e.g. age and iq
simple observation. no control or manipulation
NHST correlation
can infer from samples to pop correlations using standard NHST
significant correlation provides evidence for association in pop
t distribution impact of df
smaller n → smaller df → more variability in s → fatter t tails → larger critical t
σM vs sM
σM = SE using pop SD σ.
sM = estimated SE, using sample SD s.
Standard Error (SE) –
An estimate of how much the sample mean is likely to vary from the population mean.