Math Lab Exam Study
 Call Kai
 Learn
 Practice Test
 Spaced Repetition
 Match
 Flashcards
 Knowt Play
1/46

There's no tags or description
Looks like no tags are added yet.
47 Terms
Class 2
Groups weather stations into 2 categories
Class 3
Groups weather stations into 3 categories
D70_1948
Number of days above 70°F in 1948
D70_2018
Number of days above 70°F in 2018
D90_1948
Number of days above 90°F in 1948
D90_2018
Number of days above 90°F in 2018
Suppose you want to know whether weather stations recorded more days above 70°F in 2018 than in 1948.
You would compare:
D70_1948
D70_2018
If you wanted to compare days above 90°F, you would use:
D90_1948
D90_2018
Continuous/numerical variable
A column containing numbers you can calculate statistics with. Examples: D70_1948 and D90_2018.
Categorical variable
A column that puts things into groups. Examples: Class 2 and Class 3.
Identifier
A number or label used to identify something, not something you normally calculate an average for. Example: Station.
Know how to open your excel data sheet.
Hit file at the top of computer.
Hit open.
Drag the file and drop it if you can, if not look for it.
Import it.
After inserting the data sheet, what should you check?
To make sure the column information is right. Right click the column and hit column info.
Numerical columns should be set to continuous (D70_1948, etc.)
Class 2 and 3 should be set to Nominal.
Station is an identifier so it should be set to nominal.
What are descriptive statistics?
Descriptive statistics are simply numbers that describe a column of data.
Types of Descriptive Statistics
Mean, Median, Standard Deviation, Minimum. Maximum. Range, Q1, Q3.
mean
The average
Median
The middle value
Standard deviation
How spread out the numbers are
Minimum
smallest value M
maximum
Largest Value
Range
Maximum - minimum
Q1
First quartile; 25% of data are below it
Q2
Third Quartile; 75% of the data are below it
How do you get descriptive statistics in JMP?
Click Analyze.
Distribution.
Numerical column you want (Like D70_1948) or whatever
Click “Y, Columns” to move it over
Click OK.
How will you be able to get a histogram on JMP?
When you do the steps to get descriptive statistics (Analyze → Distribution), it automatically makes a histogram

What type of histogram is this? What can you gather from it?
A symmetric (bell-shaped). Looks balanced on both sides. This means the mean and median are usually close together.

What type of histogram is this? What can you gather from it?
A right skewed histogram. It has a long tail extending to the RIGHT. Most values are towards the left. A few unusually large values pull the mean upward.
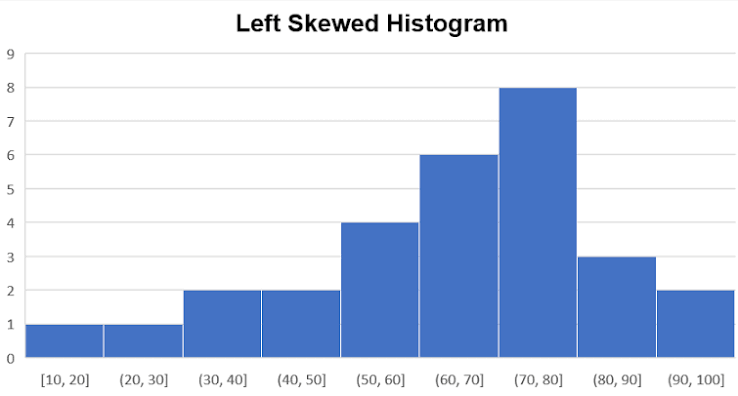
What type of histogram is this? What can you gather from it?
Left-Skewed. Has a long tail to the right. Most values are towards the left. A few unusually large values pull the mean upward.

What type of histogram is this? What can you gather from it?
Uniform. Bars are approximately the same height. Values are spread fairly evenly across the range.
If you have to determine a histogram, if the mean is greater than median
usually right skewed
If you have to determine a histogram, if the mean is less than median
Usually left skewed
Small standard deviation =
numbers are closer together
Large standard deviation =
numbers are more spread out
What is a two sample t-test
Answers this question: "Are the averages of these TWO groups significantly different from each other?"
Difference between a one sample t-test and a two sample t test
One: Compares ONE mean to a specific number. Only needs a numerical column.
Two: Compares TWO group means to each other. Needs a numerical column and a grouping column.
What question correlates with a one sample t test
Is the average 150?W
hat question correlates with a two sample t test
Is Group 1's average different from Group 2's?
How to do a two sample t test in JMP
Hit analyze.
Hit FIT Y BY X.
Select the numerical column you want. put it into Y, Response.
Find the group column you want (class). Put it into X, Factor.
Click OK.
Hit Red triangle beside one way analysis.
Hit T test.
For two sample, you're looking for prob > |t|. (two test p value)
In a two sample t test, what are you looking for with the p-value (prob < |t|)
Significant - There is evidence that the two population means differ.
Not significant - There is not enough evidence that the two population means differ.
What is Independent (two-sample) data?
You are comparing two separate groups.
Example: Weather stations belonging to Category 1 vs. different weather stations belonging to Category 2.
You're comparing two separate groups of stations.
What is Dependent two sample data (Paired data)?
You are comparing two measurements from the SAME subjects.
Example: Measuring the number of warm days at the exact same weather stations in 1948 and 2018.
Each station has a measurement from 1948 AND 2018. The two measurements are connected because they came from the same station.
What is ANOVA?
ANOVA compares the means of THREE OR MORE groups. (group 1, 2, and 3)
How to do ANOVA in JMP
Click Analyze.
Fit Y by X.
Numerical variable into Y, Response.
Put class 3 into X, Factor.
OK.
Red triangle next to Oneway Analysis.
Means/ANOVA.
Look for Prob > F value.
What is Tukey’s Table?
ANOVA tells you whether there is a difference somewhere among the groups.
But it does NOT tell you exactly WHICH groups are different.
That's where Tukey's test comes in.
How to do Tukey’s Test in JMP
Run the One Way Analysis (ANOVA).
Hit the red triangle next to Oneway Analysis. Hit Compare Means.
Hit All Pairs, Tukey HSD.
Scroll down to Ordered Differences Report.
What is a scatterplot?
A scatterplot is a graph made of dots.
Each dot represents one observation, with one variable on the horizontal axis and another on the vertical axis.
For example, you could look at:
X-axis: Number of days above 70°F in 1948.
Y-axis: Number of days above 70°F in 2018.

What kind of scatterplot is this?
Positive correlation. Dots move up from left to right. When X increases, Y increases.