Topic 1 - Economic Growth
 Call Kai
 Learn
 Practice Test
 Spaced Repetition
 Match
 Flashcards
 Knowt Play
1/43

There's no tags or description
Looks like no tags are added yet.
44 Terms
What are models?
Collection of equations
Diagrams are a visual representation of equations
Expanding model = adding more variables/equations if needed
Apply shocks to models to see what happens
3 skills developed:
Understand the equations
Connect equations with diagrams
‘Intuition’ = explanation of how economy behaves based on equations & diagrams
3 skills developed:
Understand the equations (maths)
Connect equations with diagrams (graphs)
‘Intuition’ = explanation of how economy behaves based on equations & diagrams (words) - EXPLAIN WHAT THE MODEL PREDICTS
What does economic growth refer to?
Refers to the growth in the standards of living
Why is modelling economic growth useful?
Helps us understand why some countries are richer than others
Helps us design policies that can promote economic growth
What are the 2 time periods we look at when looking at economic growth?
Long run - all variables can vary, e.g. GDP
Short run - one variable fixed, rest can vary, .e.g. business cycles i.e. recession
What is the difference between:
GDP
GNP
GDP = total value of all finished goods and services produced in a country in a given time period
Anything produced domestically - could be by British or foreign firms
More about where production takes place
GNP = total value of goods and services produced using the resources owned by a country’s residents + income from abroad
measures production and income linked to a country's residents, wherever they are in the world
GDP + income received from abroad - income paid abroad

Growth rate has to be visible to help with the opportunity of social mobility
Growth rate has to be visible to help with the opportunity of social mobility
1.2 THE BASIC SOLOW MODEL
1.2 THE BASIC SOLOW MODEL
Name these key terms involved in the Solow Model.
What terms in the Solow model are:
Endogenous variables (determined within model, values calculated using model & its equations)
Exogenous variables (determined outside model, taken as given/assumed as model doesn’t predict their values)
Endogenous variables = capital per worker (k), output per worker (y)
Exogenous variables = savings rate (s), depreciation (δ), alpha (α), population growth (n), technological growth (A)
What are the key assumptions for the aggregate production function Y = F (K,N):
Key assumption
3 other assumptions
KEY ASSUMPTION - Allow capital (K) to grow - investment causes it to grow (capital accumulation), depreciation causes it to shrink
Sometimes in SR, capital doesn’t always grow, but we need it to grow to understand how it contributes to economy
The more capital you have, the more you can produce, invest more, grow more, etc.
(Initially assume) labour (N) is constant - population growth causes growth of the labour force
No government spending or taxation
Closed economy - no exports, imports or borrowing from abroad

GDP vs gdp per capita example
fill in from
δ
k̇
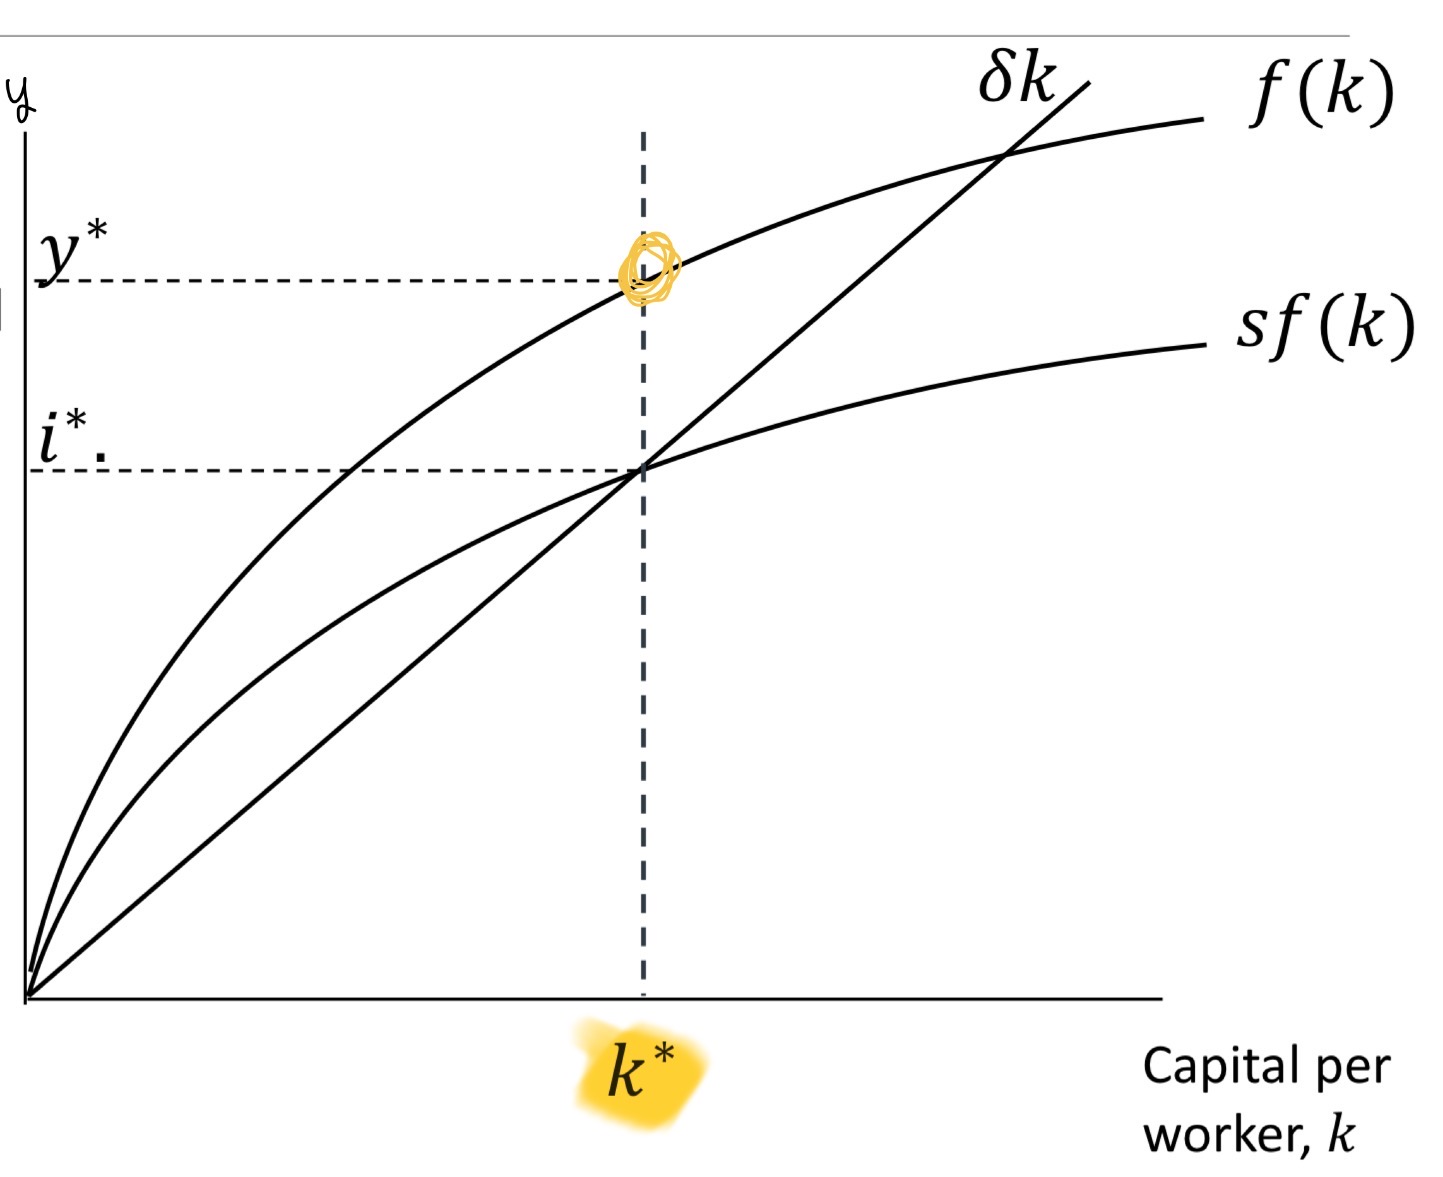
Describe where the steady state (or equilibrium) occurs in the Solow Growth model.
Equilibrium condition » sf (k) = δk
Investment per worker is just enough to cover the depreciation of capital, so capital per worker can remain constant (invest to compensate for depreciation)
k̇ = 0 = constant > a state of steady, balanced growth
k* = steady state capital per worker
What is capital accumulation?
What are the 2 types of capital accumulation?
Capital accumulation = increase in the economy’s stock of capital (machines, infrastructure, etc.) over time (when sf (k) > δk)
Capital deepening = capital per worker increases (K/N increases) > leads to higher productivity (sf > dep)
Capital widening = maintains same level of capital per worker - capital increases constant to keep up with labour increases (K/N constant) > prevents productivity falling (population variable)
give extra machines to existing workers (deepening)
give machines to new workers (widening)
What is the fundamental Solow equation of motion (capital accumulation equation) and describe what happens when:
k̇ > 0
k̇ < 0
k̇ = sf (k) - δk - tells us how capital per worker changes over time, depending on whether investment is greater or less than depreciation
k̇ = dk/dt = change in capital per worker overtime (dk/dt is the instantaneous rate of change of capital per worker, with respect to time (which is continuous)
change in capital stock = investment - depreciation (investment = sf (k))

Describe how the model returns to the steady state when there’s a change in the capital stock:
sf (k) > δk (k̇ > 0)
sf (k) < δk (k̇ < 0)
k1 < k*:
At capital level k1, i > dep and i exceeds break-even investment
This means k̇ is positive (k̇ > 0) so capital per worker increases over time
As capital per worker increases, productivity (output per worker) also increases
k will continue to grow (e.g. k1 > k2) towards k* as still i > dep, with the rate of capital accumulation (k̇) getting smaller
Until eventually it reaches k* (steady state level of capital) where sf (k) = δk and k̇ = 0, where capital per worker remains constant
k3 > k*:
At capital level k3, dep > i and i is below break-even investment
This means k̇ is negative (k̇ < 0) so capital per worker decreases over time
As capital per worker decreases, productivity (output per worker) also decreases
k will continue to fall (e.g. k3 > k4) towards k* as still dep > i, with the rate of capital accumulation (k̇) getting smaller
Until eventually it reaches k* (steady state level of capital) where sf (k) = δk and k̇ = 0, where capital per worker remains constant

“What happens in the steady state?”
=
Code for “what happens in the long run to the variable in the model?”
“What happens in the steady state?”
=
Code for “what happens in the long run to the variable in the model?”
How do you find the steady state using algebra (equations and numbers)?
Transform PF into intensive form - to obtain ‘per worker’ terms (capital and output per worker) and the Solow production function
Find algebraic steady state equation - using the general steady state formula, and the condition k̇ = 0 to find an equation which we can use to calculate the steady state levels
Use to find endogenous variables k* and y*:
Find k* - rearrange equation to make k the subject (endogenous variable) as a function of exogenous variables (all on the RHS)
Find y* - substitute k* into the production function y = kα to find steady state output per worker
Add numerical values - use exogenous variable amounts given (s, δ, α) and plug into both equations we already found to find values


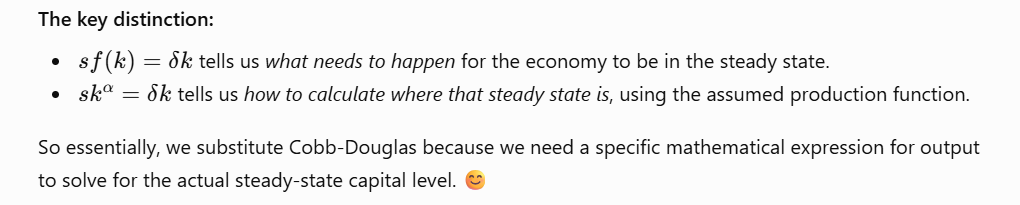

Why is it useful to now have a mathematical equation, where k/y are a function of exogenous variables (RHS)?
Use example of a change in savings rate
Can now change values of s, δ, α to predict what will happen in economy - this is what we build models for
> Exo variables can cause shocks
Example - savings rate:
Prediction: countries that save more have higher SOL
↑s = greater proportion of income is saved (or invested)
Shifts sf(k) curve upwards, from s1f(k) > s2f(k)
i > d, so k̇ > 0 meaning capital per worker begins to rise
As k1* rises, y1* also increases The economy moves towards its new, higher steady state, k2* and y2*
As the economy approaches the new steady state, the gap between investment and depreciation gets smaller, so capital accumulation slows down
At the new steady state, investment once again equals depreciation, so k̇ = 0
A rise in the proportion saved will result in a one-off rise in output per worker (higher steady state), but not sustained growth (will stay at y*2 steady state)
*AI*

‘everything kept the same’ (ceteris paribus) = keeping all other exogenous variables the same
endo = not fixed
exo = can be fixed, e.g. ↑s but keeping δ, α the same
‘everything kept the same’ (ceteris paribus) = keeping all other exogenous variables the same
endo = not fixed
exo = can be fixed, e.g. ↑s but keeping δ, α the same
1.3 HOW DOES POPULATION GROWTH INFLUENCE OUR STANDARDS OF LIVING?
1.3 HOW DOES POPULATION GROWTH INFLUENCE OUR STANDARDS OF LIVING?
What is the equation for the exogenous variable: population growth rate?
*only really included in long run as in short run won’t really change much population size so not really included in business cycles*

Maths - How does the Solow equation of motion change to incorporate population growth (how capital changes overtime)?
Break-even investment per worker, the amount of investment necessary to keep k constant, now has 2 elements:
δk (same as before) - to replace capital as it wears out
nk (new) - to equip new workers with capital
> k = K/N, so as the denominator gets bigger, the smaller k gets
> if no nk, then k would fall as existing capital stock would be more spread over a larger pop
can’t just invest more capital at the same level of depreciation, have to take pop growth into account

How does the Solow equation of motion change to incorporate population growth (steady state equation)?
use original equation if n = 0%
use this if n = above 0, e.g. 1%, 3%, etc.

How does the Solow model graphically change to incorporate n (pop growth rate)?

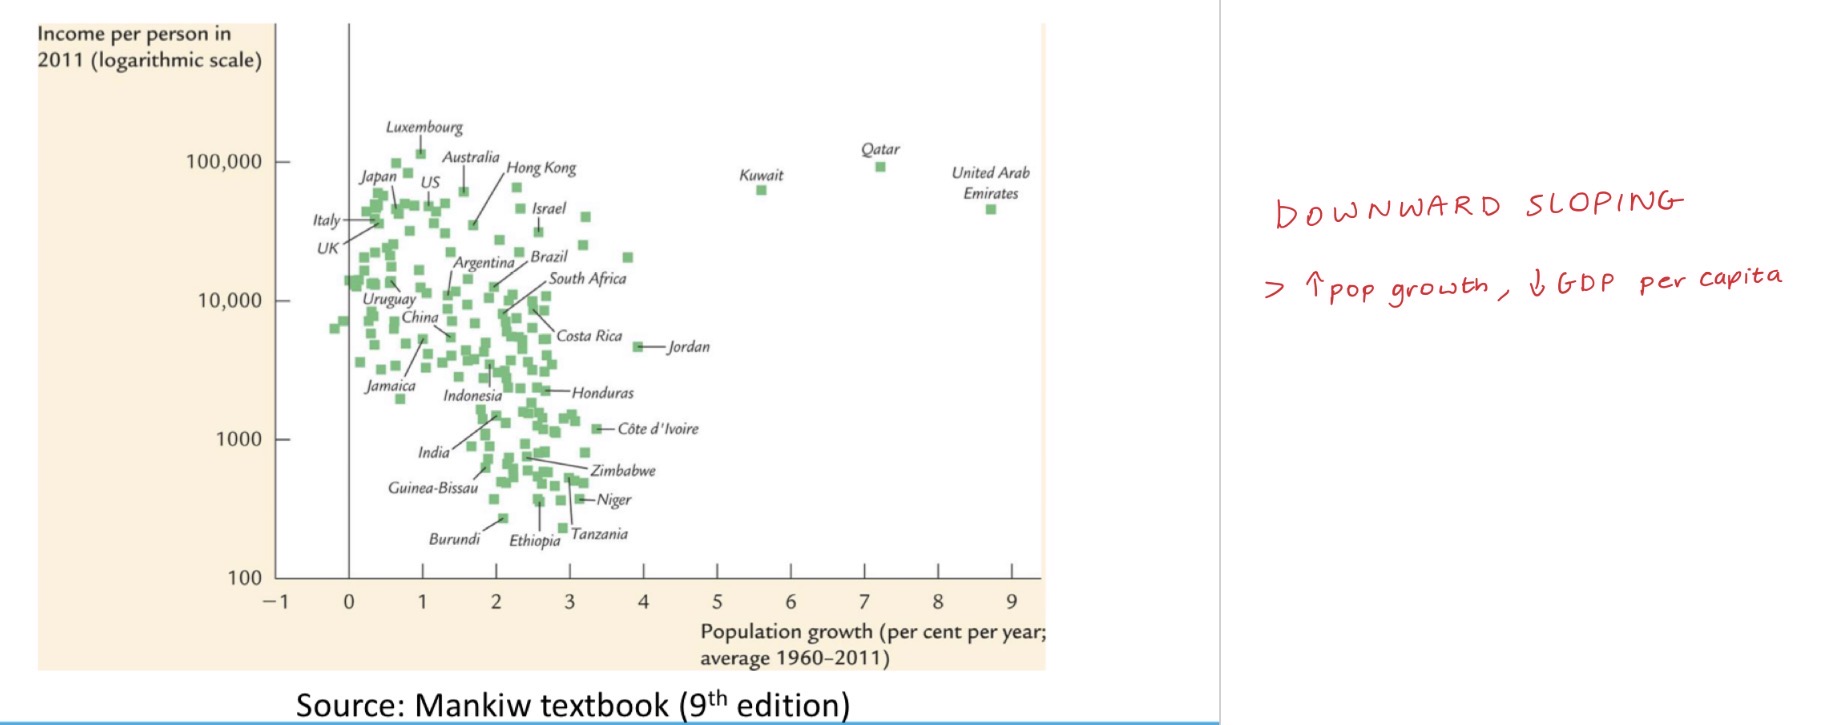
What is the prediction from the Solow model regarding a faster population growth impacting economic growth?
↑sustained population growth = lower GDP per capita > lower SOL
In the long run, countries with higher population growth rates will have lower levels of capital/income per worker
When population growth is relaxed (not constant), describe & show on a graph:
Temporary rise in population
Sustained growth in population
Temporary rise in population (shock to economy, one-off rise):
Population change - e.g. sudden spike in birth rate, surge in immigration
Disequilibrium - initially capital per worker falls as L increases instantly but K only changes gradually through investment (ke to k1) so output per worker falls/productivity reduces (ye to y1)
Capital widening - at k1, i > dep so capital begins to accumulate to keep up with labour increases, leading to more capital per worker
Steady state - returns to equilibrium (ke, ye) and productivity is prevented from a sustained fall
Sustained growth in population:
Population change - population continually rising
Disequilibrium - (same description as above)
Line swivels - therefore, as population continually rising, capital widening will become constant to keep up extra capital for increasing labour force, so dep line will swivel upwards, to make dep + cw (necessary to allow dep + cw to maintain any given level of capital per worker)
New equilibrium - where i = dep + cw, so y will be permanently lower (at y1) so productivity will fall (doesn’t necessarily mean GDP will fall) and countries will be poorer

How can population growth be used as a policy instrument?
lower pop growth = increase GDP per capita > SOL
e.g. one child policy - China
*savings rate main policy instrument*
Describe why each curve is the shape it is:
sf (k) curved
δk / δ + n straight

1.4 THE GOLDEN RULE
1.4 THE GOLDEN RULE
Established changes in different exogenous variables (s, n) give us different steady states and tell us why economies become richer
So now, how do we know which is the best steady state so we can have higher SOL (maximise welfare)?
If use GDP per capita (y) as your measure of welfare - there’s no ‘best’ steady state, bc we just want it to be as high as possible. e.g. ↑s, the higher y will be so the higher SOL are considered
Instead if we use consumption per worker (c) as our measure of welfare - we are able to find a consumption maximising steady state
This is bc e.g. ↑s (= ↑i), will have 2 opposing effects on c*:
Higher income per worker - as k* increases, this will increase output (y*), which in turn means higher income per worker, which may mean they have more income to consume, so may consume more
Reduces consumptions share of income (y = c + i) - c = (1 - s)y, so this may lower consumption
two opposing effects = suggests there may be a savings rate the maximises c*
Therefore, what is the golden rule?
Golden rule = steady state condition where the savings rate is chosen to maximise consumption per worker in the long run (and therefore welfare/SOL)
Maths - How do we derive a mathematical condition that is satisfied at the golden rule steady state (to give us the golden rule steady state equation)?


How do we represent the golden rule graphically?
What is the intuition for the diagram?
*REMEMBER draw f (k) and (δ + n)k first, find tangential point, then draw sgold f(k)*
Golden rule capital stock = level of capital where consumption per worker is maximised
This point is where MPK = δ + n (slope of pf = slope of dep function)
MPK = return to capital owners from owning one unit of capital
δ + n = BEI per unit of capital, tells us how much additional investment required to maintain capital per worker
GOLDEN RULE = when entire return from capital is reinvested (if not capital shrinks)

Policy - as the economy does not have the tendency to move towards (specifically) the golden rule steady state, relaxing the assumption of a closed economy (no government):
How can policymakers achieve the golden rule steady state?
How can you show this diagrammatically & using the impulse response diagram with intuition?
Critical analysis?
Can influence savings rate by changing its budget deficit or surplus through fiscal policy to achieve the golden rule steady state
Aggregate savings = private savings + public savings
private savings = money households & businesses save
public savings = taxes - gov. spending
2 ways:
↑s by ↑taxes or ↓gov. spending > creates a larger surplus (more saving)
↓s by ↓taxes or ↑gov. spending > creates a larger deficit (less saving)
Policy - as the economy does not have the tendency to move towards (specifically) the golden rule steady state, relaxing the assumption of a closed economy (no government):
How can policymakers achieve the golden rule steady state?
How can you the transition to the golden rule steady state diagrammatically & using the impulse response diagram with intuition (in particular about c)?
Critical analysis?
If k* < k*gold then increasing savings required:
y, c, i at constant steady state - below k*gold
↑s rate through contractionary policies - as s↑, c dips whilst i increases (as a bigger proportion saved = invested, so less consumed)
i > BEI so ↑y - investment exceeds break-even investment, so capital per worker increases and as k increases, so does output per worker (y)
c and i fixed proportions of y - i increases, and eventually c increases (even though initially dipped)
consumption (c) - increases, heading towards golden rule
All stabilise at a new steady state (the golden rule) - all land above the dotted line (as higher levels than previous steady state)
If k* > k*gold then decreasing savings required:
y, c, i at constant steady state - above k*gold
↓s rate through expansionary policies - as s↓, c increases whilst i decreases (as a smaller proportion saved = invested, so more consumed)
i < BEI so ↓y - investment falls below break-even investment, so capital per worker decreases and as k decreases, so does output per worker (y)
c and i fixed proportions of y - i decreases, and eventually c decreases (even though initially increased)
consumption (c) - decreases, heading towards golden rule
All stabilise at a new steady state (the golden rule) - y and i land below the dotted line (as lower levels than previous steady state), but c, though decreased, still lands above dotted line as consumption always higher at golden rule steady state than any other steady state

Policy - as the economy does not have the tendency to move towards (specifically) the golden rule steady state, relaxing the assumption of a closed economy (no government):
How can policymakers achieve the golden rule steady state?
How can you show this diagrammatically & using the impulse response diagram with intuition?
Critical analysis?
May be difficult to introduce policy
Whilst future generations experience higher consumption (long run), the current ones experience an initial drop in consumption (short run)
Therefore, may be hard to motivate people
1.5 TECHNOLOGICAL PROGRESS
1.5 TECHNOLOGICAL PROGRESS
What does technological progress actually mean?
Technological progress = improving technology + improving skills
What is the formula for the rate of growth of labour efficiency?

Maths - How does the Solow equation of motion change to incorporate technological progress (how capital changes overtime)?
Break-even investment per effective worker, the amount of investment necessary to keep k̂ constant, now has 3 elements:
δk̂ (same) - to replace capital as it wears out/depreciates
nk̂ (same) - to equip new workers with capital
xk̂ (new) - provide capital for the new “effective” workers created by technological progress
> as k̂ = K/AN, as A gets bigger, k̂ shrinks
> (as the amount of productivity per worker increases, this will mean there are more effective workers, so as that gets bigger, capital per effective worker shrinks)
Maths - How do we derive a mathematical condition that is satisfied at the steady state with technological progress (to get the steady state equation & solve k̂/ŷ/ĉ)?