Econ- 2 hl topics, elasticities, gov intervention and microeconomics
 Call Kai
 Learn
 Practice Test
 Spaced Repetition
 Match
 Flashcards
 Knowt Play
1/62

There's no tags or description
Looks like no tags are added yet.
63 Terms
Assumptions
-if a consumer prefers A to B and B to C that the consumer would prefer A to C
-a consumer prefers more goods that less
-people don’t have bias
-assumes a consumer has all the info. all both products to make a decision
Anchoring
involves the use of irrelevant info. to make a decision
Framing
how choices are presented to decision makers
Availability
refers to info that is most recently available, which people tend to rely on more heavily
Bounded rationality
consumers are only rational within limits as it is limited by insufficient info, biases, the limitations of the human mind to process large amounts of info
Bounded self-control
exercise self-control only within limit. They often don’t have the self-control to make the rational decision
Bounded selfishness
people don’t act purely out of self-interest
Imperfect info
assumes that consumers have access to all info when they dont
Nudge theory
a method designed to influence a consumer’s decision without offering financial incentives.
choice architecture
make decisions influenced by how the options are represented:
-makes the choice they want the default
-intentionally limit the number of choices that could be made
-mandated choice
Critique on choice architecture
-seen as manipulative
-free choice is seen as weakened
-takes advantage of incomplete info
-risk involved
-people may not be aware of it therefore can be dangerous
-not their true intentions of their preferences
profit
revenue - cost
PED

PED
PED is a negative number but the absolute value is taken.
PED elastic
Greater than 1 | Quantity changes by a larger percentage than the price. | Flatter downward slope | Luxury holidays, restaurant meals, designer clothes |
PED inelastic
Between 0 and 1 | Quantity changes by a smaller percentage than the price. | Steep downward slope | Petrol, tap water, basic groceries, cigarettes |
PED unit elastic
Unitary Elastic | 1 | Quantity changes by the exact same percentage as the price. | Rectangular hyperbola | Theoretical benchmark (total revenue stays constant) |
PED is perfectly inelastic
Perfectly Inelastic | 0 | Quantity demanded does not change at all when price changes. | Vertical line | Life-saving insulin, emergency medical care |
Demand curve and its elasticity
It is sometimes hard to tell the elasticity as curves look different with different scales. To overcome this intersect the curves to show that one is more elastic than the other. The flatter the curve the more elastic it is.
PED varies along the curve
PED changes along the curve this is due to how it is calculated. At high prices and low quantities, the percentage change in Q is relatively large while the percentage change in P is relatively small. Therefore there are portions that are elastic and portions that are inelastic.
Determinants of price elasticity fo demand
-number and closeness of substitutes
-necessities vs. luxuries
-length of time: the longer time period in which a consumer makes a purchasing decision, the more elastic the demand.
-proportion of income spent on a good
Real life for PED:
PED elastic: an increase in price will cause a fall in total rev. however, a decrease in price causes a rise in total revenue.
PED inelastic: an increase in price will cause a increase in total rev., while a decrease will cause it to fall
PED is unit elastic: a change in price has no effect in revenue
PED and indirect taxes
The lower the PED for the taxed good, the greater the tax revs.
Commodities in relation to PED
Primary commodities (natural resources) have relatively low PED because they are necessities and have no substitutes (e.g. food and oil)
The PED of manufactured products are relatively high because they usually have substitutes.
YED
Measure of the responsiveness of demand to changes in income and involves demand curve shifts.
YED formula

YED normal good
Normal Good (YED > 0): Demand rises when income rises and falls when income falls.
Necessities (0 < YED < 1): Income inelastic. Demand rises less than proportionally as income grows (e.g., basic groceries, bread, utilities).
Luxuries (YED > 1): Income elastic. Demand rises more than proportionally as income grows (e.g., vacations, fine dining, luxury cars)
YED inferior good
Inferior Good (YED < 0): Demand falls when income rises and rises when income falls, as buyers trade up to better alternatives.
"Inferior" describes the income relationship, not poor product quality.
Examples include instant noodles, store-brand groceries, and used goods
Engel diagram and YED
The vertical axis measures the income of a consumer and the horizontal axis the quantity being bought.
YED is more than 0 in the upward sloping part of the curve showing quantity and income both increasing, which indicates the good is normal
YED is less that 0 in the downward sloping part showing quantity decreasing as income increases, which indicates the good is inferior.
Engel diagram and luxury or necessity
YED more than 1 if the line touches the vertical axis is a luxury service
YED is less than 1 the line touches the horizontal axis-necessity
YED application
Over time, as countries experience economic growth, this causes society’s incomes to increase. This means that elastic goods demand grows and inelastic goods decreases. OVer time the primary sector decreases and the tertiary sector increases (services).
PES
the measure of the responsiveness of the quantity of a good supplied to changes in its price. IF there is a relatively large responsiveness then supply is elastic if there is a relatively small responsiveness supply is inelastic.
PES equation

PES determinants if a good is elastic or inelastic
-length of time: Momentary / Immediate Period (Inelastic to Perfectly Inelastic): Quantity supplied is largely restricted to existing inventories or current daily output. Short Run (Relatively Inelastic): Firms can only adjust output slightly by using existing resources more intensively. Long Run (Relatively Elastic): All factors of production are variable.
Mobility of factors of production: The more easily resources can be shifted out of one line of production and into another, the greater the responsiveness of quantity supplied to changes in price, hence the greater the PES.
Spare capacity of firms: Higher capacity means firms are more responsive
Ability to store stocks: Firms with this ability have a higher PES.
Rate at which costs increase: If costs of producing extra output increases rapidly, then supply will be inelastic. IF the costs of producing more output rise slowly, it will be elastic.
PES application
Primary commodities usually have a lower PES than manufactured. This is because of time needed to for the quanitity supplied to respond to price changes asproducers cannot quickly increase output when prices rise.This causes short-term price and revenue instability for producers such as farmers. Inelasticity also contributes to this.
Why do governments intervene in markets
-Earn revenue for the gov: indirect taxes (taxes on goods and services)
-Provide support to firms: smaller firms that need help to be established e.g. subsidies and price floors and trade protections e.g. tariff and quotas
-Provide support to households on low incomes: e.g. subsidies, price ceilings, and direct provision and services
-influence the levels of production of firms: gov provides support to increase production
-influence levels of consumption of households/consumers: would like the increase of consumption of merit goods and the decrease of demerit goods e.g. subsidies, direct provision of services, nudges, command and control methods
-correct market failure: failure of markets to achieve allocative efficiency. So the market had produced quantities of a good or service that was too large or too small in relation to what society mostly prefers.
Promote equity: Undertakes to redistribute income e.g. price ceilings and subsidies
Price ceiling
a legal maximum price for a particular good.
Consequences of price ceilings
Shortage: results in lower quantity supplied and sold than equilibriums. It also gives rise to a larger quantity demanded than equilibrium therefore causing a shortage. Qd-Qs
Non-price rationing: the quantity of the good cannot be distributed and can only be done through non-price rationing methods e.g. waitlist, coupons, favouritism
Underground markets: often underground markets buy a good at max legal price and then illegally resell it at a price above the legal maximum. (happens when theres a shortage)
Under allocation of resources to the good and allocative efficiency: because of a smaller quantity supplied, not enough resources are allocated to the production of the good, resulting in underproduction relative to the social optimum. (third parties get less benefits, the resources don’t generate the highest value they could achieve)
Negative welfare impacts: welfare loss represents welfare benefits that are lost to society because resources are not allocated efficiently
Consumer surplus formula
(price intercept of demand - price of consumers) x quantity purchased /2 then also find the final consumer surplus by using the area of a trapezium formula from above the price ceiling and below the consumer surplus. After you have gotten that value subtract it.
Producer surplus formula
(price of producers minus price intercept of the supply curve) x quantity sold /2
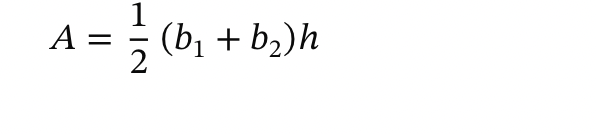
After the price ceiling is imposed than the surplus is the area of a triangle therefore use the formula for a triangle 1/2(bh)
Subtract the values
Price floors
legal minimum price
Why do governments impose price floors
-provide income support for farmers by offering them prices for their products that are above market-determined prices
-to protect low-skilled, low-wage workers by offering them wage that is above the level determined by the market
-to protect people from buying demerit goods
Consequences of price floors
-surplus: smaller quantity demanded and a larger quantity supplied
-government measures to dispose of surpluses: governments have to figure out what to do with the surplus. An option is to store it but this costs additional money, another way is to export it which requires subsidies
-firm inefficiency: firms don’t need to try to cut costs by using more efficient production methods because of the high prices offering the protection against competitors.
Overallocation of resources and allocative inefficiency: too many resources are allocated leading to too much being produced
Negative welfare impacts:
Surplus of price flooring
Qs-Qd
Change in consumer expenditure price flooring
Pe-Qe (before pf) and after pf=Pf x Qs and subtract the two
Government expenditure price flooring
Pf x (Qs -Qd)
Change in consumer surplus price flooring
(P intercept of D curve - P of consumers) x Q purchases /2
Producer surplus price flooring
(P of producers - P intercept of S curve) x Q sold /2
Impact of minimum wage on market outcomes
-labour surplus and unemployment
-illegal workers at wages below minimum wage
-misallocation of labour resources: industries rely heavily on unskilled workers are more likely to be affected and will hire less unskilled labour
-misallocation in product markets: misallocation of labour leads to misallocation in product markets.
Indirect taxes
imposed on spending to buy goods and services which are paid partly by the consumer but paid to the government by producers
Types of indirect taxes
Excise taxes: imposed on particular goods and services such as petrol, cigarettes and alcohol
Taxes on spending on most goods and services: general sales taxes (US) and value added taxes (EU, Canada, etc.)
Direct taxes
involve payment of the tax by the taxpayers directly to the government
Why do governments impose indirect taxes
-Source of revenue
-method to discourage consumption of goods that are harmful for the individual
-used to redistribute income (e.g. putting tax on luxury goods)
-used to improve the allocation of resources
Calculating indirect taxes
Pc-Pp
Excise taxes
can be
specific taxes: a specific amount of tax per unit
ad valorem taxes: a fixed percentage of the price of the good or service
Subsidy
refers to the assistance by the government to individuals or groups. Take the form of direct cash payments or other forms such as low-interest or interest free loans.
Why do governments grant subsidies
-used to increase revenues of producers
-make certain goods more affordable to low-income consumers
-can be used to encourage production and consumption of a particular good and service that is believed to be desirable
-used to support the growth of a particular industry in a economy
-used to encourage exports of a particular good
-method to improve the allocation of resources by correcting positive externalities
Total government expenditure subsidy
(Pp-Pc) xQsb
Consumer expenditure subsidy
P*xQ* and subtract this value from Pc x Qsb
Producer revenue subsidy
P*xQ* and subtract this value from Pp x Qsb
Consumer surplus subsidy
(Price intercept of Demand curve - P of consumers )x Q purchased /2 then subtract from after
Producer surplus subsidy
(P - Price intercept of the S1 curve) xQ /2 - after
Welfare loss subsidy
(Pp-Pc)(Qsb-Q*)/2