Biostats quiz
 Call Kai
 Learn
 Practice Test
 Spaced Repetition
 Match
 Flashcards
 Knowt Play
1/112

There's no tags or description
Looks like no tags are added yet.
113 Terms
An example of a categorical nominal variable is
Data into named groups and can’t be sorted
An example of a categorical ordinal variable is
Pain scale at the hospital (1-10)
An example of a numerical - continuous variable is
Shoe size (3-15)
An example of a numerical discrete variable is
Number of fish counted in a tide pool

In the data table image, what type of variable best describes the PTSE column?
categorical ordinal

In the data table image, what type of variable best describes the Temp_C column?
Numerical continuous

In the data table image, what type of variable best describes the Bacteria_Count column?
numerical discrete

In the data table image, what type of variable best describes the Lottia_Avg_Size_mm column?
Numerical continuous

In the data table image, what type of variable best describes the Lottia_Counted column?
Numerical discrete

In the data table image, what type of variable best describes the Lottia_Max_Size_mm column?
Numerical Discrete

In the data table image, what type of variable best describes the Substrate_Type column?
categorical nominal

In the data table image, what type of variable best describes the Human_Visitation column?
categorical ordinal

In the data table image, what type of variable best describes the Site column?
categorical nominal
Dr. Bobich (CPP Biological Sciences Department) has a burning desire to know what the average height of the trees on the CPP campus is. So he goes out on a Saturday, randomly selects 83 trees, and measures the height of each of them. Within this context, which term best describes all the trees on the CPP campus?
Population
Dr. Bobich (CPP Biological Sciences Department) has a burning desire to know what the average height of the trees on the CPP campus is. So he goes out on a Saturday, randomly selects 83 trees, and measures the height of each of them. Within this context, which term best describes the mean height of the trees Dr. Bobich measured?
Statistic
Dr. Bobich (CPP Biological Sciences Department) has a burning desire to know what the average height of the trees on the CPP campus is. So he goes out on a Saturday, randomly selects 83 trees, and measures the height of each of them. Within this context, which term best describes the trees Dr. Bobich measured?
sample
Dr. Bobich (CPP Biological Sciences Department) has a burning desire to know what the average height of the trees on the CPP campus is. So he goes out on a Saturday, randomly selects 83 trees, and measures the height of each of them. Within this context, which term best describes the mean height of all the trees on the CPP campus?
Parameter
Habitat type is an example of a __________ variable
categorical nominal
Species within a community is an example of a __________ variable
categorical nominal
Weight class (small: 2 to 10 g; medium: 10 to 30 g; large: 30 to 100 g) is an example of a___________ variable
categorical ordinal
Seastar Wasting Disease category (Healthy = no lesions, Mild = lesion(s) on up to 2 arms, Severe= lesions on most of body and missing arms) is an example of a ___________ variable
categorical ordinal
Count of invasive plants per experimental plot is an example of a ___________ variable
numerical discrete
Number of shells an individual hermit crab uses over its lifespan is an example of a ___________ variable
numerical discrete
Elephant body weight (kg) is an example of a ___________ variable
numerical continuous
Density of phytoplankton in a sample of seawater is an example of a ___________ variable
numerical continuous
With inferential statistics we can use
Sample statistics to estimate population parameters.

What type of variable is displayed in this plot?
categorical

How many (and what types of) variables are displayed in this plot?
2 categorical grouped bar plot

How many (and what types of) variables are displayed in this plot?
2 categorical, Numerical
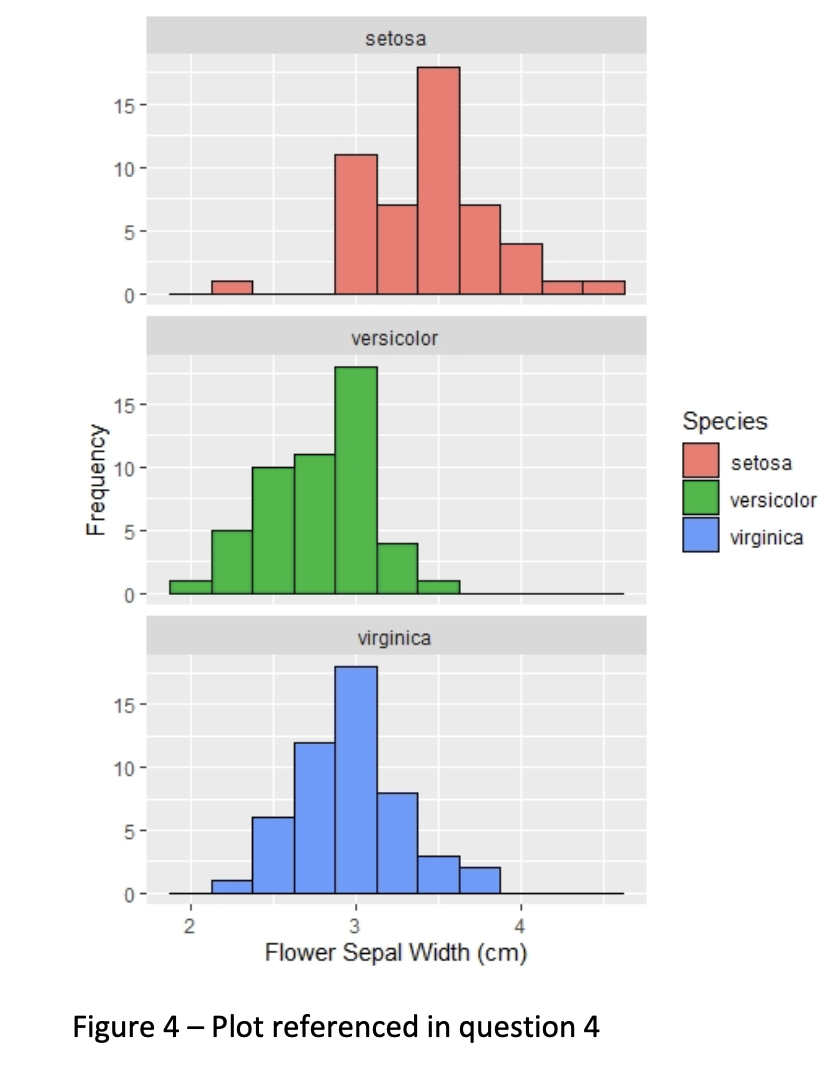
How many (and what types of) variables are displayed in this plot?
2 variables numerical stacked histogram
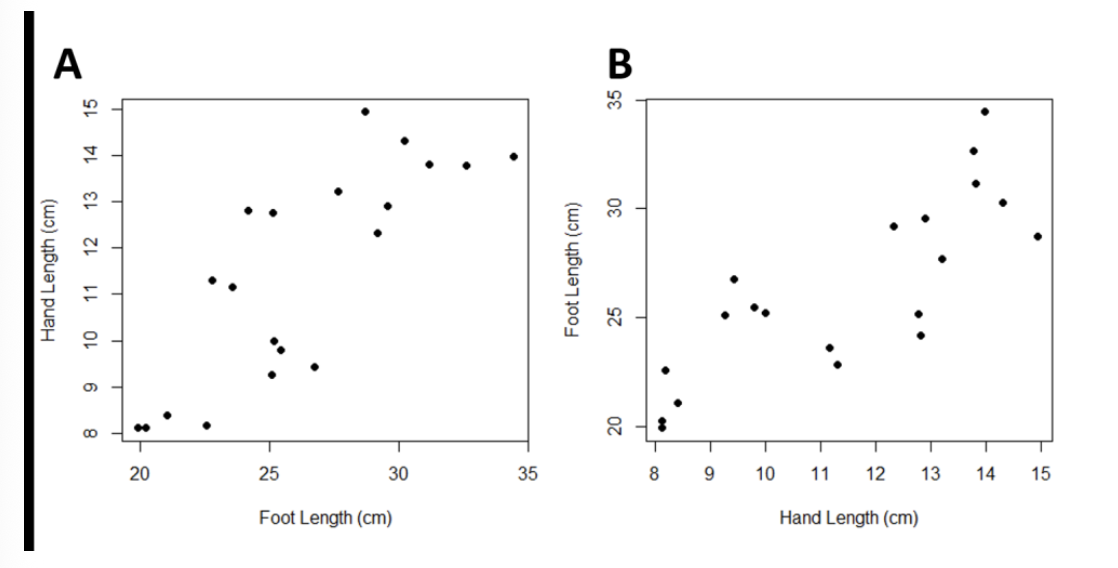
Plot A and B were made with the same data, but the variables were plotted on different axes in each plot. If we calculated the correlation coefficient (r) for each plot, you would expect:
Would be exactly the same for both plots
When creating a scatterplot to go along with a simple linear regression analysis
the independent variable should be on the x six and the dependent variable should be on the y axis
when creating a scatterplot to go along with a correlation analysis
The explanatory variable should be on the x-axis, and the response should be on the y-axis

Plot A and B were made with different data sets. If we calculated the correlation coefficient (r) for each plot, which r value would be closer to 0?
A

Plots A and B were made with different data sets. Guess the two correlation coefficients (r):
Plot a: -0.85,-0.80 to -0.90. Plot b: 0.99 to 1.00

Plot A and B were made with different data sets. Pick the most accurate statement.
?
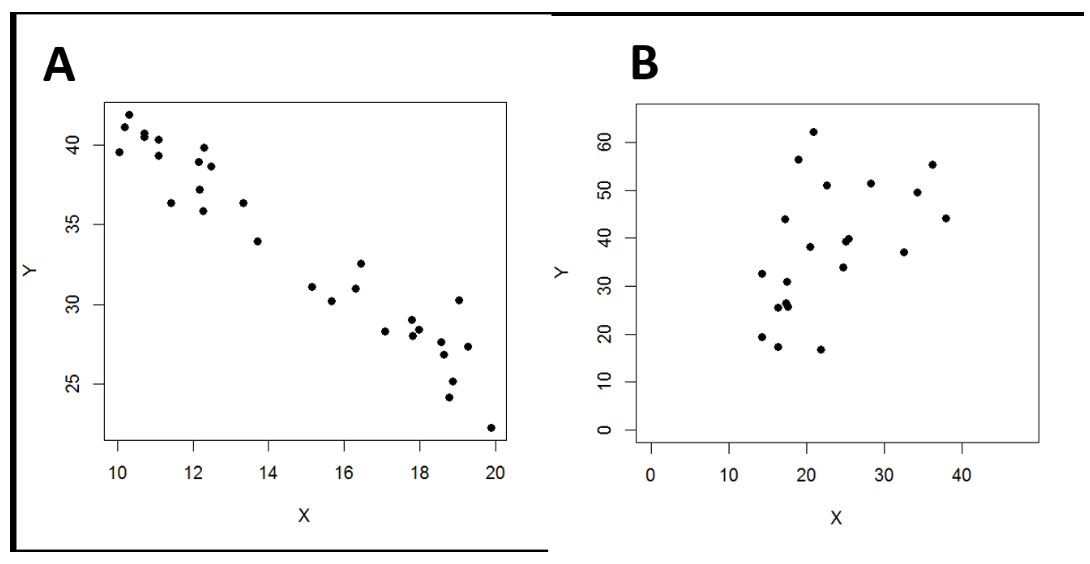
Plot A and B were made with different data sets. If we calculated the correlation coefficient (r) for each plot, which r value would be closer to 1?
B

Plot A and B were made with different data sets. If we calculated the regression R-squared value for each plot, which R-squared value would be closer to 1?
A

Plot A and B were made with different data sets. If we calculated the regression R-squared value for each plot, which answer appears to be most accurate:
A

Plot A and B were made with different data sets. If we fit a simple linear regression line to the data in each plot, which statement appears to be most appropriate:
?
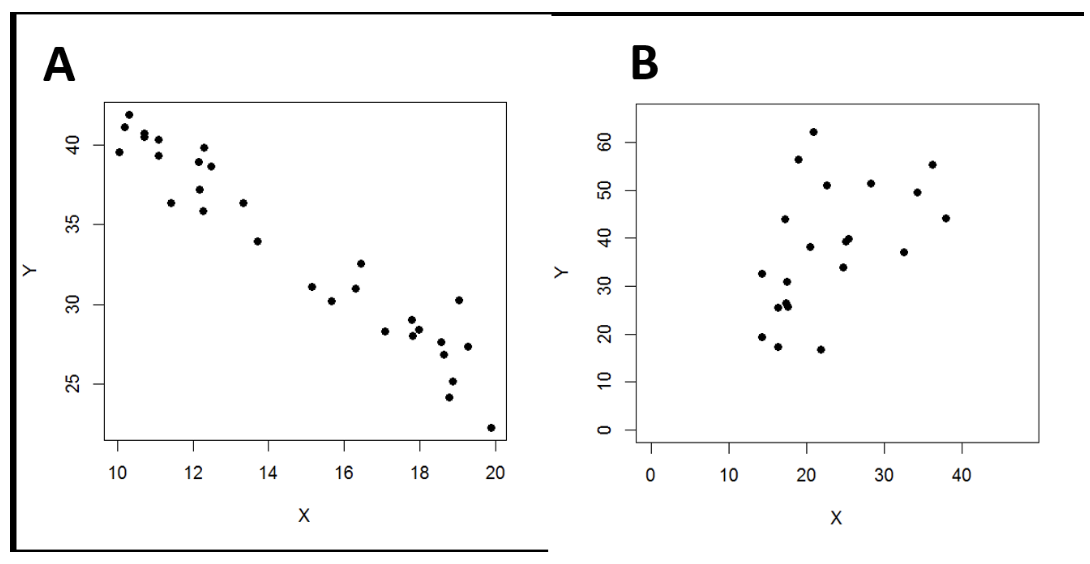
Plot A and B were made with different data sets. If we fit a simple linear regression line to the data in each plot, which answer appears to be most accurate:
?

What is the rate described by this regression line equation?
0.22 mm per year

What is the y-intercept described by this regression line equation?
55.9 mm

If you were interested in using the given equation to predict ear length in a population, what would be the appropriate age range in which to make those predictions?
30 to 95 years old
Dr. Bobich (CPP Biological Sciences Department) has a burning desire to be able to predict the heights of trees on CPP campus by using their trunk diameter. In order to do this he first goes out on a Saturday, randomly selects 83 trees, and measures the height and diameters of each of them. He then would need to run what type of analysis using these data in order to accomplish this?
Dr. Questad (CPP Biological Sciences Department) wants to be able to determine if there is a relationship between the abundance of native plant species and invasive plant species in the Voorhis Ecological Reserve on CPP campus. During her lunch break, she goes out to the Voorhis and randomly samples 30 plots (1 m-sqrd each) of habitat. She counted all native species as "natives" and all invasive species as "invasives." What type of analysis would she need to run on the data in order to accomplish this (note: she just wants to see if there is any relationship between the two variables at this early stage in the research, not make predictions)?
Dr. Questad (CPP Biological Sciences Department) wants to be able to predict if the height of black mustard is affected by the amount of light available to it in the field. During her lunch break, she went out to the Lyle Center and randomly sampled the height of 30 mustard plants growing in the open. She also measured the strength of light available for each of those plants. What type of analysis would she need to run on these data in order to answer her question?
Dr. Bobich (CPP Biological Sciences Department) has a burning desire to determine if there is a relationship between the photosynthetic rate of Oak leaves and the size of the leaves in the Voorhis Ecological Reserve found on CPP campus, although he doesn't suspect a cause-effect relationship at this early stage in the research. In order to do this he first goes out in his free
time on a Sunday, randomly selects a leaf from each of 30 trees, and measures both the
photosynthetic rate with his LI 6800 portable photosynthesis system and the surface area of
each leaf. He then would need to run what type of analysis using these data in order to
accomplish this?
Which of the following statements about regression R-squared values is FALSE:

For the data presented above, which would you expect to have a larger R² value?
B
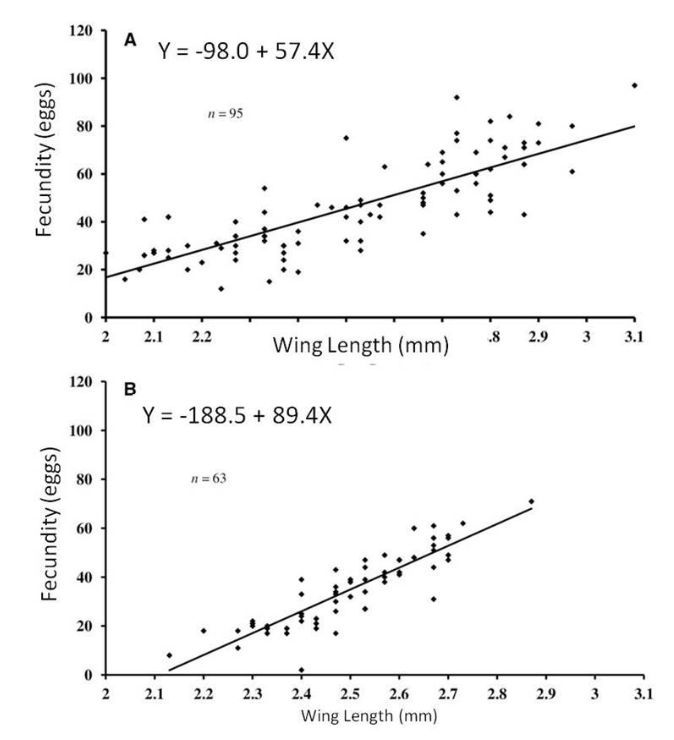
For the data above, in which regression equation does Fecundity increase at a greater rate with changes in Wing Length?
B

Which species (plot A or B) has a lower predicted fecundity at a wing-length of 2.2 mm?
B

Which species (plot A or B) has a greater variability in fecundities for a given wing-length?
B

Based on the analysis presented above pick the best answer:
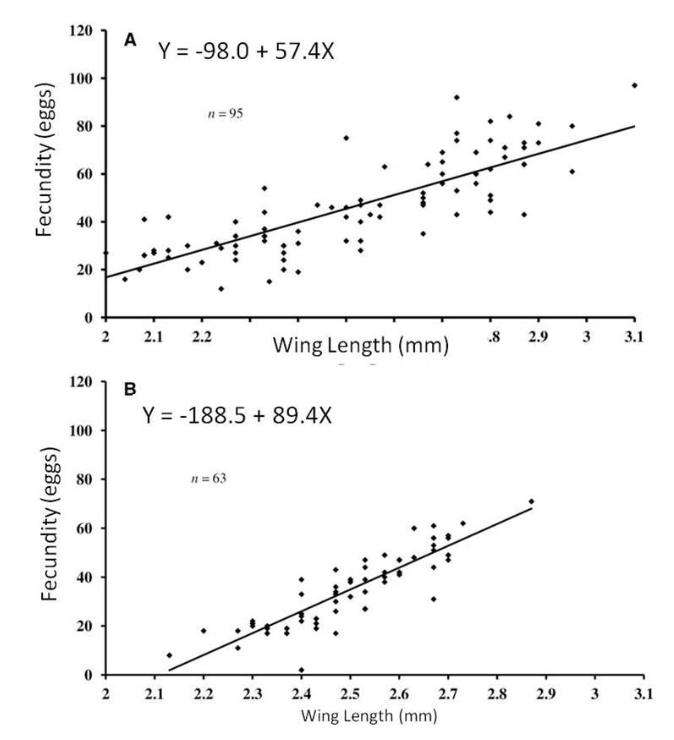
Which species (graph A or B) has a higher slope value?
B

Does there seem to be a relationship between variables X and Y?
no

If you were to draw a regression line fit to data presented above, what would the expect the slope of the line to be?
close to zero or slightly negative

In the graph above, what would be an appropriate estimate of the correlation coefficient (r)?
0

Choose the statement about this plot which is correct:
?
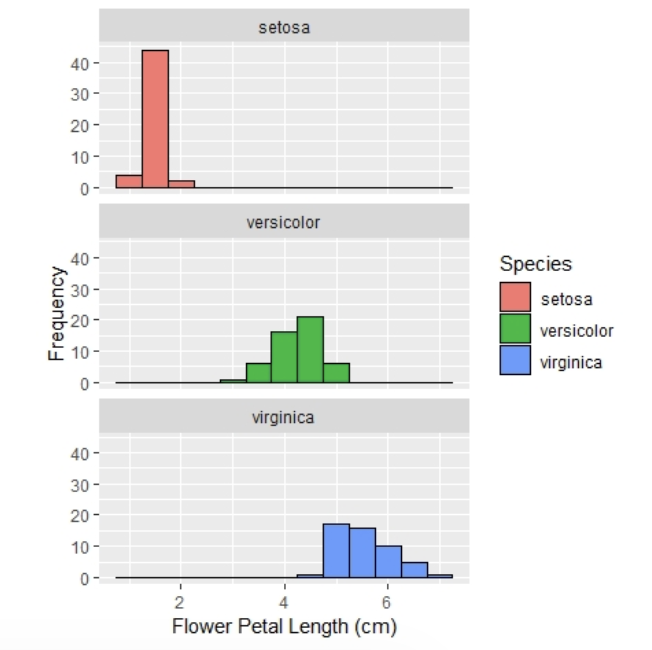
Based on the plot, order the standard deviations (sd) of [VARIABLE] from SMALLEST to LARGEST.
Setosa, versicolor, virginica
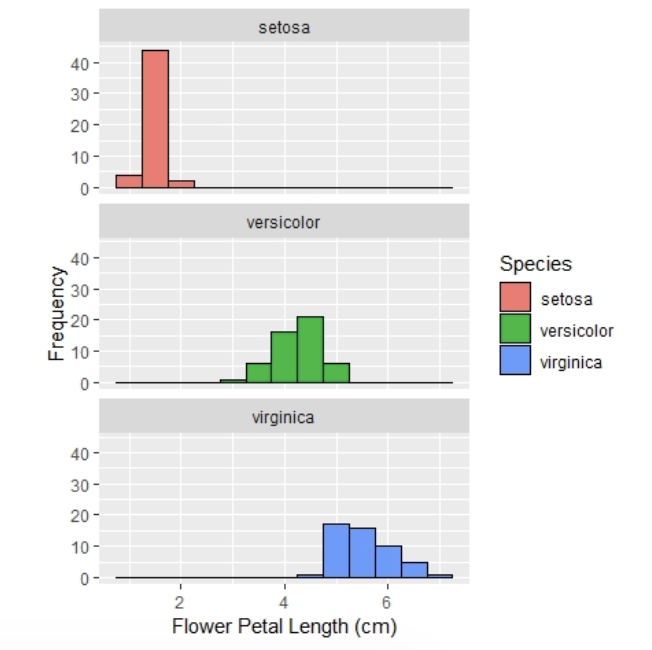
Choose the statement about this plot which is correct:
?

Of the three distributions, which would be described as the least symmetrical?
Virginia

Choose the statement about this plot which is correct:
?

Based on the plot, order the standard deviations (sd) of [VARIABLE] from SMALLEST to LARGEST.
Versicolor, virginica, setas

Choose the statement about this plot which is correct:
?

Of the three distributions, which would be described as the least symmetrical?
Versicolor

If standard deviations were calculated from the data in each of these plots:
The standard deviation of Histogram B is larger than the standard deviation of Histogram A

Which statement about these two distributions is most accurate?
A has a higher central tendency while B has a greater spread

If standard deviations were calculated from the data in each of these plots:
Histogram B has a larger standard deviation than Histogram A
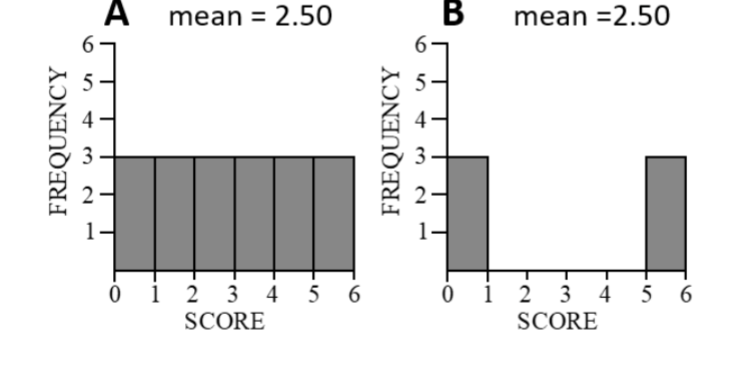
Which statement about these two distributions is most accurate?
2.50

If standard deviations were calculated from the data in each of these plots:
both plots are equal

Which statement about these two distributions is most accurate?
0.33
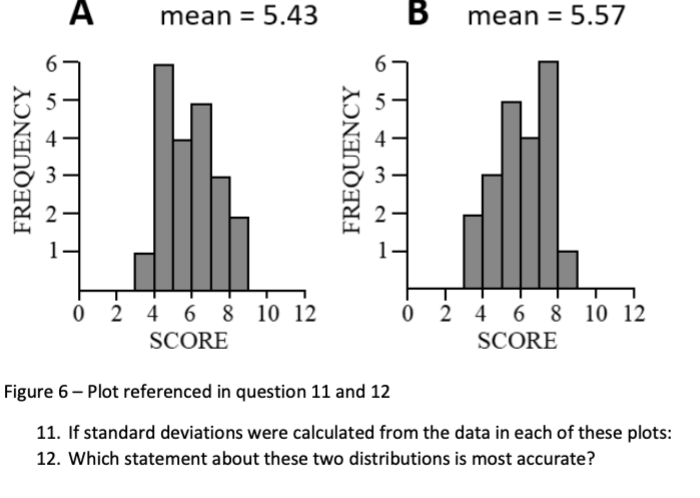
f standard deviations were calculated from the data in each of these plots:
both plots are equal

Which statement about these two distributions is most accurate?
5.43

If standard deviations were calculated from the data in each of these plots
Plot A is greater than the standard deviation of Plot B.

Which statement about these two distributions is most accurate?
A has a lower central tendency while b has a lower spread

if you envisioned the distribution of burrow lengths (histograms) for each species, the central tendency of goldspotted oak borer would be shifted to the right of polyphagous shot hole borer

Choose the answer that appropriately characterizes the data based on the statistics in the table.
?

Choose the answer that appropriately interprets the statistics in the table.
On average, Goldspotted Oak Borer (GSOB) larvae create longer burrows with less variation in length, whereas Polyphagous Shot Hole Borer (PSHB) larvae make shorter burrows that vary widely in size.
What percentage of the population distribution is located within 2 standard deviations (+/-) of the mean? (choose the closest answer)
95%
What percentage of the population distribution is located within 1 standard deviation (+/-) of the mean? (choose the closest answer)
68%
A standard error __________.
measures the standard deviation of a sampling distribution
An increase in the sample size will most likely ____________.
decrease the standard error and narrow the confidence interval,
Which of the following statements is NOT correct?
If the same data is used, error bars created to illustrate a 95% CI will be narrower than those illustrating ± 1 standard error from the mean
A histogram of measurements from your sample is the __________
sample distribution
Increasing your sample size will make your sampling distribution _________.
narrower and more tightly clustered
A 95% CI is roughly equal to _________.
Sample mean ± 2*standard error

In the plot the large circles are sample means and the error bars are 95% confidence intervals. Based on the information in the plot what can you conclude?
The mean cell count for the Child group is significantly higher than the Parent group because their 95% confidence intervals do not overlap.

How many (and what types of) variables are displayed in this plot?
The plot displays two variables: one categorical variable (Group) on the x-axis and one numerical variable (Cell Count) on the y-axis.
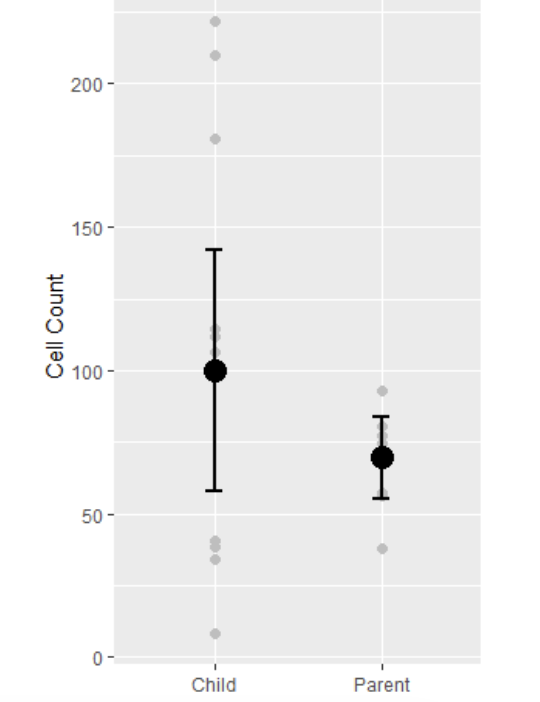
In the plot the large circles are sample means and the error bars are 95% confidence intervals. Based on the information in the plot what can you conclude?
Two means are not significantly different

In the plot the large circles are sample means and the error bars are 95% confidence intervals. Based on the information in the plot what can you conclude?
The true mean cell count for the "Child" group is not significantly different from the true mean cell count for the "Parent" group at a 95% confidence level.
A frequency distribution of a statistic (e.g., mean) is the __________.
Sampling distribution

How many (and what types of) variables are displayed in this plot?
2 variables both numerical

What is the effect size of this analysis according to this R output?
unstandardized effect size

This R output indicates ____________.
statistically significant difference

What is the Null Hypothesis associated with the statistical test that produced this R output?
The Null Hypothesis H0 is that there is no true difference in the mean weights between the Control group and the Temp group
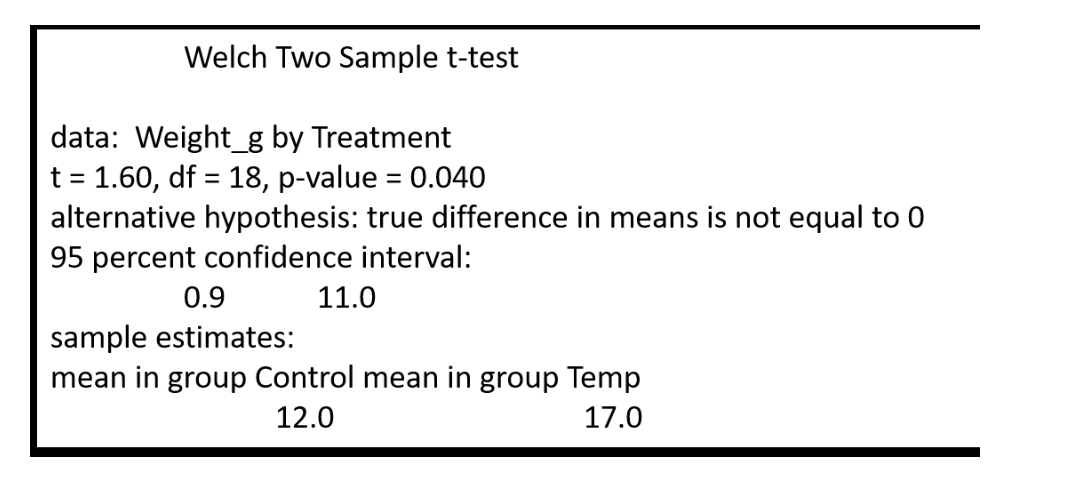
Which answer provides an appropriate interpretation of the p-value from this R output?
There is a 4.0% probability of obtaining a test statistic as extreme as or more extreme than t = 1.60, assuming that the null hypothesis is true.
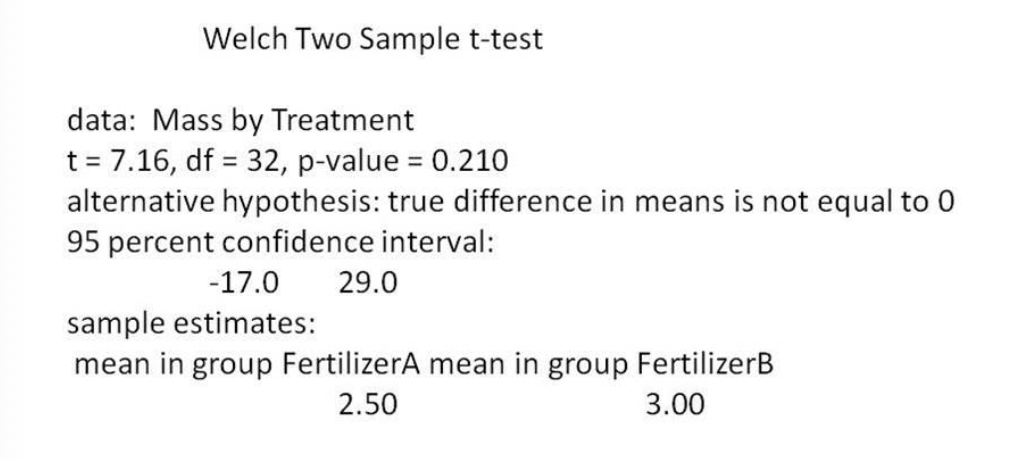
What is the effect size of this analysis according to this R output?
Does not report the effect size

This R output_______indicates.
There is no statistically significant difference between the means of Fertilizer A and Fertilizer B.
A generalized null hypothesis for a two-sample t-test is which of the following?
There is no significant difference between the means of the two groups.