L6 Federal Reserve Policy and an Expanded Loanable Funds Model
 Call Kai
 Learn
 Practice Test
 Spaced Repetition
 Match
 Flashcards
 Knowt Play
1/14

There's no tags or description
Looks like no tags are added yet.
15 Terms
three interest rates, and the fourth
r_f is the real short term federal funds rate
r_g is the real long term govt bond rate
r_c is the real long term corporate borrowing rate
also have r_tb which is the real short term treasury bill rate
which interest rates does the fed directly control
just r_tb and r_f
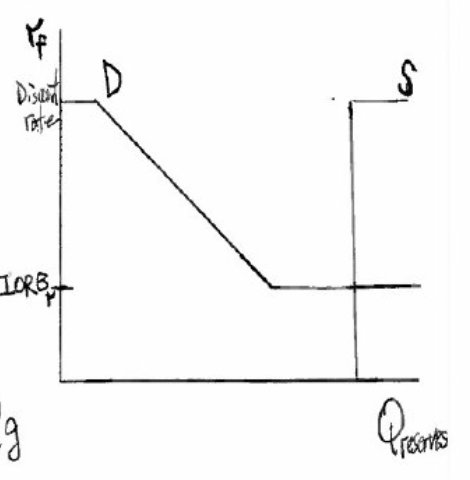
Short-term reserves and Federal Reserve policy graph
vertical axis is the real federal funds rate, r_f
horizontal axis is the quantity of reserve balances
the fed can influence r_f thru IORB.
The reserve demand curve is downward sloping then becomes flat. It represents banks’ demand for reserve balances. it’s first downward sloping becuase when federal funds rate decreases, the banks are more willing to increase their reserve balances. But when reserves become ample, banks have enough in reserves to cover their daily payments, so they are unwilling to pay any higher of an interest rate for more reserves.
The reserve supply curve is a vertical line and respresents the total quantitiy of reserve balances being supplied to the banking system by the Fed.
how are r_tb and r_f related
r_tb tracks r_f
long term govt bonds graph
y axis is r_g the real govt bond yield
x axis is Qg the quantity of govt bond financing
there are two curves:
Dg is the govt demand for bond financing
Sgh is the funds households supply to the govt bond market
Dg is a vertical line because for a given budget and financing plan the govt has a specific amount it needs to borro. That amount doesnt change if the borrowing rate moves
if the govt wants to borrow more the vertical line shifts right
sgh is upward sloping line because as yields go up ppl willing to buy more bonds.
if households want to invest more in govt bonds it shifts right (at a given rate, they are willing to supply more)
the intersection teremines r_g and Qg at equil.

corporate bonds graph
y axis is r_c the real borrowing rate corporations face
x axis is Qc, the quantitiy borrowed by corporations
the Dc is corporate demand curve for financing. it slopes downward because as r_c goes up, Qc would go down
the Sch is the supply of household funds to the corporate bond market. it slopes up because as r_c goes up, ppl are more willing to supply money because they’ll make more off of it.
the intersection determines equil. of r_c and Qc

simplification we make
IORB = i_f = i_tb
ie the Fed can use IORB to control the nominal interest rates for federal funds rates and the treasury bill.
have to convert these to real by subtractin inflation or expected inflation
changes mirror each other exactly without having to deal with fisher. Ie, a decrease by 1% in one results in a decrease by 1% in all.
movements vs shift for the corporate bonds graph
movements is just changing interest rates for exmaple higher interest rates means less wanting to take out loans so it’s a movement.
shifts can be caused by technological innovation that increases profitability meaning you can make more loans even at the same interest rate, so it’s a right shift in the downard sloping corporat ebonds demand curve.
6 step process of how the Fed affects the economy
Fed changes IORB
That changes r_f
that changes the borrowing rate corporations face
changes C, I
changes the economy’s overall growth rate, deltaY
changes the economy’s position relative to Y* and U*
influences wage and inflationary pressure
3 ways the Fed’s control might not work
the fed can cahnge short term rates but the borrowin rates that matter might not move as intended, as in a financial panic where corporate bond rates conitnue to increase as distrust increases
borrowing rates chan change but investment and therefore GDP don’t respond accordingly because firms are still pessimistic about future sales
investment and gdp can respond, but inflation might not because it is affected by many other things, eg. oil or shipping disruptions
how can a Fed cut to a short term interest rate affect corporate borrowing?
Fed cut means they get less return on the short term investment, might reallocate thier savings into corporate bonds, puts downward pressure on corproate interest rate
ie fed easing shofts houehold supply curves right
why does more demand for bonds lower their yields
when more households pruchase bonds, the market prices of existing bonds rise, so their on paper yield goes down relative to what you buy the bond for now
what happens to this corporate bonds graph when businesses become pessimistic about the future
they want to borrow less.
therefore, the downward sloping demand curve shifts left.
this causes equil. r_c and Qc to go down
what happens to this corporate bonds graph when households are unwilling to take on extra risk in a downturn
left shift on the upward sloping supply curve.
causes the equil point to have higher r_c and lower Qc
what happens to the government long term bonds graph during times of uncertainty
households increase their demand for govt bonds (are safer) over corporate bonds.
right shift in the upward sloping household supply line while the vertical govt line remains the same
causes equil. r_g to go down
contributes to increasing credit spread