compound flood hazard modeling
 Call Kai
 Learn
Learn Practice Test
 Spaced Repetition
 Match
Match Flashcards
 Knowt Play
1/119

There's no tags or description
Looks like no tags are added yet.
Name | Mastery | Learn | Test | Matching | Spaced | Call with Kai | Chat |
|---|
No analytics yet
Send a link to your students to track their progress
120 Terms
benefits of small floods
disease regulation, water regulation, water quality, flood supply, recreation
benefits of extreme floods
primary production, soil formation, drinking water, disease regulation, tourism
FEMA floodplains definition
any land area susceptible to being inundated by floodwaters from any source
BFE
base flood elevation
BFE def
height of floodwaters (flood depth) resulting from a 100-year flood event FROM MSL
floodway def
a designated area reserved to discharge the base flood (avoid constructions)
flood fringe def
an area that can contain slow-moving or standing water
pools def
places where water is stored
fluxes def
ways in which water moves among pools
climate change and human activities affect the water cycle in terms of
quantity, quality, timing, and use
natural functions of floodplains
water resources, ecological and biological resources, societal resources
urban development alters ___ and the natural functioning of floodplains
river flow
examples of human impacts on natural floodplains
diversion or obstruction of river flow (dams)
increase of flow depth and inundation extent (regrading or filling)
Human impacts on catchments/watersheds
Decrease of infiltration (impervious areas)
Decrease of evapotranspiration (deforestation)
Increase of surface runoff (faster flow transport)
pluvial flooding
intense rainfall (flash flooding) or long-sustained moderate rainfall.
fluvial flooding
accumulation of large volumes of excessive rainfall and snowmelt
coastal flooding
one or more combinations of high tides, storm surge, and waves that are superimposed on relative mean sea level.
Compound flooding
multiple (non-) extreme flood drivers that occur in combination or closely succession and cause greater impacts than any single source of flooding in isolation

what type of flooding
fluvial

pluvial
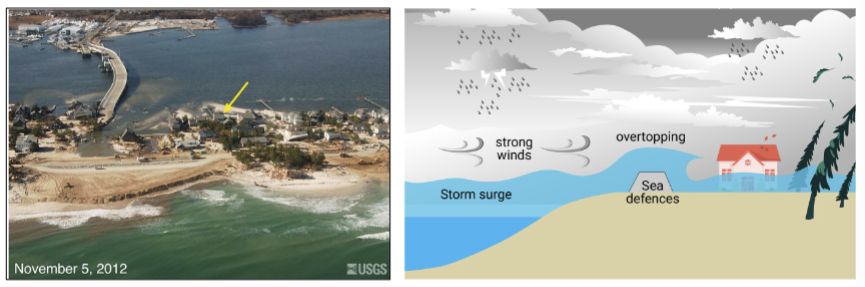
coastal

compound
Flood hazards
refer to the duration, depth, and velocity of floodwaters
Duration
length of time in which floodwaters from river discharge or water level exceed, or remain above, a given threshold
flood duration formula
volume / peak
Depth
vertical distance between water surface elevation (WSE) and ground elevation (GE) with respect to a common vertical datum (e.g., NAVD88)
depth equation
WSE - GE
Flood Velocity
average rate of floodwaters moving through a floodplain, river/tidal channel, inundated area, or drainage network

flood impacts
refer to fatalities, injuries, and extensive infrastructural damage
hydrodynamic flood impacts
force due to moving water
hydrostatic flood impacts
vertical and lateral forces due to standing water
debris Flood impacts
floating and rolling debris from floodwater
soaking Flood impacts
damages to building materials (wood)
sediment Flood impacts
trapped in building material and structures
infrastructure Flood impacts
damage to critical infrastructure and utlities
safety and health Flood impacts
mental stress, fatigue, mold, mosquitos, etc.
V zones
coastal areas of high hazard. The “E” in VE indicates that a predicted elevation of water (e.g., the top of the waves in a 1%-annual-chance flood) has been determined and is designated on the Flood Insurance Rate Maps (FIRM).
A Zones
areas subject to inundation by a 1%-annual-chance flood (e.g., fluvial or coastal) that do not meet any of the criteria for being designated as a V Zone.
A Zones in coastal areas
subject to breaking waves (heights < 3 ft or 0.91 m), storm surge, and wave runup (depth < 3 ft) that may cause erosion and scour.
The Limit of Moderate Wave Action (LiMWA)
boundary between moderate (MoWA) and minimal wave action zones (MiWA)
X Zones
outside the areas inundated by the 1%-annual-chance flood. Zones beyond the SFHA limit.
Shaded X Zones
areas subject to inundation by the 0.2%- annual chance flood.
Unshaded X Zones
areas where the annual probability of flooding is less than 0.2%.
AO Zones
areas of 1% annual chance of shallow flooding, usually sheet flow on sloping terrain, where average depths are between 1 and 3 feet.
AH Zones
Areas with a 1% annual chance of shallow flooding, usually in the form of a pond, with an average depth ranging from 1 to 3 feet
AR Zone
Areas with a temporarily increased flood risk due to the building (or restoration) of a flood control system such as a levee or a dam
Exceedance Probability (EP)
chance that one or more floods occurring during any period (n) will exceed a given flood threshold
EP can be approximated with the
binomial distribution
according to FEMA, floodplain management is a
community-based effort to prevent or reduce the risk of flooding, resulting in a more resilient community
floodplain detrimental impacts
infrastructure damage, human displacement, financial loss, waterborne diseases
floodplain beneficial impacts
groundwater recharge, nutrient and sediment distribution, soil fertilization
floodplain inconsequential impacts
temporary disruption of services, dirty driveways, puddle formation, pedestrian detours
structural floodplain management measures are
designed to keep floodwaters away from building infrastructure
nonstructural flood management measures are designed to
keep building infrastructure away from floodwaters
FEMA management strategy 1
avoid hazardous , uneconomic, or unwise use of floodplains through floodplain regulating and redevelopment of policies
floodplain regulation
zoning codes to steer development away from hazardous areas or natural areas deserving preservation, establishing rules for developing subdivisions, and rigorously following building, health, and sanitary codes.
(Re)Development of policies
considering the design and location of public services, utilities, and critical facilities
Land acquisition
preserving open space and permanently relocate buildings away from floodplains.
restore and preserve
natural resources and functions of floodplains
flood-proof building
elevating new buildings and retrofitting existing ones
fema flood management strategy 2
Develop projects/infrastructure that control floodwater.
Dams and reservoirs along streams/rivers to store excess water upstream from developed areas.
Dikes, levees, and floodwalls to keep water away from developed areas
Channel restoration or alteration to
avoid overbank flooding
(FEMA strategies) runoff control measures
for developed areas
(FEMA strategies) land treatment to
hold more water through infiltration
(FEMA strategies) detention ponds to
store on-site excess runoff
(FEMA strategies) flow diversion
around developed areas
(FEMA strategies) strategy 3
Assist individuals & communities to prepare for, respond to, and recover from a flood by:
-Providing information and education to assist self-help and protection measures.
-Following flood emergency measures to protect people and property.
-Providing financial support through disaster assistance, flood insurance, and
tax adjustments.
-Preparing post-flood recovery plans and programs to help people rebuild and implement mitigation measures to protect against future floods
(FEMA strategies) strategy 4
Renew the vitality and purpose of natural floodplains through:
-Land use regulation: protect floodplains, wetlands, and coastal barriers.
-Policies: design and location of public services, utilities, and critical facilities.
(FEMA strategies) preservation
land acquisition, open space, permanent relocation of buildings, restoration of floodplains, wetlands, and habitats
(FEMA strategies) information and education
make people aware of natural floodplain resources and functions and how to protect them.
(FEMA strategies) tax adjustments
provide a financial initiative for preserving lands or restoring lands
(FEMA strategies) beach nourishment
protect inland development and maintain natural flood protection features
flood events are characterized using
spatial, temporal, or spatiotemporal data which include gridded and time-series data
spatial data examples
Satellite imagery
Radar data
LiDAR data
Drone imagery
temporal data examples
Tide-gauge data
River-gauge data
Rain-gauge data
High-water marks
Spatiotemporal data examples
Reanalysis products (CFSR – ERA-5)
Inundation maps (hydrodynamic models
Complete duration series:
all available data records
partial duration series
data records that exceed a given threshold value
Annual exceedance series
partial duration series in which the number of data values is equal to the number of years
extreme value series
partial duration series containing the largest or smallest values in equal intervals
baseflow
low flow rate added to a channel from the subsurface (e.g., groundwater)
bankfull flow
flow rate that fills a channel to its maximum capacity
flood flow
flow rate that overtops the natural/artificial banks
peak flow
maximum flow rate within a period of interest (e.g. annual peak flow)
The time between occurrences (X ≥ x T) is defined as
the recurrence interval (𝜏)
return period (T)
average of recurrence intervals E(𝜏) (T is the average time until the next occurrence of an extreme event.)
streamflow that has a return period of 100 years is called the
100-year flood
an area that gets inundated from a 100-year streamflow is considered the
100-year floodplain
the 100-year floodplain is used in practice for
flood hazard management
time series examples
river flow, rainfall, water level
in flood frequency analysis, we work with
continuous variables (so data points are independent)
histograms are
graphs that show the frequency distribution of a random variable. Histograms classify data into various “bins” or “range groups” and count how many data points belong to each of those bins
kernel density estimation is a
nonparametric method to estimate the probability density function of a random variable
univariate analysis in flood modeling
analysis of flood return periods for independent variables
block maxima (BM) consists in
dividing data records to nonoverlapping periods of equal size or duration (blocks)
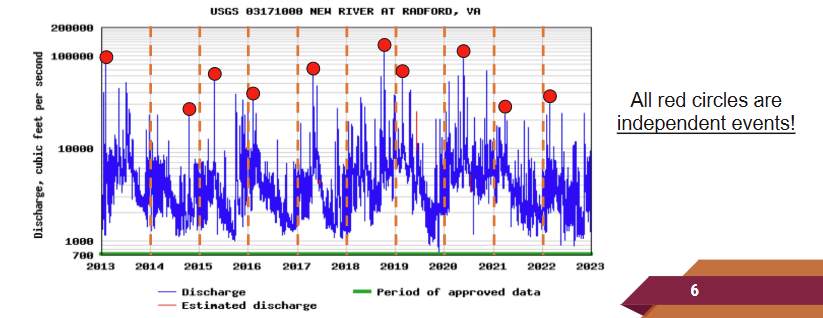
selecting the maximum data record from each period is referred to as
annual maxima (AMAX)
BM ensures that extreme data are
independent
BM ignores
other extreme values within the same block that might be even higher than those from other blocks
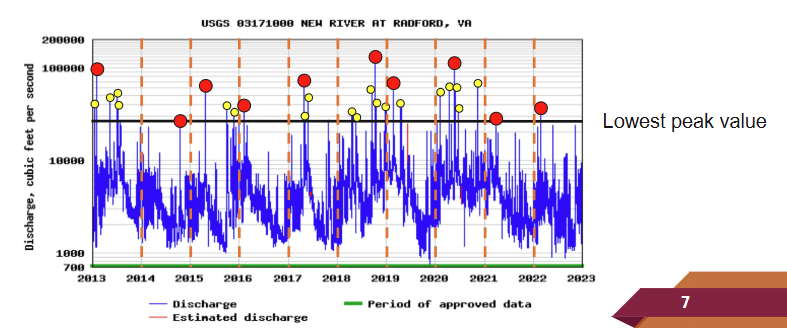
peaks-over-threshold (POT) samples data records by
selecting extreme values that exceed a given threshold (e.g. percentiles -% of data below or at a given threshold)
POT method requires that extreme values are
independent and identically distributed (IID)