Case Study #2: What are the actual and potential impacts of climate change in BC? part 2
 Call Kai
 Learn
 Practice Test
 Spaced Repetition
 Match
 Flashcards
 Knowt Play
1/31

There's no tags or description
Looks like no tags are added yet.
32 Terms
The Global Carbon Cycle
• The carbon cycle is one of many matter cycles in the Earth system (e.g. water cycle,
nitrogen cycle)
• Any cycle is made up of a complex set of interconnected processes:
• Something that affects one process will in turn affect other processes in
the cycle
• Things that humans add to the environment can upset the balance of
these cycles.
What drives the Global Carbon Cycle imbalance?
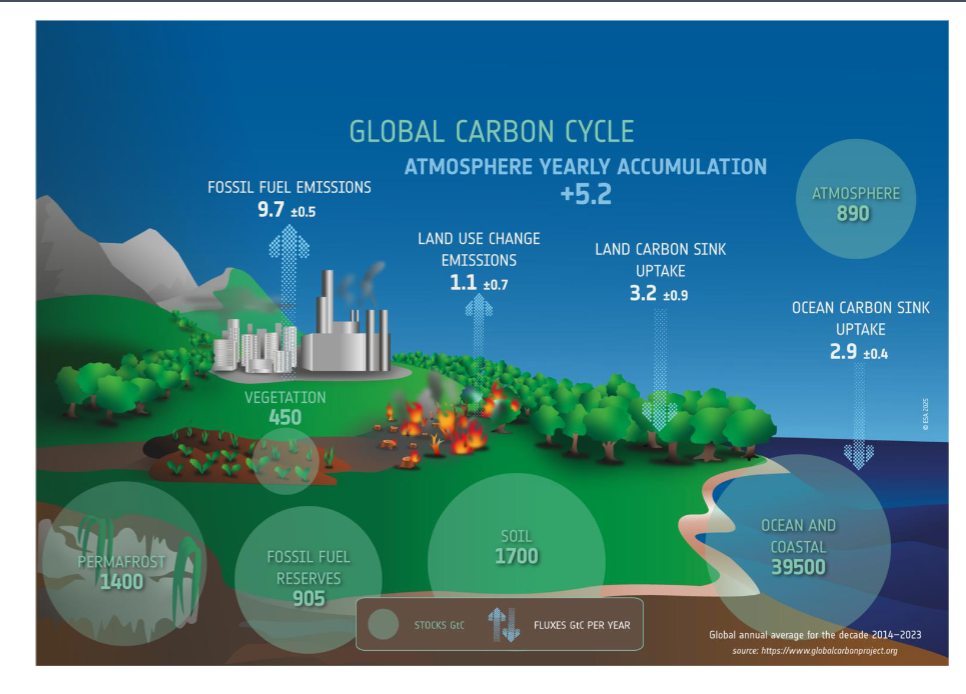
Human emissions outpace natural absorption, leaving excess carbon trapped in the atmosphere.
Main Reservoirs (Stocks)
Oceans: Largest active carbon pool.
Soil & Permafrost: Massive underground storage.
Atmosphere: Overhead greenhouse gas pool.
Yearly Movement (Fluxes)
Emissions: +10.8 GtC/yr added by humans.
Sinks: -6.1 GtC/yr absorbed by nature.
Net accumulation: +5.2 GtC/yr stays overhead.
Matter cycles have sources and sinks (or stores)
Sources (The Givers): They pump matter out. For example, burning fossil fuels is a source that releases carbon gas into the air.
Sinks & Reservoirs (The Takers/Storers): They pull matter in and hold onto it. For example, a forest is a sink/reservoir because trees absorb and store that carbon in their wood.
Carbon moves through each sphere in the earth system
Biosphere
• Carbon is found in the form of organic compounds trapped in living organisms
and in the soil.
Lithosphere
• Carbon is held in carbonate rocks and other materials like coal.
Hydrosphere
• Carbon dissolves in the water to form carbonic acid
Atmosphere
• Carbon is mostly in the form of CO2 (carbon dioxide) and CH4 (methane
What is a Gigatonne of Carbon (GtC), and how does it apply to the Global Carbon Cycle diagram?
The Unit Math
1 GtC = 1 Billion Metric Tonnes
In grams: (10 (15) grams (1,000,000,000,000,000 g)
Application to Diagram
Stocks (Circles): Total mass stored in a reservoir.
Example: Atmosphere (890 GtC) means 890 quadrillion grams are stored overhead.
Fluxes (Arrows): Rate of movement per year (GtC/yr).
Example: Fossil Fuel Emissions (9.7 GtC/yr) means 9.7 quadrillion grams are added annuall
Which natural sink holds the most carbon, and what are the three reasons why?
The Ocean is the largest natural sink, holding 39,500 GtC (over 40 times more than the atmosphere).
Why it holds so much:
Chemical Solubility: \(CO_{2}\) reacts with saltwater to form stable carbonate ions, letting the water absorb massive amounts.
Deep Ocean Storage: Cold, deep ocean currents trap dissolved carbon away from the atmosphere for centuries.
Biological Pump: Marine life absorbs \(CO_{2}\) at the surface; when they die, their shells and remains sink and bury carbon on the seafloor.
How carbon moves through
the carbon cycle:
Atmosphere & Biosphere
The magical “plant diet”:
• Green plants take in atmospheric CO2 and combine it with water to make carbohydrates through photosynthesis – this is how plants grow and gain mass.
What terrestrial processes are shown in this local carbon cycle diagram, and how do they move carbon?
This diagram highlights how carbon flows between land, plants, human activity, and the atmosphere.
Carbon Drawdown (Sinks)
Photosynthesis: Plants pull (CO2) from the atmosphere to build Plant biomass.
Soil Carbon: Plants absorb carbon while they are alive, Dead roots and leaves bury it when they decompose underground, The dirt locks it away into long-term storage
Carbon Release (Sources)
Plant Respiration: Living plants release some (CO2) back into the air as they break down sugars for energy.
Decomposition: Microbes break down dead organic matter in the soil, releasing (CO2).
Anthropogenic Carbon: Human factories burn fossil fuels, pumping extra, unnatural (CO2) straight into the atmosphere.
Rivers: Water systems wash dissolved organic carbon off the land and transport it toward oceans.

How carbon moves through the carbon cycle: Atmosphere & Biosphere How does the carbon return to the
atmosphere?
• Plants (and the animals who eat
them) can break the carbohydrates
down into carbon dioxide and
water: the CO2 is released back to
atmosphere through respiration.
• When plants die, bacteria and fungi
can break down the carbon and
convert it to CO2 through
decomposition
How carbon moves through the carbon cycle: Atmosphere & Biosphere. How does the carbon return to the
atmosphere?
Cellular Respiration: Plants and animals break down glucose for energy and exhale \(CO_{2}\) as a waste product.
Decomposition: When plants and animals die, fungi and bacteria break down their organic matter, releasing stored carbon back into the air as \(CO_{2}\) (or methane).
Combustion (Burning): Wildfires or human activities (like slash-and-burn agriculture and burning fossil fuels) rapidly burn organic matter, instantly converting plant carbon into \(CO_{2}\) gas. slash-and-
burn in Rondonia, Brazil: 1975-2015:
What are two distinct ways that slash and burn agriculture impacts the global carbon cycle?
Immediate Carbon Release (Combustion): Burning trees instantly converts stored organic carbon into \(CO_{2}\) gas, heavily increasing atmospheric greenhouse gases.
Loss of Carbon Absorption (Deforestation): Removing living vegetation destroys active photosynthesis sinks, permanently reducing the land's ability to pull future \(CO_{2}\) out of the atmosphere.
How carbon moves through
the carbon cycle:
Atmosphere & Hydrosphere
How do oceans regulate Earth's carbon dioxide (\(CO_{2}\)), and what is the "soda analogy"
The Sponge: Oceans cover 70% of Earth and absorb massive amounts of atmospheric \(CO_{2}\) through biological processes (photosynthesis/respiration).
The Cost: Absorbing too much \(CO_{2}\) causes ocean acidification, which harms marine life.
The Soda Analogy: Just like shaking a bottle of soda forces gas out, strong ocean currents and waves agitate the water, causing the ocean to release stored \(CO_{2}\) back into the air.
How carbon moves through the carbon cycle:
Lithosphere & Atmosphere
Young Fast Carbon (The Banana): Carbon stored in living plants and organisms. It cycles rapidly, moving easily into and out of the atmosphere through photosynthesis, respiration, and decomposition.
Old Slow Carbon (The Coal): Carbon trapped deep underground in fossil fuels (oil, coal, natural gas) for millions of years. It rarely enters the cycle naturally.
The Human Impact: Digging up and burning "old slow carbon" unlocks it, forcing massive amounts of extra, ancient carbon into the atmosphere as \(CO_{2}\).
Based on the provided chart, what is the general trend in the sizes of carbon sources and sinks over time (from 1850 to the present)?
Sources (Above 0): Fossil fuel emissions have grown exponentially since 1950, while land-use emissions have remained relatively steady.
Sinks (Below 0): To balance the massive spike in emissions, natural land and ocean sinks have expanded their carbon uptake.
The Consequence: Because natural sinks cannot keep up with the scaling emissions, atmospheric growth (carbon left behind in the air) has accelerated rapidly.

How is the global carbon budget changing
over time?
In this chart:
• Human emissions of carbon have negative values since those processes represent a loss of carbon from a particular sphere (i.e., the burning of fossil fuels releases carbon from the lithosphere, which is acting as a carbon source).
• A positive value indicates that a sphere has gained carbon (i.e. that sphere is acting as a carbon sink).

How is the global carbon budget changing
over time?
Growing Mirror Effect: The graph is symmetrical. As human carbon emissions (negative numbers, below zero) increase over time, carbon gains in the reservoirs (positive numbers, above zero) grow at an identical rate.
Fossil Fuel Dominance: The black region (Fossil-Fuel & Cement Emissions) expands massively over time, becoming the dominant driver of carbon loss from the Earth's crust.
Atmospheric Storage: The red region (Atmosphere) consistently claims a huge portion of the gains every year, showing that the sky acts as a major collector for unabsorbed emissions.
Biosphere Volatility: The green bars (Terrestrial Biosphere) fluctuate wildly from year to year, revealing how land ecosystems are highly sensitive to climate events like El Niño.

According to the Global Carbon Budget data, in which sink does the largest share of excess human carbon emissions end up each year?
The Atmosphere (Accumulates +5.2 GtC/yr)
Total Human Emissions: 10.8 GtC/yr (\(9.7\) from fossil fuels + \(1.1\) from land use changes).
Where it goes:
Atmosphere: ~48% (+5.2 GtC/yr) 🏆 Largest Share
Land Sink: ~30% (-3.2 GtC/yr)
Ocean Sink: ~27% (-2.9 GtC/yr)
Because natural land and ocean sinks can only absorb about half of our annual output, the atmosphere acts as the primary dumping ground for the remaining excess carbon.
How does increased atmospheric carbon change Earth’s climate system energy balance, and where does most of that trapped energy go?
1. Radiative Imbalance
The Cause: Greenhouse gases trap outgoing heat. Less energy exits into space than enters from the Sun.
The Current Imbalance: Earth traps an extra 0.6 W/m², constantly heating the planet.
2. Where the Energy Goes (The Sink)
Oceans (~90%+): The vast majority of trapped heat goes into the Upper Ocean (0–700m) and deep ocean.
Other Components: Only a tiny fraction of the excess energy actually stays in the atmosphere, land, or goes toward melting ice.
3. Observed Results
Ocean Warming: Widespread temperature increases in the upper 700 meters of ocean water, particularly intense in the North Atlantic.
Anthropogenic Climate Change: Carbon & Radiation Budgets
Human activities such as burning fossil fuels and deforestation are changing Earth’s carbon budget and radiation budget.
• We are removing “old, slow carbon” from its sink deep in the lithosphere and adding that carbon to the atmosphere as excess carbon dioxide.
• This excess carbon dioxide (along with other greenhouse gases) is causing an enhanced greenhouse effect.
• This is causing Earth’s lower atmosphere and surface to warm.
What are three primary methods scientists use to study climate and reconstruct past atmospheric changes?
1. Ice Cores (Past Gas Archive)
How it works: Glacial ice traps ancient air bubbles as it freezes.
What it shows: Direct snapshots of actual atmospheric gas concentrations from hundreds of thousands of years ago.
2. Tree Rings (Past Climate Proxy)
How it works: Trees grow a new ring every year. Wide rings show accelerated growth; narrow rings show restriction.
What it shows: Historical temperature variations and climate conditions across the tree's lifespan.
3. Direct Instrumentation (Modern Baseline)
How it works: Sensors at the Mauna Loa Observatory have continuously sampled air since 1958.
What it shows: Unmistakable, real-time proof of rapidly rising modern atmospheric \(CO_{2}\).
What does the Vostok Ice Core graph show about the relationship between global temperature and atmospheric \(CO_{2}\) over the last 450,000 years?
The Main Discovery
There is a near-perfect positive correlation between atmospheric \(CO_{2}\) levels and global temperatures. When \(CO_{2}\) rises, temperatures spike; when \(CO_{2}\) drops, the planet plunges into ice ages.
Key Chart Features
Cyclical Nature: The planet naturally undergoes large climate cycles roughly every 100,000 years.
The Historical Limits:
Peak Warm Periods (Interglacials): \(CO_{2}\) naturally topped out around 280–300 ppmv.
Deep Ice Ages (Glacials): \(CO_{2}\) dropped down near 180 ppmv.
Why This Matters Today
The graph shows that temperature and greenhouse gases are tightly locked together. Over nearly half a million years of natural history, \(CO_{2}\) levels never naturally exceeded 300 ppmv, highlighting just how unusual modern human-driven \(CO_{2}\) levels are.
Based on the Vostok ice core graph, by approximately how much did global temperature rise between the end of the last glacial maximum and the start of the Holocene?
Global temperature rose by approximately 9°C to 10°C over that 10,000-year transition.
How to read it from the chart:
Last Glacial Maximum (~20,000 years ago): Temperature anomaly sits at roughly -9°C.
Start of the Holocene (~10,000 years ago): Temperature anomaly rises to roughly +1°C.
The Math: From \(-9^{\circ }\text{C}\) up to \(+1^{\circ }\text{C}\) is a total warming change of 10°C.
At approximately what rate did global temperatures warm between the end of the last glacial maximum (20,000 years ago) and the start of the Holocene (10,000 years ago)?
Correct Answer: D. 0.001 C/year
How to calculate the rate:
Find Total Warming: At 20,000 years ago, the anomaly was \(\sim -8 C. At 10,000 years ago, it reached \(\sim 0\text{ }^\circ\text{C}\). This is a total change of \(8 C}\).
Find Total Time: (20,000years - 10,000 years = 10,000 years
Calculate Rate: Divide the temperature change by time:
8 C / 10,000 years =0.0008 C/year approx \ 0.001C/year
Question: Based on the chart, by approximately how much did global temperature rise between 1960 and 2025?
Global temperature rose by approximately 1.1°C to 1.2°C over that 65-year period.
How to read it from the chart trend line (red line):
In 1960 (Orange Line): The temperature anomaly sits at approximately +0.2°C.
In 2025 (Orange Line): The temperature anomaly reaches approximately +1.35°C to +1.4°C.
The Math: 1.35 - 0.2 C = {1.15C (or roughly 1.1°C to 1.2°C).

Which of the following statements about changes in Earth’s temperature in recent decades is correct?
A. There is no evidence for a systematic temperature change.
B. Earth is moving in the direction of a major glaciation.
C. The absolute change is small compared to a glacial cycle, but temperature is increasing at a high rate.
D. The absolute change is already larger than what has occurred since the last ice age.
C. The absolute change is small compared to a glacial cycle, but temperature is increasing at a high rate. Modern warming has a smaller total temperature change than an ice age cycle, but it is happening at a much faster speed.
An ice age cycle is a long-term natural pattern where Earth shifts between cold glacial periods (ice ages) and warmer interglacial periods.
What causes the sharp year-to-year temperature variations seen in the global climate record, such as the drop in 1992–1993 and the spike in 1998?
1. The 1992–1993 Temperature Drop (Volcanic Cooling)
The 1991 Mt. Pinatubo eruption blasted sulfur dioxide ash into the stratosphere. This formed reflective aerosols that blocked incoming sunlight, temporarily cooling the planet by about 0.2°C to 0.5°C.2. The 1998 Temperature Spike (Oceanic Warming)
A massive El Niño event in 1997–1998 released huge amounts of heat from the tropical Pacific Ocean into the atmosphere, causing global temperatures to temporarily surge.
Which of the following statements about the effect of \(CO_{2}\) in the atmosphere on climate is/are TRUE?
A. In the past, changes in \(CO_{2}\) have been associated with large swings in Earth’s climate.
B. Increased levels of \(CO_{2}\) in the atmosphere are correlated with increased temperature.
C. The greenhouse effect explains why climate can be affected by \(CO_{2}\).
D. All of the above are true.
D. All of the above are true.
climate change
Climate change, as defined by the Intergovernmental Panel on Climate
Change (IPCC), is a statistically significant variation in either the mean state of the climate or in its variability, persisting for an extended period – typically decades.
• The key parts of that definition are that it is a statistical variation over an extended period
Which has warmed more: the Northern Hemisphere (NH) or Southern Hemisphere (SH)?
Which warmed more?
The Northern Hemisphere (red line) has warmed significantly more than the Southern Hemisphere (blue line), especially since 1980.
2. What accounts for the difference?
Land vs. Ocean Distribution: The Northern Hemisphere contains the vast majority of Earth's landmass, while the Southern Hemisphere is dominated by vast oceans.
Heat Capacity: Land surfaces have a much lower heat capacity than liquid water. This means land heats up much faster and more intensely when absorbing excess thermal energy, whereas the deep oceans mix and store immense amounts of heat without changing surface temperatures as quickly.
According to this chart, which latitudinal zone in the Northern Hemisphere has experienced the most extreme warming and year-to-year volatility, and why?
The Arctic / High-Latitude Zone (90N–64N), shown by the dark blue line.
What the data shows:
Highest Peak: By 2016, it spiked nearly to a +2.0°C anomaly—far higher than any other zone.
Extreme Volatility: It undergoes dramatic year-to-year swings compared to the steady, stable trends seen in the mid-latitudes (64N–44N) and subtropics (44N–24N).

Why are high latitudes warming faster?
The Arctic is warming 3x faster than the global average (3°C vs 1.2°C since 1850) due to three main drivers:
Surface-Albedo Feedback: Melting white ice exposes dark ocean water, which absorbs heat instead of reflecting it. The White Shirt (Ice): Reflects the sun's rays away from your body, keeping you cool. The Black Shirt (Ocean): Absorbs the sun's rays, making you feel much hotter.
Water Vapor Transport: Winds push warm, moist air from the equator to the North Pole, trapping extra heat.
Winter Warming Spike: The exposed ocean releases trapped summer heat back into the atmosphere during the winter.

Arctic Amplification is the phenomenon where the Arctic region warms at a much faster rate than the rest of the globe.
What the data shows:
The Global Trend (Blue Line): Global temperatures have risen steadily, reaching a trend line anomaly of roughly +1.0°C by 2020.
The Arctic Trend (Red Line): Arctic temperatures have skyrocketed exponentially since 1990, surging past a trend line anomaly of +3.0°C by 2020.
The Ratio: The dashed linear trend lines show that since roughly 1990, the Arctic has been warming about 3 times faster than the global average.