Week 8 --- Univariate Analysis
 Call Kai
 Learn
 Practice Test
 Spaced Repetition
 Match
 Flashcards
 Knowt Play
1/26

Earn XP
Description and Tags
Univariate Analysis
27 Terms
descriptive statistics
data analysis used to describe a sample
inferential statistics
data analysis used to predict and infer about the variables
univariate statistics analysis
only one variable examined at a given time
bivariate statistics
two variables, examined in relation to each other
multivariate statistics
3 or more variables, in relation to each other
value distribution
frequency, central tendency, and variance
frequency
how often values occur
nominal and ordinal variables
frequency count
the total number of times a specific value, event, item, or behavior occurs within a given dataset or observation period
central tendency
how values of a variable cluster around a center point
mean, median, and mode
usually interval and ratio
proportion
(frequency count)/total sample
sample
the entire group
subsample
smaller group within the sample
variance
how values are spread in the data
summary of overall spread of all values from the mean
average distance of each value from the mean
standard deviation
square root of variance, a specific distance away from the mean, more commonly identifiable and translatable
frequency distribution
visual representation of all values in a data set
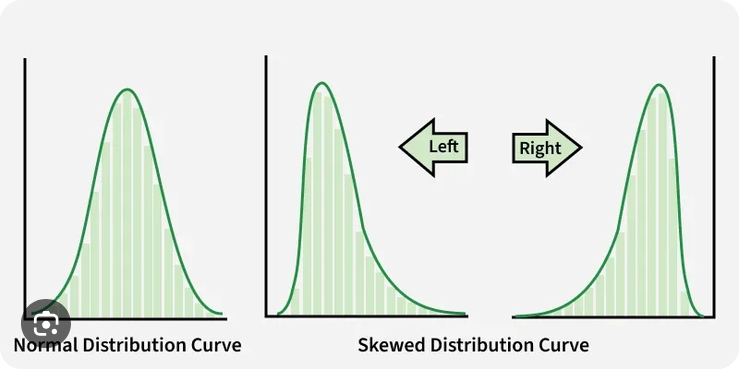
unimodal curve

bimodal curve

multimodal curve

symmetrical curve

skewed curve

kurtosis
a statistical measure that describes the "tailedness" of a data distribution
tells you whether a dataset has heavy tails (more extreme outliers) or light tails (fewer extreme outliers) compared to a normal bell curve
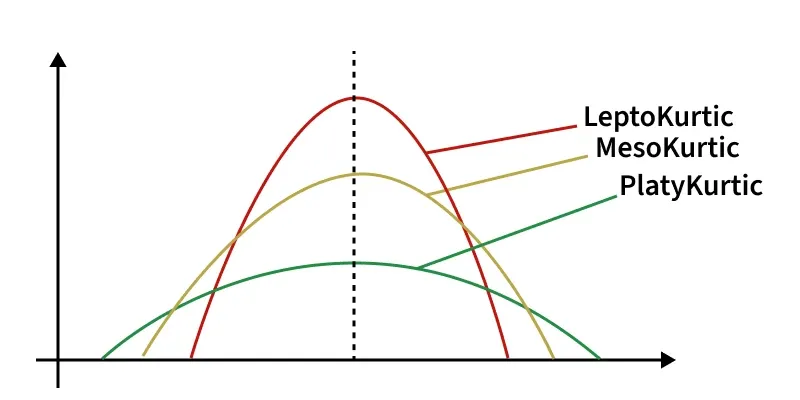
parts of a curve

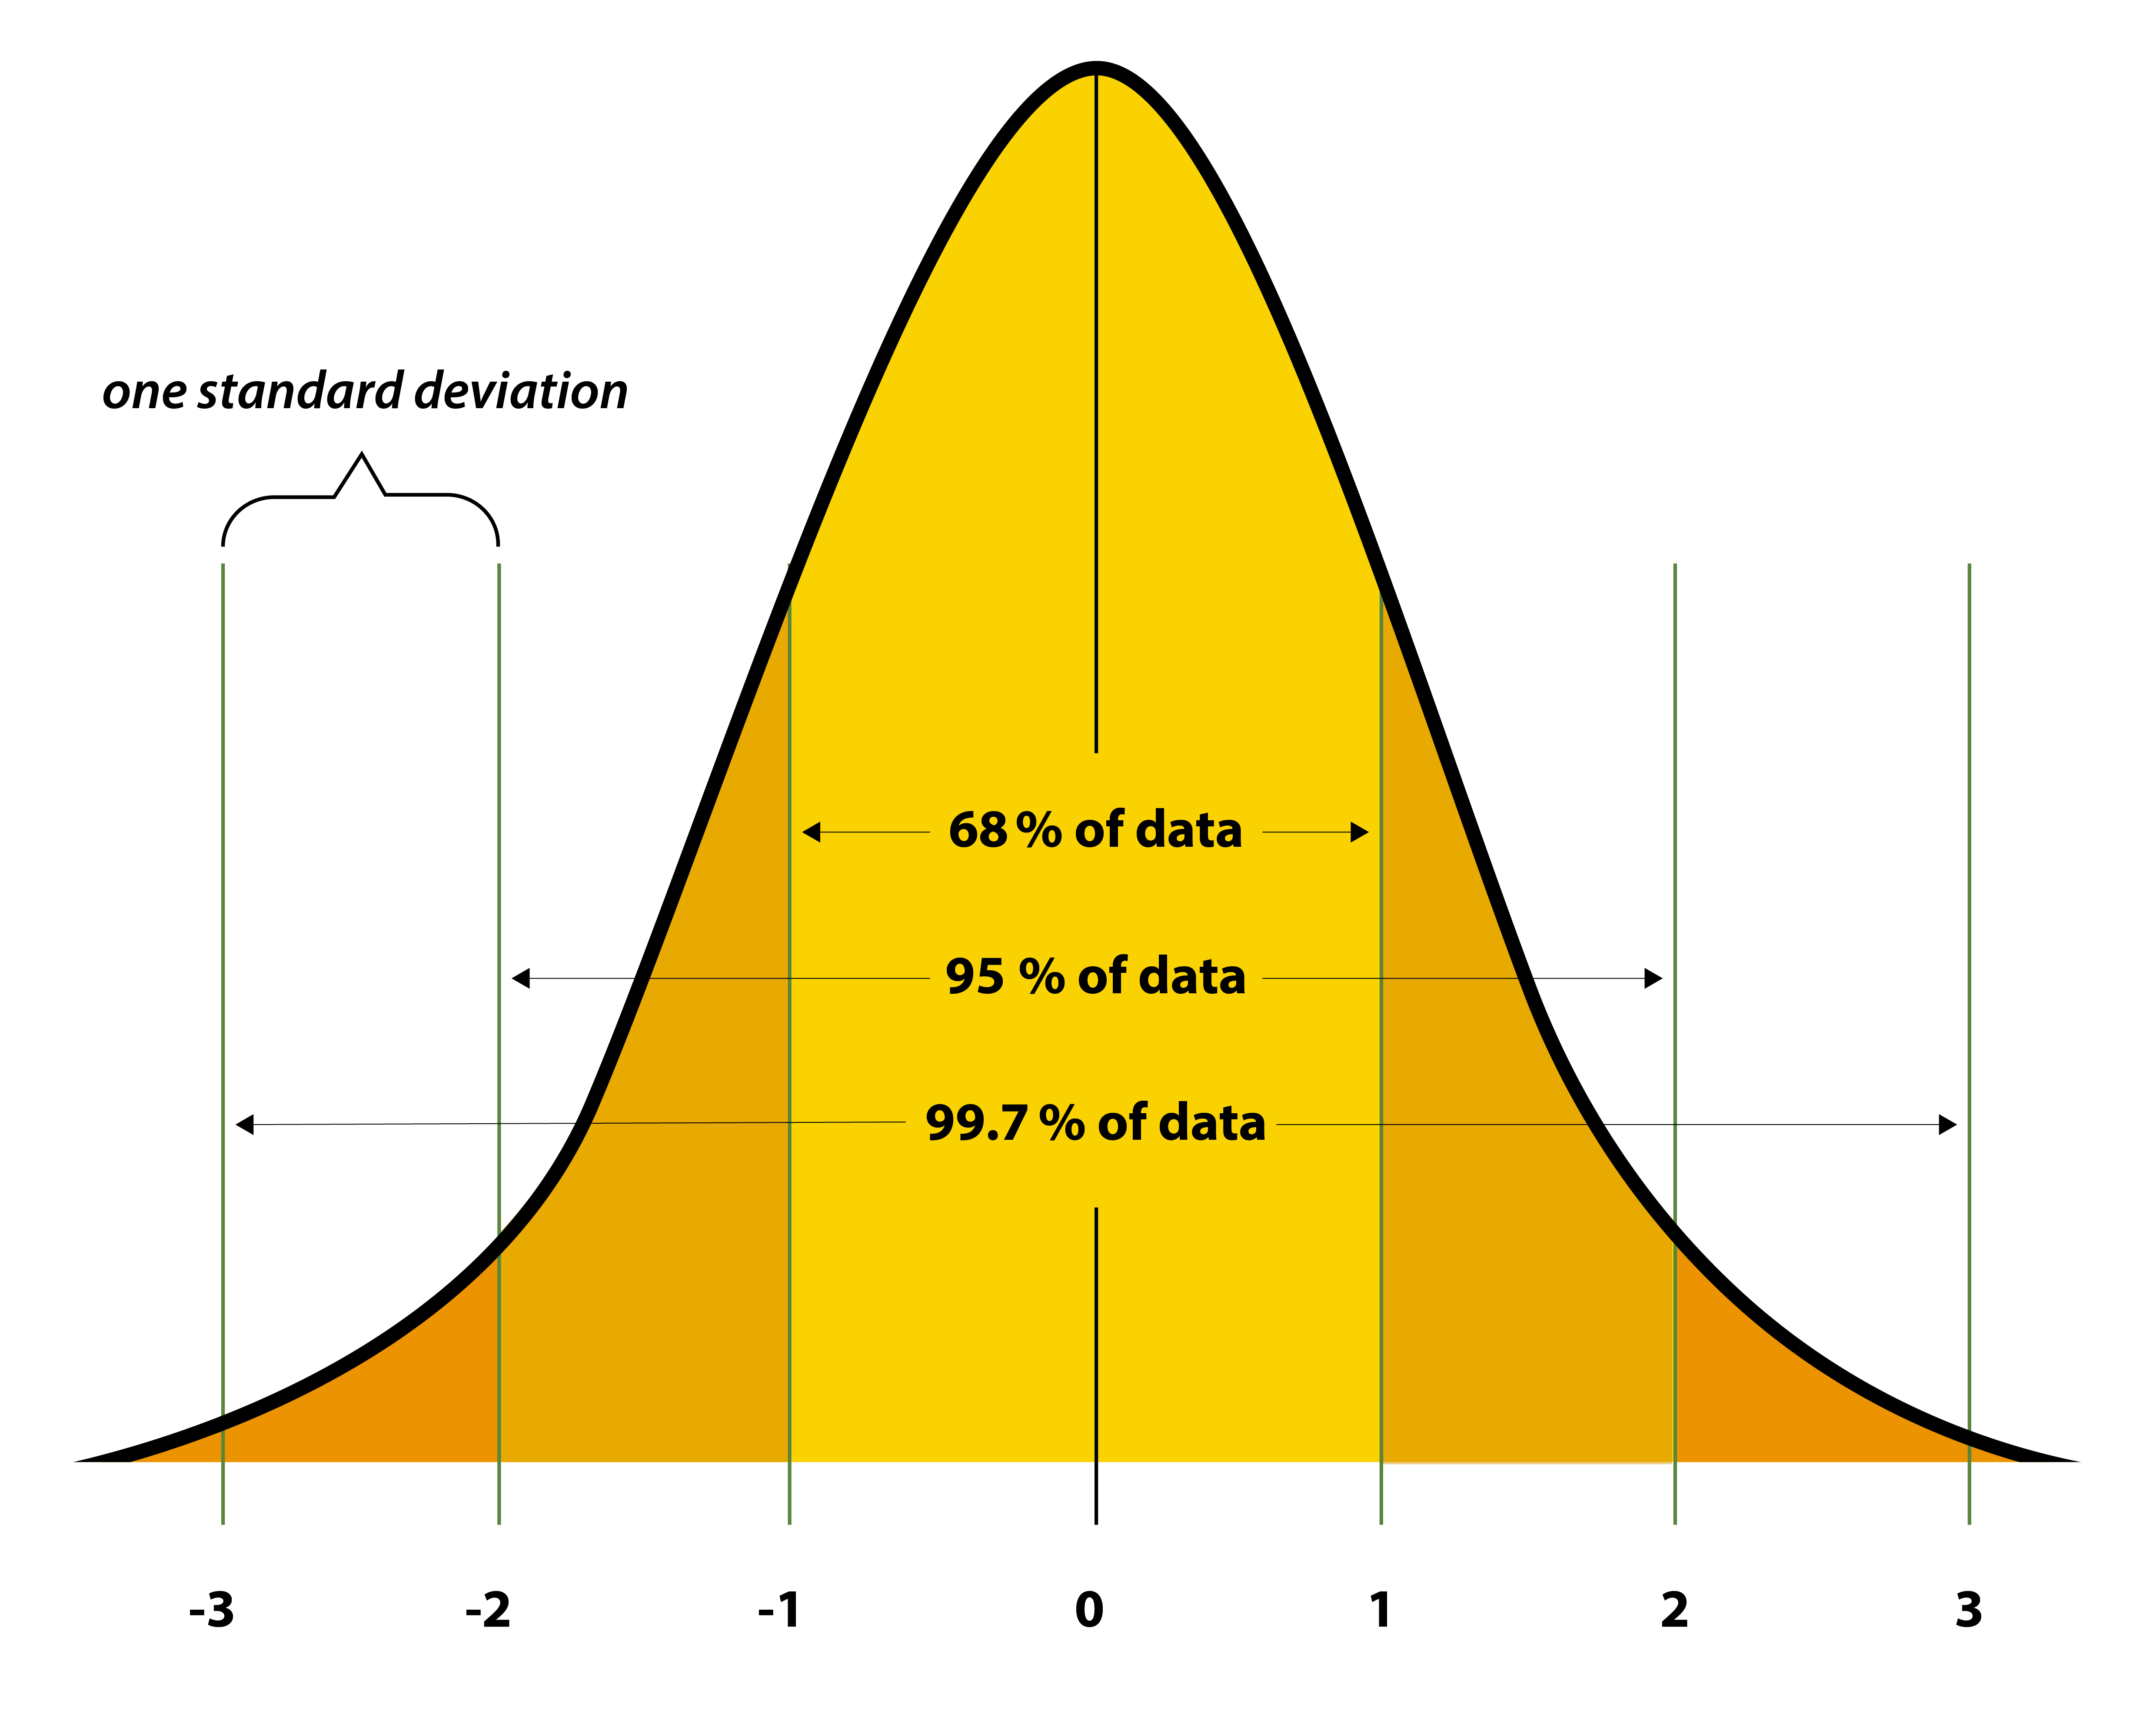
normal distribution
standardized pattern of distributing values, the same ratio every time
same value for mean, median, and mode
unimodal and symmettrical
mesokurtic
z-score formula

z-score
measures how many standard deviations a specific data point is away from the average (mean) of a data set
empirical rule
states that for any data set that follows a normal distribution (bell curve), almost all data will fall within three standard deviations of the average
68 - 95 - 99.7
percentile rank
shows your relative position compared to a group of peers
percentage rank in comparison to other values