Fluid System + Oxygenation Monitoring
 Call Kai
 Learn
Learn Practice Test
 Spaced Repetition
 Match
Match Flashcards
 Knowt Play
1/55

Earn XP
Description and Tags
Exam 2
Name | Mastery | Learn | Test | Matching | Spaced | Call with Kai | Chat |
|---|
No analytics yet
Send a link to your students to track their progress
56 Terms
Pulmonary Circulation
Transports systemic venous blood (mixed venous) into contact with the alveoli for gas exchange
Low-pressure, low-resistance system
Pulmonary arteries are thin-walled, have less smooth muscle, and have greater compliance
Blood reservoir – 40% of lung weight is from the blood volume housed in pulmonary vessels, 10% circulating volume
Blood volume and influence PVR → if really full, increased PVR due to pressure on vessel walls
Hypoxic pulmonary vasoconstriction
blood vessel constrict to divert blood flow to areas with more oxygen
Path of Oxygen
In lungs: Atp ~PO2 = 160, alveoli PO2 = 100
Gas is exchanged with the atmosphere – ventilation
Gas in pulmonary arterioles is exchanged with gases in blood of the pulmonary capillaries – external respiration
In the blood - transport: PO2 of arterial blood ~100 mmHg
Most O2 is bound/carried by O2; SaO2 97-99%
Small amount of O2 is dissolved in plasma; PaO2
CaO2 = totals O2 content of arterial blood (heme + plasma); 17-20 mL
Oxygen Delivery (900-1100 mL/min)– internal respiration: PaO2 = 100mmHg, Tissue = 10-20 mmHg
Oxygen in blood moves down its concentration gradient as it oxygenates tissues à then moves into mitochondria (2-3 mmHg)
Oxyhemoglobin disassociation curve
Describes the relationship between hemoglobin saturation and partial pressure of oxygen
Deoxyhemoglobin = oxygen unbound to hemoglobin
Oxyhemoglobin = oxygen bound to hemoglobin
P50 = partial pressure of oxygen when hemoglobin saturation is 50 %
Curve shifts
Temperature: increased temp – shift right, increase P50 – less affinity
pH: decreased pH – shift right, increase P50 – less affinity
PCO2: increased PCo2 – shift right, increase P50 – less affinity
2,3-DPG – increased – shift right, increase P50 – less affinity
Bohr Effect
Describes how increased CO2 and H+ ions decreases hemoglobin’s affinity for oxygen (decreased pH)
CO2 enters blood cell and is converted to carbonic acid
H+ binds to hemoglobin and causes a conformational change that weakens affinity to O2
Oxygen consumption is determined by?
Oxygen demand – amount of O2 tissues require for metabolism
- Affected by: metabolic rate, temperature, activity/shivering, stress, disease, medicationOxygen consumption (VO2) – amount of O2 actually used by the body per minute
Norm: 200-250 mL O2
Supply-demand oxygen consumption mismatch outcome + compensatory mechanisms
If there is a greater demand than supply, the body will use anaerobic metabolism and produce lactic acid
Compensatory mechanisms for reduced supply/delivery
Acute: increase CO, increase Tissue O2, redistribution of blood flow to vital organs
Chronic: increase RBC/hemoglobin (hypoxemia or high altitude)
O2 extraction ratio
O2ER = percentage of delivered oxygen that is actively consumed by the tissues
Describes relationship between DO2- amount of oxygen supplied – and VO2 – amount of oxygen consumed
Pulse Oximetry
Uses two light-emitting diodes (LEDs) to send red light and infrared light through a pulsating arterial vascular bed
Photodetector measures the light absorbed/transmitted through the tissue
Saturated Hgb absorbs more infrared light→ 940 nm wavelength
Desaturated Hgb absorbs more red light → 660 nm wavelength
More oxygenated blood = more red light transmitted, more infrared light absorbed
Less oxygenated blood = more red light absorbed, more infrared light transmitted
Beer Lamber Law
Describes light absorption – loss of light intensity/ light attenuation
Ideally, the only cause would be due to absorption of light by molecules
Attenuation is proportional to
Concentration of absorbing substance
Distance the light travels
Absorption characteristics of the substance → Oxyhemoglobin and deoxyhemoglobin have different optical properties
Functional Hgb
participated normally in oxygen transport; oxy- and deoxyhemoglobin
Carboxyhemoglobin (COHb)
nonfunctional Hgb
Bound to carbon monoxide – has higher affinity compared to O2 so it holds on longer
May not be diagnosed by standard pulse oximetry
Systemic PO2 levels may not be affected
Methemoglobin (MetHb)
nonfunctional Hgb
Hemoglobin containing Fe^3+ - Ferric iron
Can occur with exposure to nitrates/nitrates
Standard system PO2 may not reliable identify
PaO2 and SaO2
Normal PaO2: 80-100 mmHg
Normal SaO2: 97-100%
Abnormal = 60-80 mmHg + 90% saturation
below 60 mmHg and 90% saturation the drop off of oxygenation becomes significantly more severe (40 mmHg - 75%)
Identify errors in pulse oximetry that may provide a false or poor signal.
Poor signal
Low perfusion/vasoconstriction
Hypotension
Motion
Improper sensor placement
BP cuff cycling on the same extremity
Potential interference/inaccurate readings
Dyshemoglobinemias
Intravascular dyes
Strong ambient light
Nail products
Severe anemia
Skin pigmentation may contribute to measurement bias
Swan-Ganz catheter to measure mixed venous oxygenation saturation
Using a fiber-optic Swan-Ganz catheter, incorporated into an PAC → measures the optical properties of hemoglobin and continuously estimates oxygen saturation
NORMAL: 60-80%
Low SvO2: decreased CO, Hgb, SaO2, increased VO2
High SvO2: Increased DO2 and decreased VO2
Impaired tissue extraction/shunting
Affinity increased (holds on to O2)
Not always a good thing
Hemodynamic monitoring
Describes the relationship between pressure, flow and resistance
Assess cardiac function, vascular function, perfusion, and response to therapy
Pascal’s Principle
Pressure applied to a enclosed fluid is transmitted undiminished to every portion of the fluid and the vessel walls of the containing vessel
Monitoring: patient → catheter → fluid → column → transducer
Incompressible fluid, rigid tubing, and no air
Poiseuille’s law
Flow through a cylindrical tube is
directly proportional to the pressure difference and the fourth power of the radius
inversely proportional to the fluid’s viscosity and the tube’s length
Flow is dependent on radius, length, and viscosity/resistance of fluid
Cross Sectional Areas of vessel
Capillaries – 2500 cm²
Venules – 250 cm²
Small veins - 80 cm²
Arterioles 40 cm²
Small Arteries – 20 cm²
Venae cava – 8 cm²
Aorta – 2.5 cm²
Capillaries have the largest cross-sectional area due to have billions in the body
Cross-sectional Area and velocity
The same volume of blood must pass through all vessels
Velocity is inversely proportional to vascular cross-sectional area
velocity/speed increases as the cross-sectional area decreases
Capillaries have the slowest velocity due to the largest cross-sectional area → more time for nutrient exchange
Flow vs velocity
Flow = how much blood is being moved
Velocity = speed/how fast the blood is traveling
Reynold’s Number
a. Compares inertial forces with viscous forces to predict flow patterns
Inertia = fluid's desire to keep moving
Viscosity = fluids resistance/friction
b. Predicts whether blood flow will be smooth and orderly (Laminar) or chaotic and swirling (Turbulent)
Velocity and diameter are highly influential
in aorta: large diameter and high velocity = high Re - may be turbulent
In capillaries: small diameter, low velocity = low Re - laminar
Reynold’s Number Equation
Re = (p*v*d)/u
p = density of the blood (mass/volume; inertia)
v = velocity of blood flow (how fast)
d = diameter of the blood vessel (resistance)
u = viscosity of blood (how thick/sticky)
Reynold’s Number predictions
i. If Re < 2000 = Laminar
ii. If Re > 4000 = Turbulent
iii. If 2000 < Re < 4000 = Transition flow
Catheter + noncompliant tubing
Carries pressure from the patient to the transducer
Catheter design
Biocompatible, smooth, nonthrombogenic, as short as practical, low-compliance walls, small outer diameter
Pressure transducers
Converts mechanical pressure to an electrical signal when pressure pushes on a pressure-sensitive diaphragm
Transducer senses movement produced by pressure transmitted through the fluid column
Capacitance transducer
Uses two plates → pressure pushes on the diaphragm causes the plates to push against each other → oscillating voltage → increase in capacitance
Inductance Transducer
Uses a coil → pressure causes diaphragm to move and change position of coil → changes inductance of system
Resistance Type Transducer
Uses a Strain gauge bonded to the back of the diaphragm
Pressure pushes on the diaphragm, causing it to bend/move → the strain gauge is stretched or compressed → resistance changes → electrical signal changes
Wheatstone bridge: changes in resistance are easily converted to a change in voltage
Makes small changes easy to detect
Diaphragm moves → strain gauge resistance changes → Wheatstone bridge detects it → voltage changes → pressure displayed
Amplifier
strengthens the electrical signal coming from the transducer
Flush system + pressure bag + stopcocks
Flush: continuously provides a small amount of fluid through the pressure tubing
Prevents clotting; keeps catheter open
Pressure bag: applies pressure on the flush solution so that it is higher than patient pressure (prevents backflow)
Stopcocks: controls flow direction; used to connect the transducer to the patient, collect samples, zero the transducer
Monitor/signal processor
Processes the electrical signal and converts it to pressure measurements
Important functions
Zero: establishes atmospheric pressure as 0 mmHg → balancing the Wheatstone bridge
Scale: changes how the waveform is displayed
Alarms: identify pressure outside selected limits
Scale + Gain of transducer monitor
scale = changes how the waveform is displayed
gain = changes display sensitivity or amplification
Natural Frequency
Frequency at which any structure prefers to oscillate/vibrate naturally after it has been disturbed
Longer and more compliant = lower natural frequency
Shorter and stiffer = higher natural frequency
Monitoring system should have a much higher natural frequency than the patient’s waveform so that it won’t sink in and cause the waveform to be amplified/exagerated (longer, more compliant takes more time and can cause the waveforms to get distorted)
What can disturb pressure wave forms
Catheter diameter and length
Longer tubing = diminished pressure
High compliance = absorbs changes in pressure
Connection/stockcocks = distortion
Air bubbles
Resonance
Resonance happens when an outside force is applied at or very close to a system’s natural frequency
Can amplify the waveform signal
Damping
The loss of energy from an oscillating system
some is needed

Transducer waveform Damping Type
Overdamped
low systolic BP and High diastolic BP
narrow pulse pressure
Causes: air bubbles, kinks/poor connection, small-lumen catheter, blood backed into the pressure tubing
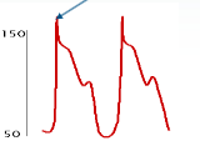
Damping of Transducer waveform
Underdamped
High Systolic BP and Low Diastolic BP
Wide pulse pressure
Causes: resonance, hyperdynamic signals, tachycardia, and tubing vibration

type of transducer waveform
Optimal Transducer Waveform
Square-Wave/Fast Flush Test
Evaluates the dynamic response of the transducer monitoring system
Process
Activate the fast-flush device → release → observe waveform response
diagnose damping from transducer
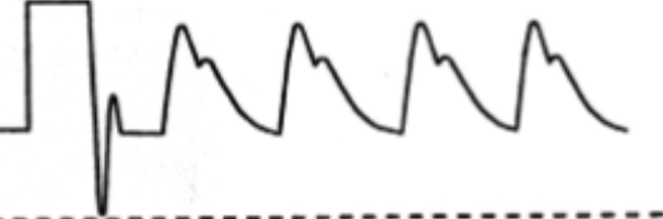
Square-Wave/Fast flush test
adequate damping
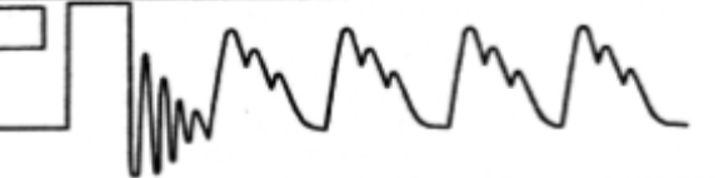
Square-Wave/Fast flush test
Underdamping
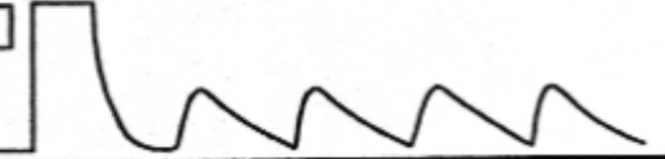
Square-Wave/Fast flush test
Overdamping
Patient factors that influence damping
higher-frequency signals occur with tachycardia or sepsis
Aortic regurgitation (blood leaks backward into the LV) or hyperdynamic circulation
Zeroing transducer
calibrate the system to atmospheric pressure to program it as 0 mmHg
Process: close transducer off to the system, open the Wheatstone bridge to air, press zero on the monitor system
Leveling Transducer
location of transducer when zeroing + monitoring pressure to prevent hydrostatic error
If too low, the transducer diaphragm is pushed on by the weight of the fluid
Phlebostatic axis: in line with the patient’s heart/RA
2 mmHg for every 1 unit of vertical difference from the phlebostatic axis
Lag time
longer tubing the longer the lag time, because of inertia, fluid-filled column within system should be transmitted simultaneously and with equal force
Oscillations
numbers of cycles per second
Fidelity
Ability to reproduce the patient’s actual pressure waveform
How faithfully the system reproduces the patient’s pressure waveform
High fidelity = preserves timing, shape, and amplitude
Dynamic response
How accurately the system follows rapidly changing pressure
Response must be quick without exaggerating or blunting the waveform
Ringing
repeated oscillations caused by inadequate damping
Catheter whip
motion artifact from catheter movement
Hydrodynamic pressure
Pressure produced by fluid in motion
Hydrostatic Pressure
Pressure exerted by a stationary fluid column