Elasticity
 Call Kai
 Learn
 Practice Test
 Spaced Repetition
 Match
 Flashcards
 Knowt Play
1/33

There's no tags or description
Looks like no tags are added yet.
34 Terms
Price elasticity of demand
Price elasticity of demand (尸ED) is a measure
of the responsiveness of the quantity of a
good demanded to changes in its price. PED
is calculated along a given demand curve.
In general' if quantity demanded is highly
responsive to a change in price, demand is
referred to as being price elastic; if quantity
demanded is not very responsive, demand is
price inelastic.
Formula for PED

Sign of PED
PED is used as a positive number even though values may be negative. - Absolute value is considered.
Use of percentages
We need a measure of responsiveness that is
independent of units.
It is meaningless to think of changes in prices or
quantities in absolute terms
Range of values for PED
Demand is price inelastic when PED<1 (but greater
than zero). The percentage change in quantity
demanded is smaller than the percentage change in
price, so the value of PED is less than one; quantity
demanded is relatively unresponsive to changes in
price, and demand is price inelastic.
Demand is price elastic when PED>1 (but less
than infinity). The percentage change in quantity
demanded is larger than the percentage change
in price, so the value of PED is greater than one;
quantity demanded is relatively responsive to price
changes, and demand is price elastic.
Unitary elasticity
Demand is unit elastic when PED = X. The percentage
change in quantity demanded is equal to the
percentage change in price, so PED is equal to one;
demand is then unit elastic., there is unitary PED.
Perfectly inelastic
Demand is perfectly inelastic when PED - 0. The
percentage change in quantity demanded is zero;
there is no change in quantity demanded, which
remains constant at Q\ no matter what happens to
price; PED is then equal to zero and demand
is perfectly inelastic
Perfectly elastic
Demand is perfectly elastic when PED = infinity.
When a change in price results in an infinitely
large response in quantity demanded, demand
is perfectly elastic
Steepness of curve and PED
We often use the relative steepness of demand
curves to be an indication of PED, so that
comparing two demand curves, the one that is
flatter is said to be more elastic while the one
that is steeper is said to be more inelastic.
Varying PED on a demand curve
On any downward-sloping, straight-line
demand curve, demand is price-elastic at high
prices and low quantities, and price-inelastic at
low price and large quantities. At the midpoint
of the demand curve, there is unit elastic
demand.
Therefore, the terms 'elastic' and 'inelastic'
should not be used to refer to an entire
demand curve (with the exception of the
three special cases where PED is constant),
but only to a portion of the demand curve
corresponding to a particular price or
price range.
Determinants of PED
Number and closeness of substitutes
Necessities vs luxuries
Length of time
Proportion of income spent on a good
Total revenue
Total revenue (TR) is the amount of money received by
firms when they sell a good (or service), and is equal to
the price (P) of the good times the quantity (Q) of the
good sold. Therefore, TR - P^Q.
PED and total revenue
When demand is elastic, an increase in price
causes a fall in total revenue, while a decrease in
price causes a rise in total revenue.
When demand is inelastic, an increase in price
causes an increase in total revenue, while a
decrease in price causes a fall in total revenue.
When demand is unit elastic, a change in price
does not cause any change in total revenue.
PED and indirect taxes
The lower the price elasticity of demand for the
taxed good, the greater the government tax
revenues.
PED in relation to primary commodities
Many primary commodities have a relatively
low PED (price inelastic demand) because
they are necessities and have no substitutes
(for example, food and oil). The PED of
manufactured products is relatively high
(price elastic demand) because they usually
have substitutes.
Income elasticity of demand
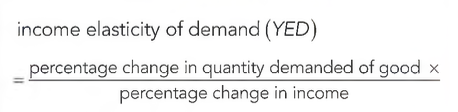
Income elasticity of demand (YED) is a measure
of the responsiveness of demand to changes
in income, and involves demand curve shifts. It
provides information on the direction of change
of demand given a change in income (increase
or decrease) and the size of the change (size of
demand curve shifts).
Income elasticity of demand - formula
Income elasticity of demand interpretations
YED>0. A positive income elasticity of
demand indicates that the good in question
is normal; demand for the good and income
change in the same direction (both increase
or both decrease).
YED<Q. A negative income elasticity of
demand indicates that the good is inferior:
demand for the good and income move in
opposite directions (as one increases the
other decreases). Examples include bus
rides, used clothes and used cars; in these
cases, as income increases, the demand
for these goods fall as consumers switch to
consumption of normal goods
Income elasticity of demand - necessities vs luxuries
YED < 1: Necessities. If a good has a YED
that is positive but less than one, it has
income inelastic demand: a percentage
increase in income produces a smaller
percentage increase in quantity demanded.
Necessities are income inelastic goods.
YED > 1: Luxuries and services. If a good
has a YED that is greater than one, it has
income elastic demand: a percentage
increase in income produces a larger
percentage increase in quantity demanded.
Luxuries and services are income elastic.
Engel curve
The Engel curve shows a continuum: at very low
incomes a good may be a luxury; as income
increases it becomes a necessity and finally at
high income levels it becomes inferior.
With income on the vertical axis and quantity on
the horizontal axis of an Engel curve diagram,
we can see the following:
YED>0 in the upward sloping part of the
curve showing quantity and income both
increasing, which indicates the good is normal
YED<0 in the downward sloping part
showing quantity decreasing as income
increases, which indicates the good is inferior.
YED and producers:
Income Elastic Goods (YED>1): Demand grows faster than the rate of income growth (e.g., restaurants, travel, health care), leading to rapid industry expansion. However, these industries suffer the largest sales drops during a recession.
Income Inelastic Goods (YED<1): Demand grows slower than income growth (e.g., food, clothing, furniture), leading to slower industry expansion. During a recession, these products are more stable and avoid major declines in sales.
Inferior Goods (YED < 0): Demand actually increases during a recession when incomes fall.
YED and the sectoral structure of the economy
Primary Sector (Agriculture, forestry, fishing, mining): Has a low YED (YED<1) because demand for food grows slower than income, and raw materials (like cotton and rubber) are often replaced by synthetic substitutes. As a result, its share of the total economy shrinks over time.
Manufacturing Sector (Cars, TVs, computers): Has a high YED (YED>1), meaning demand grows faster than income, causing the sector's share of the economy to expand.
Services Sector (Travel, banking, health care, education): Has the highest YED, causing demand to grow the fastest. With continued economic growth, services eventually expand at the expense of both agriculture and manufacturing.
PES
Price elasticity of supply (尸ES) is a measure
of the responsiveness of the quantity of a
good supplied to changes in its price. PES
is calculated along a given supply curve.
In general, if there is a relatively large
responsiveness of quantity supplied, supply is
referred to as being elastic; if there is a relatively
small responsiveness, supply is inelastic.
PES Formula

Supply = price inelastic
Supply is price inelastic when PES<1. The
percentage change in quantity supplied is smaller
than the percentage change in price, so the value of
PES is less than one; quantity supplied is relatively
unresponsive to changes in price, and supply is
price inelastic or inelastic.
Supply = price elastic
Supply is price elastic when PES>1. The percentage
change in quantity supplied is larger than the
percentage change in price, so the value of the
PES is greater than one; quantity supplied is
relatively responsive to price changes, and supply
is price elastic or elastic.
Supply = unit elastic
Supply is unit elastic when PES = 1. The percentage
change in quantity supplied is equal to the
percentage change in price, so PES is equal to
one; supply is unit elastic; there is unitary PES.
Supply is perfectly inelastic
Supply is perfectly inelastic when PES = 0. The
percentage change in quantity supplied is zero;
there is no change in quantity supplied no matter
what happens to price; PES is equal to zero and
supply is said to be perfectly inelastic.
Supply is perfectly elastic
Supply is perfectly elastic when PES = infinity. The
percentage change in quantity supplied is infinite;
any change in price leads to an infinitely large
response in quantity supplied; supply in this
case is called perfectly elastic
Determinants of PES
Length of time
Mobility of FOPs
Spare (unused) capacity of firms
Ability to store stocks
Rate at which costs increasing
PES in relation to primary commodities and manufactured products
Reasons for Low PES in Primary Commodities:
Agriculture: Farmers need at least one full planting season to adjust output. Furthermore, suitable farmland is limited or shrinking due to soil depletion, meaning higher output requires slow, costly technological advances (like better seeds and irrigation systems) amidst growing water shortages.
Oil, Gas, and Minerals: Extracting natural resources requires massive upfront investment and setup time, so firms wait for severe shortages before committing to increasing production.
Consequences of Low PES:
Because supply cannot easily adjust in the short term, shifts in demand cause sharp price fluctuations.
Combined with price inelastic demand (PED), this leads to highly unstable revenues and incomes for farmers and primary producers compared to manufacturers.
Short term and long term PES
Short Term (Low PES): Producers cannot quickly adjust their output in response to price changes due to fixed planting seasons and resource constraints, resulting in inelastic supply.
Long Term (Higher PES): Given more time, producers can make necessary adjustments (such as investing in new technology, acquiring land, or shifting resources), making the quantity supplied much more responsive to price changes.