Experimental Analysis & Graph Interpretation
 Call Kai
 Learn
 Practice Test
 Spaced Repetition
 Match
 Flashcards
 Knowt Play
1/40

Name | Mastery | Learn | Test | Matching | Spaced | Call with Kai | Chat |
|---|
No analytics yet
Send a link to your students to track their progress
41 Terms
Two RT-qPCR samples have Ct values 11 and 16. Which contains more starting target RNA?
The Ct 11 sample.
Why does lower Ct imply more starting target RNA?
More starting template reaches the fluorescence threshold sooner.
A sample crosses the qPCR threshold late. What does this suggest?
Low starting target abundance.
A no-template qPCR control crosses the threshold. What does this suggest?
Contamination or nonspecific amplification.
In Figure A, which curve represents the highest starting viral RNA?
The leftmost, dark-purple curve (Ct ≈16).
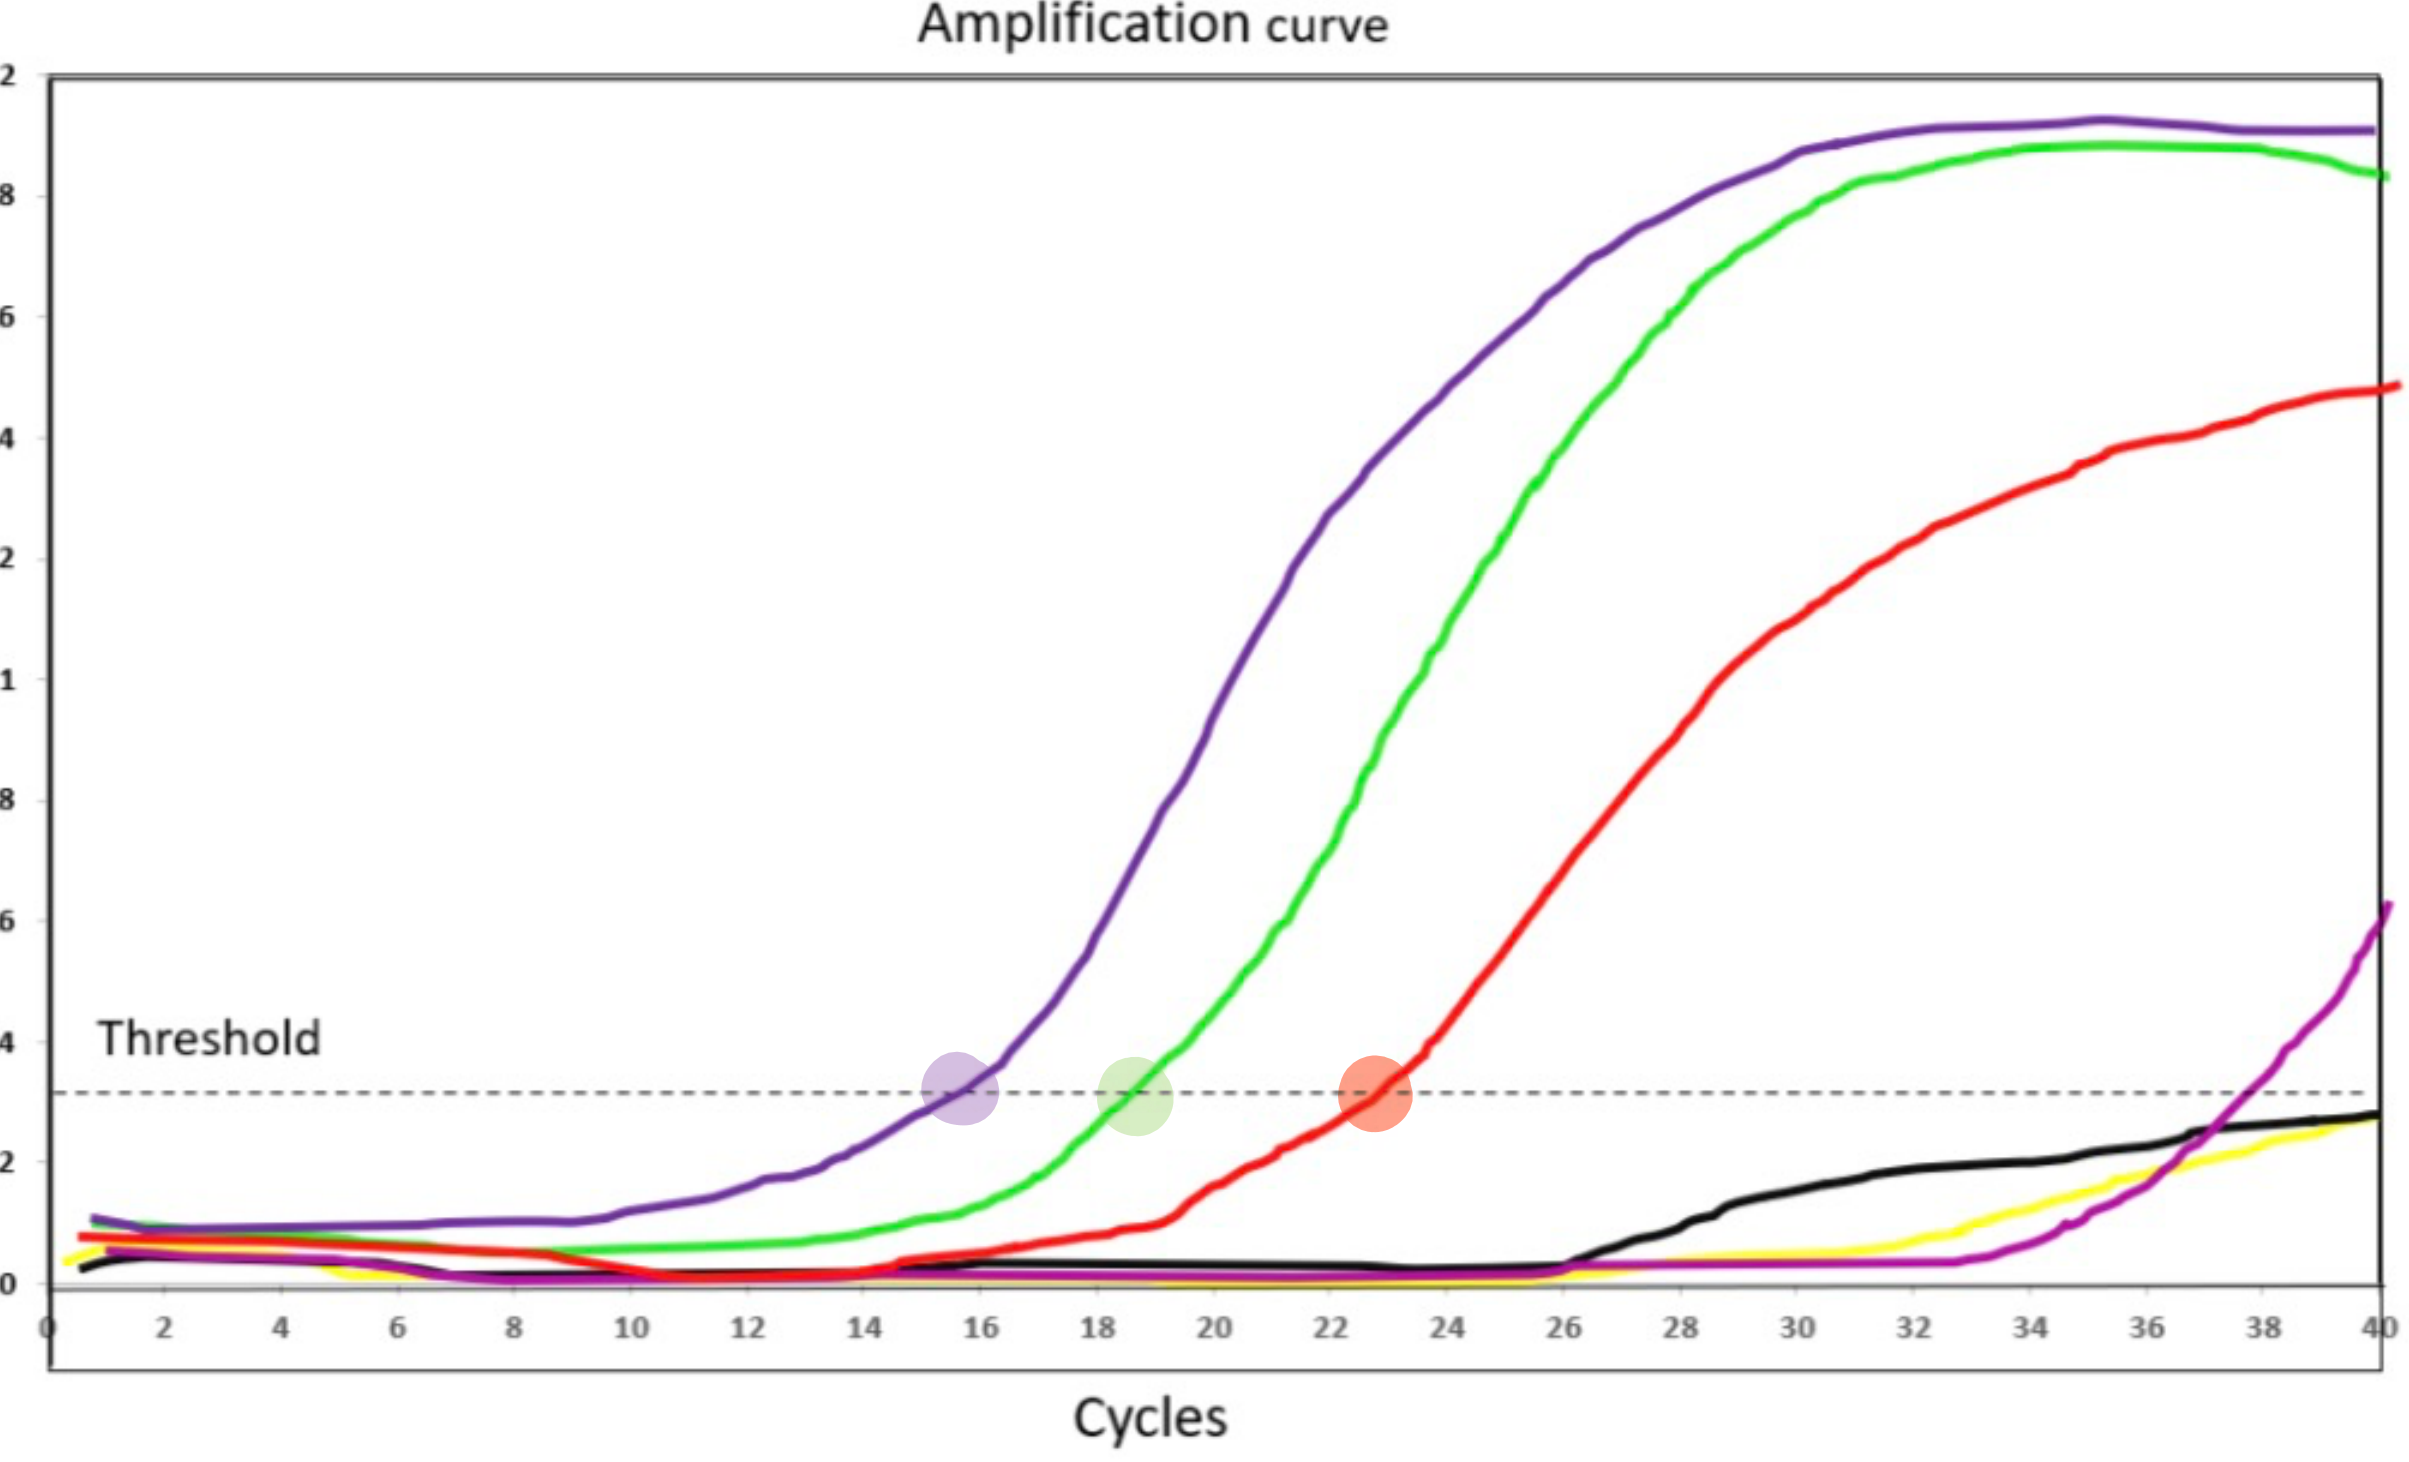
In Figure A, rank the three clearly positive curves by starting RNA.
Dark purple > green > red.
In Figure A, why is the red curve interpreted as having less starting RNA than green?
Red crosses the threshold later.
In Figure A, which three curves meet the tutorial positive criterion of Ct <33?
Dark purple, green, and red.
What does a stronger anti-phospho-EGFR band usually suggest?
More phosphorylated EGFR.
What does unchanged total EGFR with increased phospho-EGFR suggest?
Increased receptor activation without increased total receptor abundance.
In Figure B, how does phospho-EGFR change as estrogen concentration rises?
It increases.
In Figure B, does total EGFR increase substantially with estrogen?
No; total EGFR stays relatively constant.
In Figure B, what is the lowest estrogen concentration with visibly detectable phospho-EGFR?
About 0.03 units/mL.
In Figure C, what does the β-actin panel help assess?
Whether similar protein amounts were loaded.
In Figure C, which cell line has the strongest GPER signal?
TNBC.

Why does a strong protein band alone not prove kinase activation?
It measures protein abundance, not phosphorylation or activity.
After anti-EGFR IP, an anti-GRB2 blot shows a band only after EGF treatment. What does this suggest?
EGF promotes GRB2 association with EGFR.
After anti-GRB2 IP, an anti-phospho-EGFR blot shows a band. What does this suggest?
Phosphorylated EGFR associates with GRB2.
Why does co-IP not necessarily prove direct protein binding?
Proteins can associate through other complex members.
An EGFR inhibitor reduces phospho-EGFR but total EGFR is unchanged. What is the likely effect?
Inhibited receptor activation.
What would loss of a phospho-EGFR band after RTKI treatment support?
The inhibitor blocks EGFR phosphorylation.
In haploid yeast, what does a dominant 1C peak indicate?
Most cells have unreplicated DNA (G1).
In haploid yeast, what does a dominant 2C peak indicate?
Most cells have replicated DNA (G2/M).
Why can cells between 1C and 2C indicate S phase?
Their DNA is being replicated.
In Figure D, which histogram represents a mixed cycling population?
Graph 1.

In Figure D, which histogram is consistent with mitotic arrest?
Graph 3 (dominant 2C peak).
In Figure D, which histogram is consistent with G1 arrest?
Graph 4 (dominant 1C peak).
Nocodazole causes accumulation at 2C. Why?
Spindle disruption prevents completion of mitosis.
Hydroxyurea produces cells with intermediate DNA content. Why?
dNTP depletion stalls DNA replication.
A yeast culture has mostly large-budded cells. Which stage is enriched?
G2/M.
A yeast culture has mostly unbudded cells. Which stage is enriched?
G1.
A promoter mutation abolishes luciferase activity in all tested cells. What does this suggest?
An essential promoter element was disrupted.
A promoter mutation increases luciferase activity. What kind of regulation was likely lost?
Repression.
A promoter mutation reduces activity in only one cell line. What does that suggest?
Cell-type-specific activation.
In Figure E, which mutated element is essential for reporter expression?
Element A.
In Figure E, which mutation increases reporter activity in both cell lines?
Element C.
In Figure E, which mutation decreases activity in Y but not Z?
Element D.
In Figure E, what does the effect of mutation D suggest?
D is a positive regulatory element active in Y.

What does a positive anti-SOX4 ChIP-PCR band indicate?
SOX4 associates with the tested promoter region.
A control-antibody ChIP lane has a band. What concern does this raise?
Nonspecific DNA recovery.
Why can abundant SOX4 fail to activate a promoter?
Its functional DNA-binding motif may be absent.