Microeconomics Graphs
 Call Kai
 Learn
Learn Practice Test
 Spaced Repetition
 Match
Match Flashcards
 Knowt Play
1/21

There's no tags or description
Looks like no tags are added yet.
Name | Mastery | Learn | Test | Matching | Spaced | Call with Kai | Chat |
|---|
No analytics yet
Send a link to your students to track their progress
22 Terms
What are capital goods?
Goods used to produce more goods/services (essential for long-term economic growth).
What are consumer goods?
Goods used by consumers (satisfy current consumption desires, but don’t directly contribute to future growth).
What does PPF/PPC stand for?
Production Possibility Frontier/Curve.
What is a PPF/PPC?
A graphical representation of an economy’s maximum production potential given its resources and technology.


What does the blue line represent on the PPF?
Represents an economy’s maximum production, using ALL of their resources (maximum efficiency).

Why is the PPF/PPC concave to the origin?
Because of the increasing marginal opportunity cost (in order to gain more, they need to lose more).
What does a PPF/PPC look like with a constant marginal opportunity cost?


What does point 1 represent on the PPF?
A productively inefficient economy.
Producing below their potential capacity/output.

What does point 2 represent on the PPF?
Unattainable (the economy does not have enough resources).

What does point 3 and 4 represent on the PPF?
A productively efficient economy (using all of their resources).
Producing at their maximum potential capacity/output.

How do points 3 and 4 produce at their maximum potential capacity/output even though they each produce different amounts of consumer/capital goods on the PPF?
Economies can choose different combinations —> in order to gain something, they need to drop something else (opportunity cost).

What does the movement from point A to B depict on the PPF?
Movement along the curve —> depicts a trade-off (a change in potential output/capacity).

How would you calculate opportunity cost here using the PPF?
90-40/95-60 = 1.43 units (3d.p.)

What does this PPF show is happening to the economy?
Shift of curve outward —> increase in maximum resources/potential output —> economic growth.
Causes of outward shifts on a PPF?
Technological advancements.
Population (larger workforce).
Increase in natural resources.
Human Capital Development (eg. better education, more skilled workers) —> more goods and services.
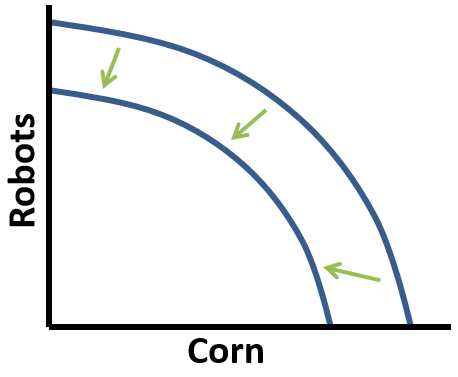
What does this PPF showing is happening to the economy?
Shift of the curve inward —> decrease in maximum resources/potential output —> economic decline.
Causes of inward shifts on PPF?
War.
Fall in number of workers.
Natural disasters.
Global warming.
What is a downward-sloping demand curve?
A graph that shows the inverse relationship between price and quantity demanded.


What does the movement along the downward-sloping demand curve mean?
Movement shifts along the demand curve when price changes.
A → B: Contraction along the demand curve (price increase).
A → C: Extension along the demand curve (price decreases).

What is shown in this downward-sloping demand curve graph?
Change in quantity demanded.
Movement along the demand curve.
Price changes, quantity changes.

What is shown in this downward-sloping demand curve graph?
Change in demand.
Shift of the demand curve (in this case, an inward shift → shifts left → demand decreases).
Price is constant, demand changes.
Causes of shifts in a downward-sloping demand curve?
Population
Trends
Brand image
Adverts
Interest rates
Income
Price of substitutes
Prices of complements