Business Analytics MIDTERM
 Call Kai
 Learn
 Practice Test
 Spaced Repetition
 Match
 Flashcards
 Knowt Play
1/41

Earn XP
Description and Tags
you got this
42 Terms
unsupervised learning
data is mined to uncover previously unknown patterns w/o a clear outcome in mind
No dependent variable to predict (no regression)
Exploratory in nature (only provide initial direction)
“good results” are subjective
association rule mining
find out which items tend to occur/appear together
aka affinity analysis or market basket analysis
used to find out which products tend to be purchased together
main application = recommendations
U
universal set of items in a given domain
ex. all the items in a grocery store
X
an item-set; any subset of U
ex. {coffee, bagel}
CANNOT contain duplicate items
transaction
instance of an item-set
multiple of these comprise a dataset
ex. all combos of products bought by different customers (each row of the dataset)

association rule
describes the relationship between item-sets; DIRECTIONAL
X → Y: “if X, then Y”
X = antecedent (or body), Y = consequent (or head)
“we recommend Y to the customer that bought X”
X and Y can contain any number of items, but they must NOT be overlapping item-sets
support count (σ)
raw count of transactions in your dataset that contains the item-sets
support percentage (S)
fraction of transactions that contain an item-set or a pair of item-sets; NOT DIRECTIONAL
can be for an individual item-set [ex. S(X)] or an association rule [S(X→Y)]
highest (S) = occurs most frequently in the data set
confidence
considering X→Y, measures how often items in Y appear within transactions that contain X; DIRECTIONAL
“given that a customer buys X, there is a (conf)% probability that they will also buy Y”
lift
how much more likely 2 item-sets co-occur than pure chance; NOT DIRECTIONAL
>1: those who buy X are more likely to buy Y than other customers
=1: those who buy X are as likely to buy Y as any other customers
<1: those who buy X are less likely to buy Y than other customers
"Does this rule show an actual association, or is the confidence just pure chance?"
real association or coincidence
high confidence is not enough the prove real association → must use lift
High Confidence can reflect general product popularity rather than a real relationship, creating high confidence even with zero true dependency
ex. high-frequency items like 90% bread and 95% milk will naturally co-occur by pure chance
Use Lift to measure whether items occur together more often than expected by random chance
apriori alogrithm
if item-set X is not frequent (doesn’t satisfy the minimum threshold), then any larger item sets containing X cannot be frequent
how we find “good” candidates with so many possible item-set combos
frequent item-set
Item sets for which support >= minsupp; combos that occur with higher frequency in the dataset
minsupp decided based on domain knowledge or business goals
steps for apriori algorithm
compute support for all the 1 item-sets and keep only the frequent ones
form 2 item-sets using only frequent item-sets from (1) and keep only the frequent ones
form 3 item-sets, using only frequent item-sets from (2) and keep only the frequent ones. Keep forming N-item-sets and keeping only the frequent ones.
find all the items that satisfy support >= minsupp
generate all possible association rules (cannot have overlapping items) and calculate their confidence. Final set of rules are ones where confidnece >=minconfidence
clustering
organizing data points/observations into most natural groups called clusters
form of unsupervised learning = observations are not pre-defined, they are discovered from the data
no clear outcome in mind
evaluated and interpreted after clusters are discovered by the algorithm
desired properties of a cluster
high intra-similarity: points in a cluster should be similar
low inter-similarity: points in different clusters should be different
applications of clustering
discover natural groups and patterns in the data (ex. similarly behaving customers)
facilitate the analysis of very large datasets
distance measures
to measure similarity between individual data points
- numerical data - euclidian and manhattan
- binary data - matching and jaccard
the higher the distance, the more different the 2 points
euclidian distance
straight line distance b/w 2 points
for numerical data
manhattan distance
restricts distance measurement to horizontal and vertical paths
for numerical data
matching distance
# of mismatches / TOT # of attributes (k)
used for symmetric binary data (N00 and N11 are equally important)
for binary data
jaccard distances
# of mismatches / TOT # of attributes (k) —EXCLUDING matches with N00
used for asymmetric binary data (N00 is not as important as N11)
mutual presences are more important than mutual absences
data normalization
eliminates specific units of measurement and transforms the attributes to a common scale. Use for:
mixed data: when datasets have different types of attributes (numerical and binary columns)
non-comparable data: attributes that have values in different ranges (ex. age and income)
can apply numerical distance measures after data is normalized
data normalization methods to scale attributes
min max normalization: rescale attributes to have values between 0-1 using the min and max
A point with value X will be normalized to: NewValue = (X – min) / (max – min)
standardization: transform each attribute to have mean=0 and sd=1
NewValue = (X – Sample mean) / (Sample standard deviation)
linkage methods
to measure similarity between clusters
single, complete, average, centroid, and ward
single linkage
minimum pairwise distance b/w points from 2 different clusters
very sensitive to outliers
good for non-convex shapes
can produce long, straggly clusters
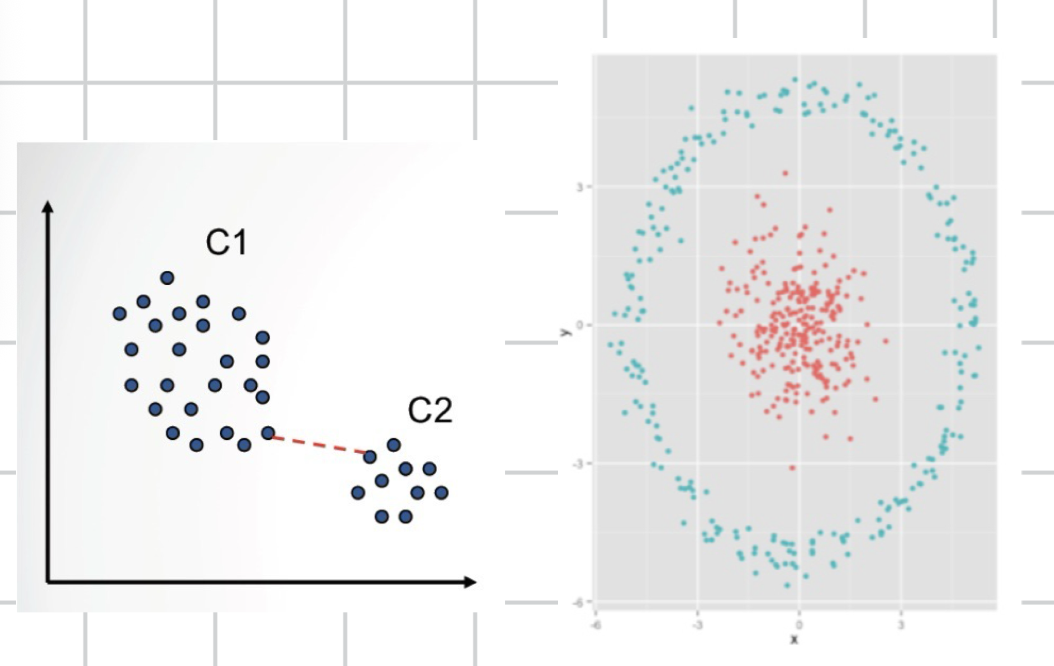
convex shape
straight line segment connecting any 2 points inside the cluster lies entirely within the cluster
complete linkage
max pairwise distance b/w points from 2 different clusters
sensitive to outliers
tends to break large clusters to create clusters with similar diameter

average linkage and centroid distance
average pairwise distance b/w points from 2 different clusters VS distance b/w 2 clusters’ centroids (average of all points)
produce similar results
create spherical shaped clusters
less sensitive to outliers than single or complete

Ward’s method
minimize within-cluster variance b/w centroid and cluster points
robust to outliers
create denser clusters with spherical shapes
best at finding underlying structure
most computationally complex
hierarchical clustering
forming larger clusters from smaller ones; # of clusters NOT pre-specified
- aka agglomerative or bottom-up
- each data point starts as its own cluster, and points/clusters merge based on the distance measure and linkage method specified → repeats until there is only one cluster left
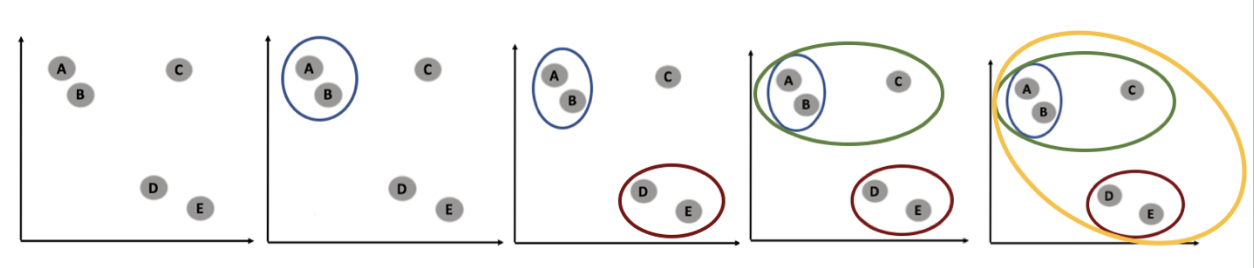
distance matrix
contains all pairwise distances b/w data points in your dataset
fed into an algoritm and used to decide which points to hierarchically cluster
hierarchical clustering pros and cons
pros
flexible, data-driven, no need to pre-specify the # of clusters
produces a solution for different #s of clusters
good at identifying “small” clusters
cons
computationally demanding → not scalable
can be sensitive to outliers depending on linkage method used
dendogram
diagram that shows the cluster’s hierarchy
height of horizontal bar = merge order (higher up = formed later)
break clusters up from the one that was formed last

partitioned based clustering
produce specified # of clusters with the lowest within-cluster variance, where k is chosen beforehand
most common approach = k-means clustering
usually implemented using Euclidian distance
keep reassigning points to the cluster’s centroid until convergence (reassignment doesn’t change anymore; within-cluster variance is minimized)

k-means clustering pros and cons
pros
computationally less demanding —> very scalable
cons
poor initialization (initial random centroids) can lead to bad results
not ideal for non-convex shapes, outliers, and clusters with different densities

cluster’s centroid
mean point of the cluster, where the coordinates are the mean values of each dimension (column)
- # of dimensions = # of centroid coordinates
how to deal with k-means clustering issues
pre-process the data → remove outliers, normalize the data
perform multiple runs of choosing different initial random centroids and see how the results changes
measures to assess clusters’ quality
WSS and BSS
WSS
sum of squared errors (each data point’s euclidian distance to its own cluster centroid)
low WSS = high intra-similarity = high within cluster cohesion
WSS=0 if # of clusters(k)=sample size(N)
b/c each point is its own centroid
goal is NOT to minimize WSS b/c can lead to redundant clusters with similar traits

BSS
Euclidean distance b/w each cluster’s centroid and the overall center → square it and weigh it by # of points in each cluster, them sum
high BSS = low inter-similarity = high cluster separation from each other

choosing the number of clusters
Depends on subjective judgement, business goals, or domain knowledge
- use elbow plot and WSS/BSS plot
- clusters are exploratory in nature = no “right” # of clusters BUT there are good and bad solutions
