Field Methods Exam 3
 Call Kai
 Learn
 Practice Test
 Spaced Repetition
 Match
 Flashcards
 Knowt Play
1/27

There's no tags or description
Looks like no tags are added yet.
28 Terms
TL
Total length
(combination of head and body length and tail length)
T
Tail length
(anus to the tip of tail)
HF
Hindfoot length
(heel to tip of longest toe, not including claw)
E
Ear length
(bottom of notch in ear to the tip of ear)
Ano-genital distance
Way to determine sex of a mouse:
Male mice have much greater ano-genital distance
Peromyscus maniculatus
Deer Mouse
Short, bicolored tail
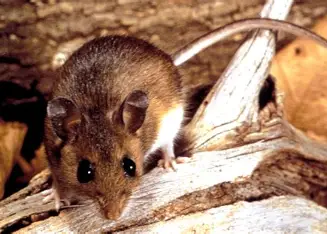
Peromyscus truei
Pinon Mouse
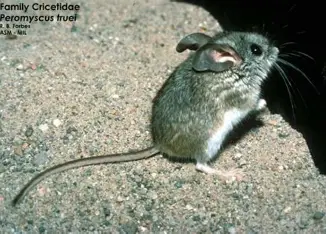
Reithrodontomys megalotis
Harvest Mouse
Grooved anterior face of upper incisors
White belly (venter)
Fluffier fur, cuter

Mus musculus
House Mouse
Smoother, rounder incisors (no grooves)
Dark gray/brown belly (venter)
Microtus californicus
California Meadow Vole (meadow mouse)
Stalky, short tail

Thomomys bottae
Botta’s Pocket Gopher
External fur-lined cheek pouch

Spring Scale (Pesola scale)
Must weigh bag after rodent has been removed and subtract from total weight
Sherman trap
Used in the field
Lightweight aluminum with two folding ends
Treadle
Holds the shutting door of a trap shut- releases and shuts the door when rodent walks over it
Eumeces skiltonianus
Western Skink
Cycloid scales on dorsal and ventral surfaces
Blue tail and dark lateral stripe extending onto tail

Sceloporus occidentalis
Western Fence Lizard
Dorsal scales keeled and pointed
Blue throat and belly patches
Mite pocket at base of neck

Elgaria multicarinata
Southern Alligator Lizard
Elongate body
Dark line/stripe down belly
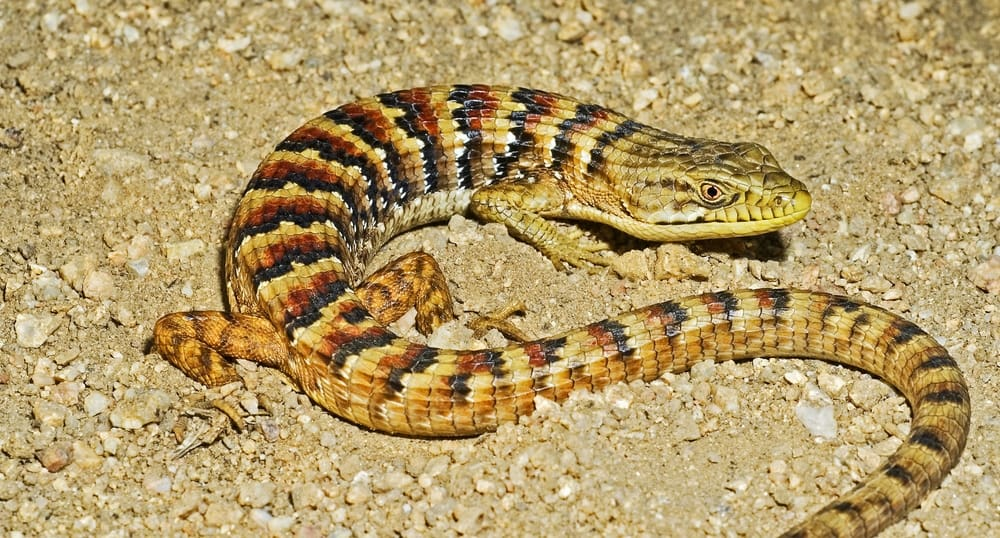
Aspidoscelis tigris mundus
California Whiptail
Spotted/striped back'
Granular scales above, large and square scales below

Ramets
modules of same gen. distinct individual)
Genets
Unique genetic individual produced by zygote
Unbiased sample conditions
Each measurement in the population has an equal opportunity of being selected
The occurrence of one measure in the population does not influence the inclusion of another
N
number of individuals in a population
S
Species richness, number of species
Absolute abundance
Absolute number of individuals in a population
Index of Abundance
Number of individuals found with some sampling effort (in an hour, in a rough area, standardized sampling)
Used for trends
Density
Di = ni / A
(density of species i = total number of individuals counted for species i / area sampled)
Coverage
Proportion of ground occupied by a vertical projection to the ground from the aerial parts of the plant
Ci = ai / A
(Coverage = total area covered by species i / area sampled)
Frequency
The chance of finding a species within a sample
fi = ji / k
(frequency of species i = number of samples (plots) where species i occurs / total number of samples taken (k)