RESEARCH, DATA-ANALYSES & AI (W 1.7)
 Call Kai
 Learn
 Practice Test
 Spaced Repetition
 Match
 Flashcards
 Knowt Play
1/15

Earn XP
Description and Tags
INTRODUCTION DATA ANALYSIS
16 Terms
how has data developed over the decades?
here’s how it went over the decades:
1950s → emergence of computers, enabling electronic data processing
1960s - 70s → development of statistical software like SPSS & SAS
1970s - 80s → introduction of relational databases & SQL for data management
1980s → advent of personal computers, spreadsheets & data visualisation tools
1990s → growth of databases, data mining & early big data techniques
2000s → rise of the internet, web analytics & ecommerce data
2010s → explosion of big data, AI & machine learning
2020s → integration of AI with cloud computing for real-time analysis
present → ongoing advancements in AI, quantum computing & ethical data use
we can store & process more (types of) data & computing is much faster enabling more opportunities

how to make “something“ more tangible?
the most common business request to a data practitioner is: “we should do something with AI & big data.“
in order to execute that “something“ we can use 5 main building blocks to successfully do something with data
5 main building blocks:
value objectives (WHY) → it can either be V2F or V2C
data assets (WHAT)
analytics (HOW) → impact on exploration & modelling
value creation (DO) → insights & performance; customer-firm interface; business model
capabilities (ENVIRONMENT) → systems, organisation, people, process

what do we need to perform analysis?
we need data assets
data can be clustered by source (internal/external) & type (structured/unstructured)
structured & internal data is easier to work with & usually the starting point of analysis
external data can be purchased or gathered via open data sources
with big data tools & the developments in AI unstructured data (like text, images & videos) is used more often

what’s an example of structured external data?
post codes of the Netherlands

what’s an example of structured internal data?
usually there’s already internal structured data available
a company normally stores sales, customers, product information, etc.
a big advantage is that this is usually structured relational data which is (relatively) easy to use

what’s a CRM system?
it’s a system where you can combine data & automate your marketing activities
it’s a technology that keeps track of everything about your customers & potential customers, so you can build great relationships with them
it’s used across all different departments, because it centralises all your important customer information & company data in one place so your teams have the right information to deliver the easy connected experiences customer expect
ex. a customer searched a scooter multiple times in one day, so the marketing team sent her an automated message to come for a test drive; after she comes home with a new scooter, the service team has already sent her an email with all the tips on how to take care of it → using the CRM, sales department can customise her website view with items she loves & IT department can connect her into a scooter-loving community
CRM keeps surprising the customer, as well as makes them happy, because it gives the team one shared goal to fulfil
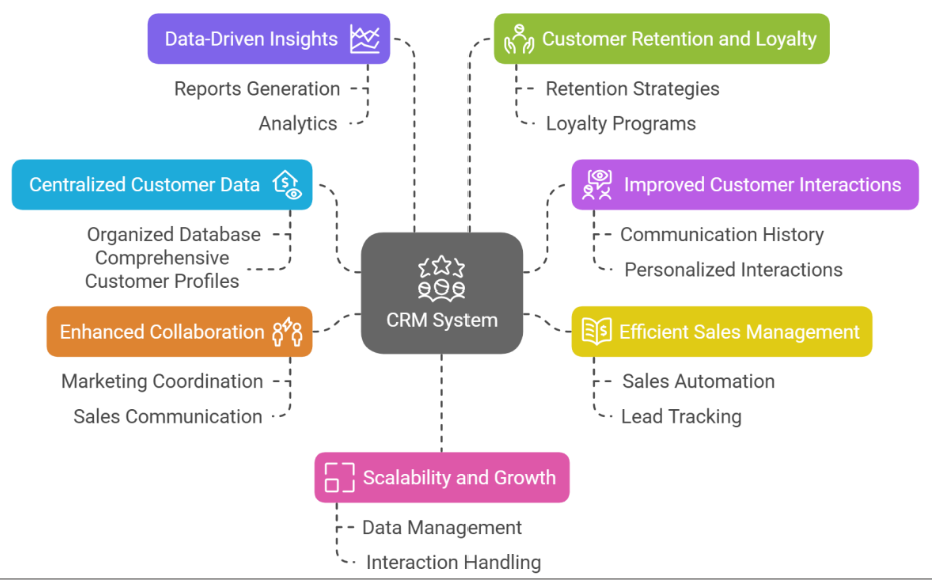
why do we use a CRM system & what are some examples?
we use CRM to:
gain data-driven insights
increase customer retention & loyalty
ensure improved customer interactions
have an efficient sales management
ensure scalability & growth
have an enhances collaboration
have centralised customer data
some example CRM systems:
SalesForce
HubSpot
Dynamics 365
what’s the foundation of a CRM?
THE CUSTOMER
in the CRM system customer data is being stored
this is being connected with other data like transactions & interactions

how do we use CRM to automate marketing activities? how can CRM optimise sales efficiency?
with CRM efficiency can be reached by automating activities
this can be personalised creating dependencies on other events, expected Customer Lifetime Value or retention scores
sales efficiency:
CRM is used to track & optimise the sales activities

which 4 kinds of main analysis do we know?
descriptive analytics → WHAT happened? (reporting & data mining)
diagnostic analytics → WHY it happened? (query & drill-down)
predictive analytics → WHAT WILL happen? (statistics & simulations)
prescriptive analytics → WHAT SHOULD I do? (mathematical optimisation)

what do you know about descriptive analytics (WHAT happened)?
focus: summarising past data to understand events & performance
example question: “how many sales did we have?“
use cases:
sales & revenue reports
web analytics (page views, bounce rates)

what do you know about diagnostic analytics (WHY did it happen)?
focus: investigating causes & relationships in the data
example question: “why did we get the number of sales we realised?“
use cases:
correlation analysis
A/B tests

tell me about predictive analytics (WHAT WILL happen)?
focus: forecasting future outcomes using historical data
example question: “what sales will we have in the future?“
use cases:
predicting customer behaviour
financial forecasting

talk about prescriptive analytics (WHAT SHOULD we do)?
focus: recommending or automating actions based on predictions
example questions: “what should we do to get more sales?“
use cases:
price & inventory optimisation
personalised recommendations

what do you know about AI & its development?
the first AI model was created in 1956 - The Logic Theorist by Alan Newel & Herbert A Simon; the computer programme was designed to prove mathematical theorems in symbolic logic; it played checkers at a competitive level by learning from its own experiences
what’s generative AI?
it’s a type of AI that creates new, original content - such as text, images, audio, video or code, instead of just analysing or sorting existing data