HS300: Measures of Morbidity & Mortality I
 Call Kai
 Learn
Learn Practice Test
 Spaced Repetition
 Match
Match Flashcards
 Knowt Play
1/24

There's no tags or description
Looks like no tags are added yet.
Name | Mastery | Learn | Test | Matching | Spaced | Call with Kai | Chat |
|---|
No analytics yet
Send a link to your students to track their progress
25 Terms
Morbidity
preventable disease
Mortality
preventable death
Incidence
how fast new disease is appearing
Prevalence
How much disease is present right now
The number of cases — new and existing — of a disease or
health condition in a population, at or during some designated timeProvides an indication of the extent of a health problem, a burden measure—how many people have this condition right now
NOT A MEASURE OF RISK
The epidemiologist’s bathtub
Factors that affect prevalence
Incidence rate: the faucet
Recovery/cure rate: the steam
Death rate: the drain
Transfer (migration): the bucket
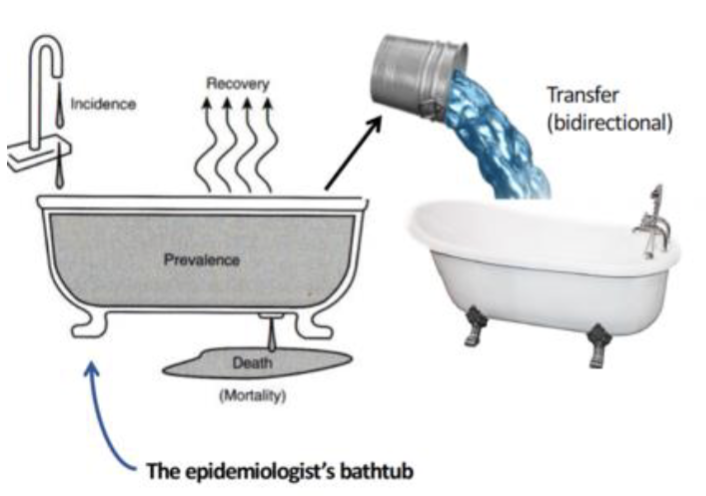
Ways to lower prevalence that does not lower incidence
A cure that shortens duration
A disease that kills faster
Out-migration of cases
Quantifying a disease
Define the disease
A case definition, written down before you count anything.
Count the individuals affected
This is your numerator.
Determine the population the cases arose from
This is your denominator.
Account for the passage of time
Over what period did these cases accrue?
Four elements of incidence
Numerator: number of new cases
Denominator: population at risk
Rate base: multiplier (per 100, 1,000, etc.)
Time: the period during which cases accrued
Should recurrent events in the same person count as new cases?
Chronic disease: count first-ever events (etiologic study)
Infectious disease: recurrence is exactly what you want, anyone can get disease as many times as possible in a year
Population at risk
People capable of becoming a new case
They are at risk of contracting the disease.
They are disease-free at the start of the specified time period.
Individuals not at risk are excluded from the denominator—this matters most with lifelong diseases and with infections that confer immunity
Who should I exclude from the denominator?

The rate base
Multiplier, always a power of 10
Purpose: to express the reported rate as a number equal to or greater than 1, so it can be read at a glance
Cumulative incidence rate
Number of new cases ÷ population at risk
Average risk of developing the disease in this population, over a defined period
Incidence rate (incidence density, person-years incidence rate)
Number of new cases ÷ total person-time of observation
If period of observation is measured in years: Number of new cases ÷ total person-years
Measures how fast disease is occurring per unit of time at risk, stays honest even when people drop out
Person-years calculation
Total the person-years (Subjects A x Years observed B = Person-years A x B)
Calculate the incidence rate
Interpret the result in words
Ex. In a 5-year prospective study of 311 subjects, the incidence rate of colon cancer was 4.9 per 100 person-years.
What incidence data are for
Research on the etiology and causality of disease
Because incidence, unlike prevalence, is uncontaminated by how long people survive.
Estimating the risk of developing a disease
The question a patient actually asks: what are my chances?
Attack rate
An alternative form of cumulative incidence, used when a disease is observed in a population over a short, sharply bounded period — an outbreak rather than a decade
Ill ÷ (ill + well) among the exposed group, during the outbreak
Ex. foodborne outbreak, flu in dorm or cruise ship
Point prevalence
At one moment in time
Cases at one point in time ÷ total population at that time
Period prevalence
Over a stretch of time
Cases during a time period ÷ average population at the mid-point
Uses of prevalence
Describing the burden of a health problem
How much of this condition is there, in this population, right now?
Determining the allocation of health resources
Facilities, personnel, budgets — prevalence answers the planner’s question.
How many people need care right now?
Prevalence and etiology
Prevalence data are less useful for studying the causes of disease because of the survival factor.
A prevalent case is someone who both developed the disease and
lived long enough to be counted. Those are two different things, and
prevalence cannot tell them apart.
The survival trap
Suppose a risk factor doubles the incidence of a disease.
But it also makes that disease rapidly fatal.\
Prevalence among the exposed could be lower than among the unexposed — the exposed cases die before anyone can count them.
A prevalence study would conclude the exposure is protective. This
is why etiologic research uses incidence.
Relationship between prevalence and incidence
P ~ I x D
The prevalence (P) of a disease is proportional to its incidence rate (I) multiplied by the average duration (D) of the disease.
The relationship is most accurate when incidence and duration are both relatively stable.
Higher incidence, or longer duration, produces higher prevalence.
When duration is short
For many infectious diseases, prevalence becomes similar to incidence.
Short duration means cases leave the tub quickly: they
recover rapidly, or they die.Ex. cold, ebola
When duration is long
For chronic disease — diabetes is the standard example — prevalence stays high and keeps climbing even when incidence is flat or falling.
The result is a large and widening gap between the incidence and the prevalence of the disease.