elasticity
 Call Kai
 Learn
Learn Practice Test
 Spaced Repetition
 Match
Match Flashcards
 Knowt Play
1/22

Earn XP
Description and Tags
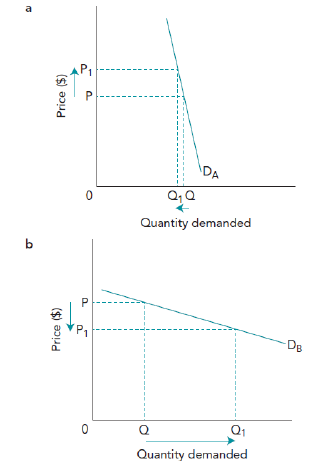
where a small change in price or income can result in large changes in the quantity demanded
Name | Mastery | Learn | Test | Matching | Spaced | Call with Kai | Chat |
|---|
No analytics yet
Send a link to your students to track their progress
23 Terms
elasticity and an example
where a small change in price or income can result in large changes in the quantity demanded.
inelastic and an example
when a large change in price or income results in a small change in the quantity demanded.
PED
measures responsiveness of quantity demanded for a product following a change in price, ceteris paribus.
PED = (% change in quantity demanded) ÷ (% change in price)
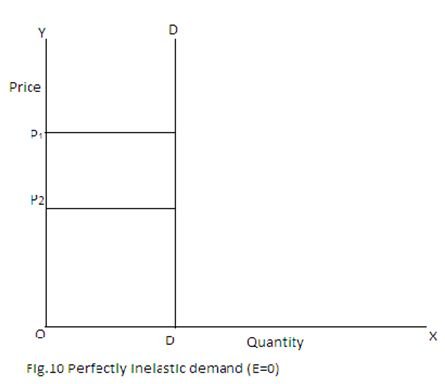
Perfectly inelastic
when PED = 0, demand is perfectly inelastic; it is completely unresponsive to price changes
perfectly elastic
when PED = relative change in quantity demanded is infinite

Unit elasticity
when PED = 1, change in price is exactly matched by the fall in quantity demanded

factors that affect PED, give an explanation for each
~ availability and attractiveness of substitutes
~ the relative expense of the product
~ the time period, short run/ long run
PED: availability and attractiveness of substitutes
The greater the number of substitute products and the more closely substitutable those products are, the more it can be expected that consumers will switch away from a particular product when its price goes up
PED: the relative expense of the product
A rise in price reduces the purchasing power of a person’s income and their ability to pay for products. The larger the proportion of income that price represents, the larger the impact is on the consumer’s income as a result of a change in the product’s price.
PED: the time period, short run/ long run
In the short run, perhaps weeks or months, people may find it hard to change their spending patterns. In the longer run, if the price of a product goes up and stays up, then over time people will find ways of adapting and adjusting, so the PED of a product is likely to increase over time.
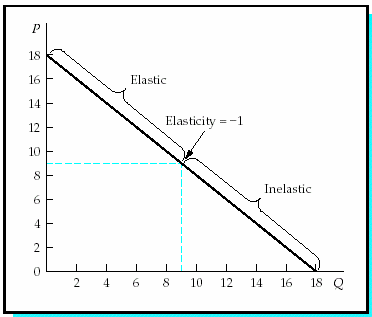
PED & liner demand curve
This results in demand being price elastic on the upper part of the demand curve. The reverse applies and explains why PED is inelastic in the lower portion of the demand curve.
Income elasticity of demand (YED)
measures the responsiveness of the quantity demanded for a product following a change in income. More simply, it measures how the quantity demanded is affected by a change in a consumer’s income.
YED = (% change in quantity demanded) ÷ (% change in income)
If demand is responsive to an income change, the percentage change in quantity demanded will be greater than the percentage change in income. This produces an income elastic outcome and a YED which is greater than 1. Where demand is not responsive to an income change, then the quantity demanded is income inelastic and has a value of less than 1.
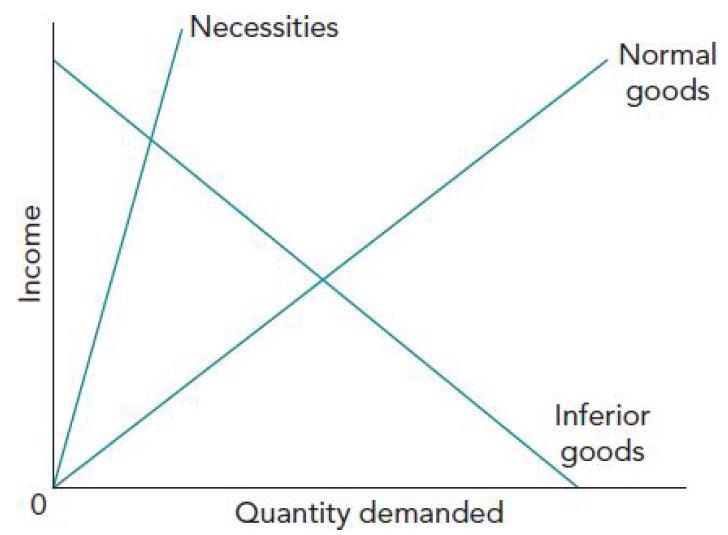
The classification of goods in relation to income
~ A normal good is one where the quantity demanded increases as income increases.
~ An inferior good is one where the quantity demanded decreases as income increases or increases as income falls.
~ A necessity good is a type of normal good for which the quantity demanded is unlikely to change when income changes. A necessity good for one family could be a normal good for a better-off family.
~A superior or luxury good has a positive YED that is greater than 1 and is a normal good where the quantity demanded is responsive to changes in income.
cross elasticity of demand XED
measures the responsiveness of the quantity demanded for one product following a change in the price of another product.
XED = (% change in quantity demanded of product A) ÷ (% change in the price of product B)
XED
XED can be both elastic and inelastic. Demand is cross elastic when the quantity demanded for one product responds more than proportionately (to a greater degree) to a change in the price of another product. This leads to an XED that is greater than 1. When the quantity demanded for one product responds less than proportionately to a change in the price of another product, demand is said to be cross inelastic.
The sign of the XED
~ Where the XED is positive, the two goods are substitutes. The positive sign shows that the products are substitutes; the size
indicates that they are reasonably close substitutes.
~ XED is negative when the two products are complements or jointly demanded
~The sign indicates a negative one between complements and the numerical value indicates a weak relationship.
~An XED of zero indicates that there is no particular relationship between two products.
PED can be used to explain:
~price variations in a market
~the impact of changing prices on consumer expenditure and sales
revenue
~the effects of changes in indirect taxes on government income
Relationship between PED and price variations in a market
businesses use price variations to increase their revenue. They are aware of variations in PED in their markets and try to use the opportunities presented to them to increase sales and revenue.
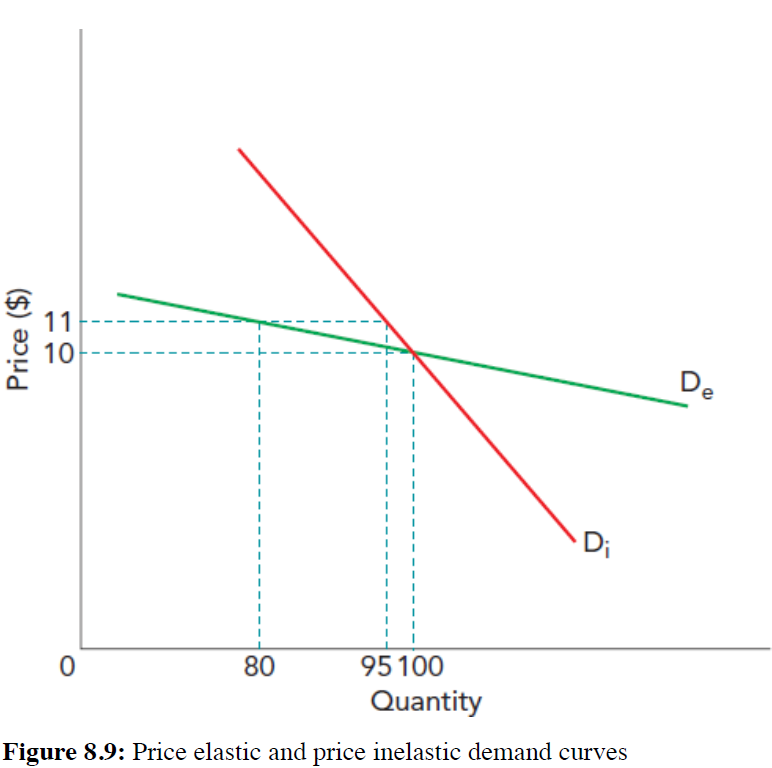
~ When demand is price inelastic, a business is able to increase price in order to increase its revenue
~When demand is price elastic, the business should decrease price to increase the quantity demanded and therefore revenue.
How some firms use PED to make their product more price inelastic in order to increase revenue.
~Firms use persuasive advertising to try to influence (persuade) consumers to buy a product.
~A firm may create a brand image (branding) for its products in order to make the products appear superior when compared to similar products from competitors
~A firm takes over or merges with a competitor to increase market share and therefore control over a market.
~A firm creates a monopoly product where a firm is the only producer of the product which is protected by a patent or regulations.
Income elasticity of demand (YED)
YED provides information on how the quantity demanded varies with a change in income.
It is potentially of great importance for firms and for governments in forecasting the future demand for a whole range of consumer goods and services. In emerging markets as incomes increase, then people demand more. Government spending needs to be changed to allocate more resources to build more roads to accommodate the increased demand for personal and business mobility.
If the YED for a normal good is greater than 1, then demand will beexpected to grow more quickly than consumer incomes.
If YED is negative, in the case of inferior goods, firms that produce these can expect their sales to decline when the economy is doing well;at a time of recession, though, demand for their product is likely to increase.
Cross elasticity of demand (XED)
~Many firms are concerned about the impact that competitors’ pricing strategies will have on the demand for their own products. Remember that substitutes are characterised by a positive XED: the higher the price, the more likely it is that consumers will buy a cheaper substitute. In such cases, there is a high degree of interdependence between suppliers, and the dangers of a competitor cutting its price are likely to be significant.
~The size of the XED is important. Suppose a firm has an XED of 1.5with another related product. This indicates that a 10% decrease in price is likely to cause a 15% decrease in the quantity demanded of its own product. An even higher XED would lead to an even greater decrease in the quantity demanded.
Cross elasticity of demand (XED) 2
~In practice, there are many practical problems, which mean that elasticity values are best seen as reasonable estimates. This is because in all three cases we are trying to measure change in the market and this is by no means easy, as data for two points in time are required. For instance, consider the difficulties of calculating PED values from past data. Have the price changes only been caused by supply variations? Have there been any non-price influences at work?
~need to separate out all the other influences that affect the quantity demanded and to only measure the impact of the price change alone on quantity demanded.
Cross elasticity of demand (XED) 3
~need to separate out all the other influences that affect the quantity demanded and to only measure the impact of the price change alone on quantity demanded.
~ Therefore, many firms may prefer to make rough estimates of elasticity values or to work with incomplete data, particularly if they are operating in markets where rapid change means past data has only limited value.