Animal Genetics Exam 3
 Call Kai
 Learn
Learn Practice Test
 Spaced Repetition
 Match
Match Flashcards
 Knowt Play
1/156

There's no tags or description
Looks like no tags are added yet.
Name | Mastery | Learn | Test | Matching | Spaced | Call with Kai | Chat |
|---|
No analytics yet
Send a link to your students to track their progress
157 Terms
Qualitative
Types of Traits
_________ (SIMPLE)
Discrete phenotypes
Black/White
Horns/No Horns
Few genes (usually 1)
Little or no effect of the enviornment
EX: coat color
Quantitative
Types of Traits
___________(COMPLEX)
Measured phenotypes
weight, height
litter size
Many genes (>1) → hundreds or thousands of genes contribute
Enviornmental effect can be large
EX: growth rate
Many genes
Measured traits
Enviornmental influence
Quantitaive traits (3 characteristics)
________
_______
_______
continuous scale
Quantitative Traits - Measured traits
Measured on a ________
# of progeny born/weaned
weight height
Nutrition
Climate
Disease
Quantitative Traits - Enviornmental Influence
______
______
_____
single gene
Quantative Traits - Consequences
Can’t see the effect of a _______ among the many involved (Masks genes)
Must separate genotypic effect from enviornmental effect → want to know WHAT can be passed down and what is soley due to the enviornment
Phenotypes
________: the sum of a genetic effect (that an individual inherits) and an enviornmental effect (that an individual recieves)

normally distributed
Quantiative Traits are (usually) ____________.
This is due to:
an underlying genetic distribution
an underlying enviornmental distribution
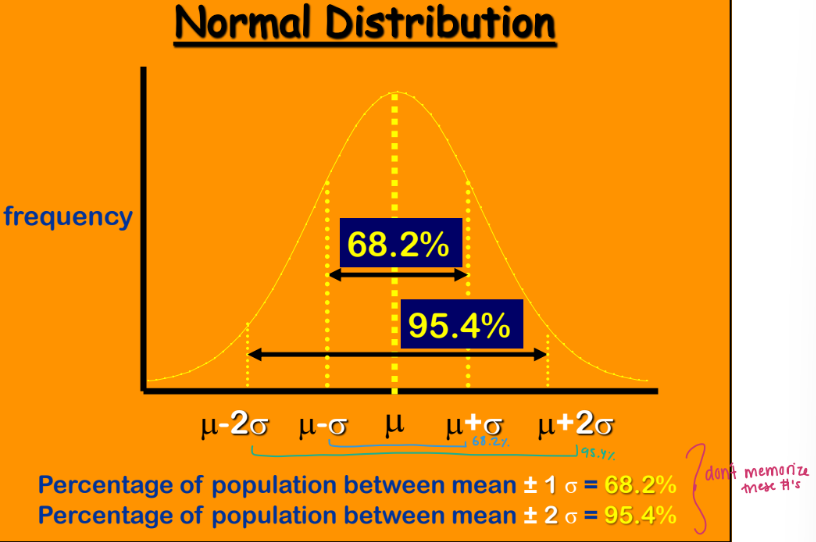
Normal distribution
__________- can be described by a mean and standard deviation
selection
It is the genetic variance in quantitative traits that allows ____ of (genetically) superior animals
arithmetic average
Population
Mean (mu) - _________
Population measure - no singular individual, need at least two individuals
Distribution of records? don’t know the range

spread
standard deviation
Weaning weight in cattle
Both populations have the same average BUT THEY ARE NOT THE SAME → _____/_____ are different

variance
Statistics describing variation
________ (sigma squared)
describes the spread of a normal distribution

greater
Variance
Must be greater than zero
The greater the deviations, the _____ the variance (more spread)

squared
Example: mean and variance
Note that the units are ______

square root
Standard deviation - ______ of variance

symmetric
Normal Distribution
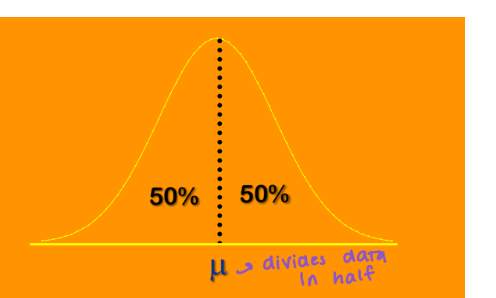
The curve is _____ about its mean
50% of the population is above the mean and 50% is below the mean
Review
Normal distribution
Review
Example 1

Review
Example 2


Using the normal distribution

relationships
Covariance and Correlation → measures of ________ between traits
How are two traits related?
Height & Weight
Milk yield & %protein
Trait X and Trait Y

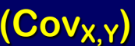
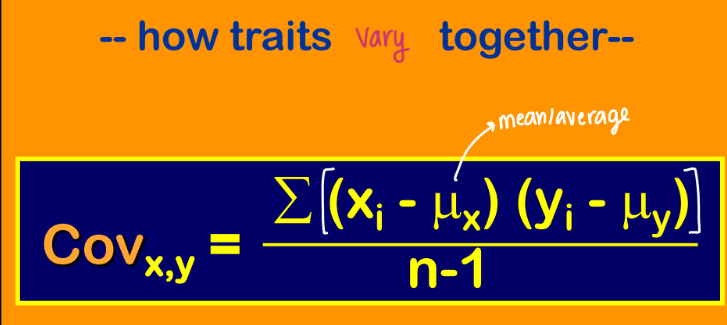
Covariance (________)
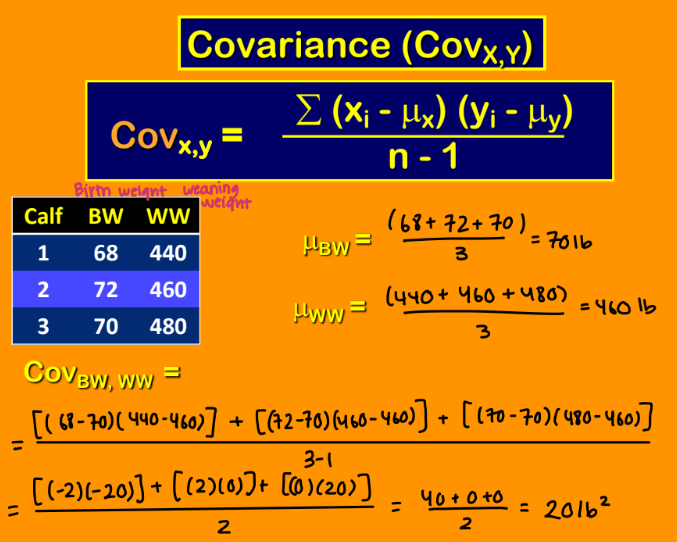
How traits vary together
Review
Covariance calculation example
Review
_____ Covariance

Review
______ Covariance

positive
negative
Positive Covariance
Variation - deviation from the mean
______ deviations in one trait tend to be paired with positive deviations in the other trait.
______ deviations in one trait tend to be paired with negative deviations in the other trait
Negative
_____ Covariance
inverse relationship

negative
positive
Negative Covariance
positive deviations in one trait tend to be paired with _____ deviations in the other trait.
negative deviations in one trait tend to be paired with _____ deviations in te other trait.
Zero
Covariance of ___ occurs when two traits are independent.
NO RELATIONSHIP BETWEEN 2 TRAITS

correlation
Units of covariance are difficult to interpret so we more often utilize ______

association
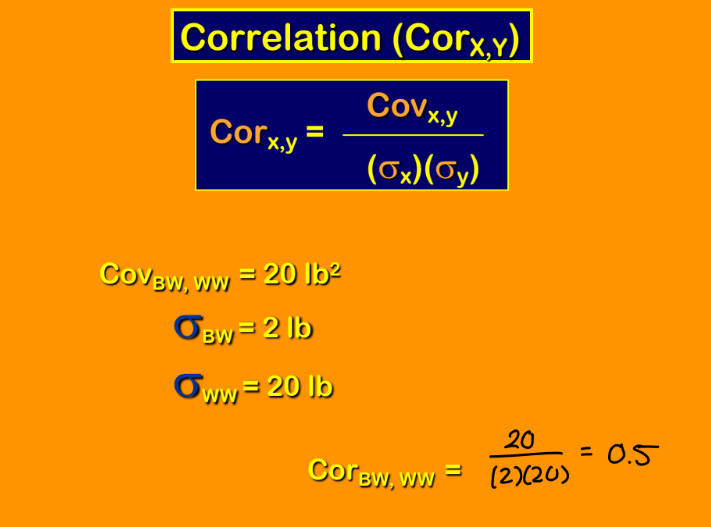
Correlation (Corx,y) - standardized measure of the degree of _____ between two traits

Review
Correlarion calculation example
positive
negative
Correlation
It can range from -1 to +1
A ____ value means that an increase in one value is associated with an increase in the other value.
A ____ value means that an increase in one value is associated with a decrease in the other value.
strength
Correlation
The absolute value of the number is a measure of the _____ of the correlation
The higher the number the stronger the association (Closer to 1)
Ex: A correlation of -0.7 indicates a stronger degree of association than does one of 0.5 (don’t care about size)

Direction
Strength
Amount of Change
Correlation
3 basic aspects:
_______(sign of the relationship)
Positive, negative, nonexistent
________ of relationship
Strong (>.7), moderate (.4-.7), weak (<0.4)
__________ expected → stronger correlation the more I move one trait that more I move the other (depends on strength)

causation
Correlation does not mean __________!
It is important to remember that correlations, even strong ones, do not imply cause-and-effect!
Correlations may exist for many reasons.

simple
Types of Traits
Qualitative Traits (_______)
Traits that we observe (categories)
Black or red coat, horns or no horns
Complex
Types of Traits
Quantitative Traits (______)
Milk production, weaning weight
Many genes influene trait → normal distribution
Average
Quantitative Traits
Mean
_______ performance in a population
Variance
Quantitive Traits
Variance, standard deviation
Measure of ____
How much individuals vary from each other (and from mean)
Relationship
Quantative Traits
Covariance, correlation
________ between two traits
Covariance
Relationships between traits
______
How 2 traits vary together
Standardized
Relationships between traits
Correlation
_________ measure of covariance
Measures the strength/degree of association
It can range from -1 to +1
Direction
Strength
Change
Correlation
3 basic aspects:
______ (sign of the relationship)
Positive, negative, nonexistent
______ of the relationship
Strong, moderate, weak
Amount of ____ expected
by changing one trait how much does the other change
**Need to know more precisley the relationship between traits

predict
Regression:
If one trait changes, can we _______ how much the other one will change?
Regression
_________: the change in one variable per unit change in the other

Dependent
Independent
Regression
Y = _______ variable
X = _______ variable

first
Regression X/Y
X will be the trait you measure ____ in an animals life

same
opposite
Regression
(+) traits go in the _____direction → increase in one increase in other
(-) traits go in the ____ direction → increase in one causes a decrease in other

regression equation
How do we use regression?
Regression: useful statistic, gives the units of change in one trait for every unit change in another
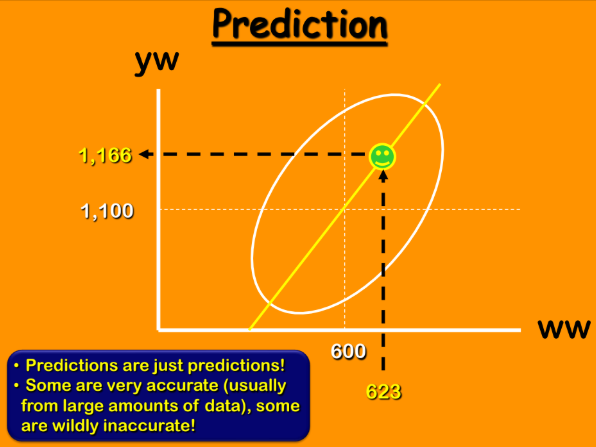
Most useful when used to predict the value of one variable (trait) using the value of another variable (trait): _______

innacurate
Prediction
Predictions are just predictions!
Some are very accurate (usually from large amounts of data) some are wildly __________!
accuracy
Accuracy and Correlation
The stronger the correlation, the higher the _____ (better prediction → shorter range)
Weak correlation: expect great deviation from your prediction

Many genes
Quantiative Trait: trait that is affected by _______
Each gene has a small effect → because there are many genes
Many economically important traits in animals

Breeding Value
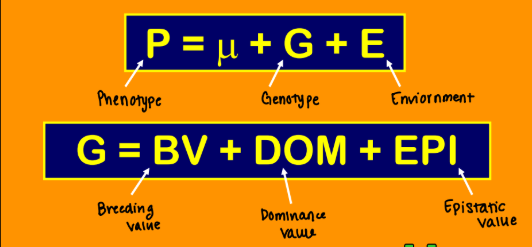
BV = _______ - value of indivdual alleles (contribution of each allele)

Dominance Value
DOM = _____- Value of allele combination (value of pair)
Epistatic Value
EPI = ______ value of allele interaction across loci

Genetic Value (BV, DOM, EPI)
Animal → Own Performance → _________

Breeding Value (BV)
Animal → Own Performance → _______
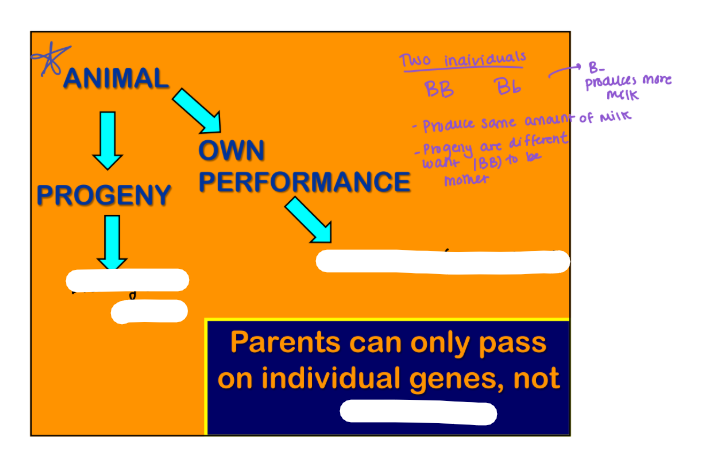
combinations
Parents can only pass on individual genes not _______
Breeding Value
_______ (or additive genetic value)
value of individual alleles
value of an indiviudal as a parent
the value of genes to progeny
Dominance
Epistasis
Genetic Value
The value of genes to self
Includes _____ and _____ (Cannot be passed on to progeny)
depends on combination of alleles, cannot be inherited
Own Performance
Focus: ________

Progeny’s Performance
Focus: _________

genetics
Heritability
How much of the variation in a population is due to ________
Genetic Variation
Heritability is the proporiton of phenotypic variation that is caused by ______
Not controlled by genetics → controlled by enviornment
Broad sense
Heritability (h²**)
_____: proportion of the phenotypic variation that is due to genetic variation

Narrow sense
Heritability (h²**)
_____: proportion of the phenotypic variation that is due to breeding value variation

Genetic
Enviornmental
Heritability
0 < H²b < 1
Closer to 1 (greater heritability) more _____ influence
Closer to 0 (less heritability) less genetics more ____ contibution
Reproductive
Growth
Carcass

0.6
Few traits have h² > ____
breeding value
h² - proportion of the phenotypic variation that is due to ______ variation
Review
Example - review interpretations

NO UNIVERSAL
There is _______ heritability for any trait
Specific to one population, in one enviornment
enviornments
Heritabilities for the same traits can differ if animals are producing in different ________
over time
Heritabilities can change _______ (as genetic variance changes in response to selection)
BV
What do we use heritability for?
To determine the _____ of an animal
How much of an individual superiority is due to (additive) genetics versus enviornmental effects

selection
What do we use heritability for?
To predict response to ______
How much of the superiority of a group of selected animals will be transmitted to the next generation
One
Types of Traits
________ measurement taken
Ex: birth weight → impossible to measure this twice
Multiple
Types of Traits
_______ measurements taken
Ex: litter size, milk yield
PE
TE
Enviornmental Variation
Enviornment (E) - permanent and temporary enviornment
____- influences all records of an individual → injury that changes mammary gland: forever changes milk.
____- influences a single record, different TE for each record → different foods, weather

Repeatability
Two definitions of ______
The degree of association between repeated records (same trait being measured multiple times) on the SAME animal
Correlation between repeated measures

Importance of repeatability
Repeatability and ______
*Keep the animal with the best trait that has the highest repeatability (more likely that this animal will perfrom the same again and again)

h²
In a population, what values do we want for heritability and repeatability?
______= proportion of phenotypic variation due to BV
higher = any one record = good indicator of an animal’s BV (connection between phenotype and BV)

r
In a population, what values do we want for heritability and repeatability?
______= Correlation between repeated records on the same animal → could be negative
higher = any one record = good indicator of an animal’s producing ability (good indicator of NEXT production measuremnt)

uniform enviornment
Improving h² and r: _______
Performance - not a good indicator of BV because of ENVIORNMENTAL differences

h²
Improving h² and r
Increased ____ due to uniform training enviornment
*Not BEST enviornment just CONSISTENT enviornment

consistent
Improving h² and r
Manage animals so that enviornmental effects are _____
Examples
Thoroughbred- provide similar training
Dairy (milk production) - provide similar feed
Beef (weaning weight) - provide pastures of similar quality, same vaccinations
uniform
Minimize enviornmental differences
Not making the enviornment better, making the enviornment more ___

n+1
Repeatability of N Records (rn)
Repeatibility of n previous mesured records and the _____ record

decreases
Repeatability of N Records (rn)
Adding more records: increased repeatability
Reduced value from adding more records (rate of increasing repeatability ______)

n
Predicting Next Record
Example: predicting the n+1 record from performance in ___ previous records
Using repeatability to predict the next performance


How do we campare records in a population?


Predicting Next Record

genetic diversity
Breeding Captive Populations
What are the objectives and how do we achieve them?
to maintain _________ so they can survive.
sex limited
Domestic Animal Breeding
Problem: want to improve milk yield through selection of male, how can this be done.
Milk yield is a _______ trait (males carry genes to produce milk but their physiology prevents milk production)
can select males to increase the productivity of the daughters
Breeding captive populations
Objective: Maintain genetic diversity
Process
Sample wild population (founders)
Breed each generation to maintain as much of the original diversity sampled as possible
do not mate individuals that are closley related → do not want to increase homozygosity
female relatives
Domestic Animal Breeding
Male slection for a sex limited trait
Utilize information from _______ to evaluate the potential of a male as a parent
Works because of sharing of genes in common and the accuracy depends on how closley related the male is to the females with records
relatedness
Strategies
All of these strategies are based on calculations of the degree of ______ of individuals in the population
additive genetic relationship
Relationships
Related animals have genes in common
Causes → resemblance in appearance and similalrity in performance
Use _________ (ax,y) to quanitify the degree to which two animals are related