FIN 4424 Exam 1
 Call Kai
 Learn
Learn Practice Test
 Spaced Repetition
 Match
Match Flashcards
 Knowt Play
1/78

There's no tags or description
Looks like no tags are added yet.
Name | Mastery | Learn | Test | Matching | Spaced | Call with Kai | Chat |
|---|
No analytics yet
Send a link to your students to track their progress
79 Terms
=AVERAGE(C9:F9)
How to compute Arithmetic mean in excel? (as shown in example excel sheet)

=GEOMEAN(C10:F10)-1
How to compute Geometric mean in excel? (as shown in example excel sheet)

a) =IF(B31>=90,"A","B")
b)=IF(B31>=90,"A",IF(B31>=80,"B","C"))
If statement example
(formula gonna be included on exam is IF(logical test,value_if_true,value_if_false))
a) if given that excel formula and info, how would you set up an IF test where a score of 90+ is an A and below 90 is a B?
b) What if 90+ is an A, 80+ is a B, and below 80 is a C?

a) =IF(B47>=200,"HEAVY",IF(B47>=100,"MEDIUM","LIGHT"))
b) =IF(AND(B47>=200,B47<500),"HEAVY",IF(AND(B47<200,B47>=100),"MEDIUM",IF(AND(B47<100,B47>=0),"LIGHT","NA")))
a) what excel formula would you use to have the cell represent "Heavy, Medium, or Light" based on the weight given in the inputs? (Heavy 200+, medium 100-200, light is below 100)
b) if you wanted to be even more exact, and make Heavy between 200-500, medium from 100-200, and light from 0-100, how would you do so?

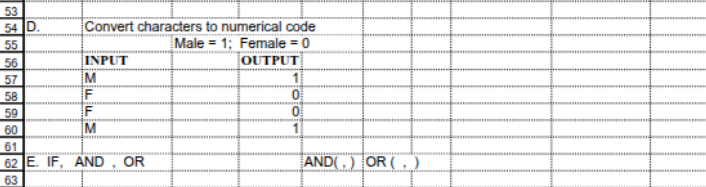
**using B57 as example, normally you would plug in whichever cell you are testing
=IF(B57="M",1,0)
What excel formula would you use if you wanted to represent M as 1 and F as 0. (Male=1 and Female=0)
***Using cell B75 thru D75 for this example, but you would use whatever line from the chart you are testing
=IF(AND(C75>=B75,C75>=D75),"GOOD",IF(OR(C75>=B75,C75>=D75),"OK","BAD"))
Formula given on formula sheet should be: IF( AND( , ), GOOD, IF( OR ( , ), OK, BAD ) )
what excel formula would you use to do this analysis for each firms data?

y = a + bx
Formula for a straight line
Percent of Sales Method, Trend function, and Regression function
What are the three forecasting techniques?
a) Simple and Multiple
b) Coefficient estimates (e.g., Beta), t-values, R²
c) Regression: fitting the best line to a data set
1. Estimating linear relationships between variables
2. Forecasting
a) What are the two types of regression analysis?
b) 3 things need to know for regression analysis?
c) Generally what is regression doing? What are the two main things Regression is used for?
Simple regression
There is only one independent variable.
Y = a + bX
where Y is called a dependent variable and X is called an independent or explanatory variable
Example:
(1) Stock return = a + b Market return,
(b is stock beta)
(2) Sales = a + b interest rates
Multiple regression
There are more than one independent variables.
Y = a + bX1 +cX2 + dX3
Example: Housing price appraisal. where Y is housing price and X's are characteristics of a house such as size, garage, pool, land size
R^2=0.4
Means that the regression model (or X variables used in the model) explains 40% of the variation in Y. It shows how well the regression model fits the underlying data. Higher, the better fit.
Moneyball hypothesis
Before 2004, market was inefficient. This showed a significant relation between winning and on base percentage
P0 = D1/K-g
Gordon Model formula (Constant dividend growth) **not provided need to memorize
R = Rf + B(Rm - Rf)
CAPM formula need to memorize
a) k= (D1/P0)+g
b) P0= D1/(k-g)
a) Formula for Undervalued stocks if their expected returns (k) are above the CAPM benchmark returns (e.g., Boatman)
b) formula for Undervalued stocks if the market prices are below their intrinsic values (Po). E.g., First Chicago.
=FV(C5, C4, 0, -C3, 0)
***very important to remember that you make the PV negative or it will be wrong**
**also pay attention to know you NEED to fill in all five, even if no value you put a 0 in the formula
****Must know how to fill out excel formula**
one given on exam is:
FV(Rate, Nper, Pmt, PV, Type)
Present Value 1000.00 (c3)
Years 1 (c4)
Rate 10% (c5)
What would be the excel formula to find FV? Which part is negative?
=PV(F5, F4, 0, -F3)
***very important to remember that you make the FV negative or it will be wrong**
**also pay attention to know you NEED to fill in all five, even if no value you put a 0 in the formula
****Must know how to fill out excel formula**
one given on exam is:
PV(Rate, Nper, Pmt, FV, Type)
Future Value 1,100.00 (F3)
Years 1 (F4)
Rate 10% (F5)
What would be the excel formula to find PV? Which part is negative?
Where Rate is the interest rate per period
Nper is the total number of periods
Pv is the present value
* Pmt and type are included to handle annuities.
PV(Rate, Nper, Pmt, FV, Type)
FV(Rate, Nper, Pmt, PV, Type)
will be given the above formulas, what does each part stand for?
=PV(C4, C5, -C3, 0, 0)
**because payments are going to things like car/home and are true pmts, that is the necessary negative value
Pmt is set to the dollar amount of the periodic payment
Given chart of info for annuity then asked to do PV excel formula
Payment 100 (C3)
Interest Rate 8% (C4)
Number of Payments 5 (C5)
Present Value $399.27 (C6)
Which part of the formula will be negative this time? Why?
Formula given: PV(Rate, Nper, Pmt, FV, Type)
a) =FV(C4, C5, -C3, 0, 0)
**because payments are going to things like car/home and are true pmts, that is the necessary negative value
Pmt is set to the dollar amount of the periodic payment
b) End =FV(C4, C5, -C3, 0,0) *same as above meaning above was asking assuming end*
Beginning =FV(C4, C5, -C3, 0, 1)
FV of an annuity
a) Given chart of info for annuity then asked to do FV excel formula
Payment 2000
Interest Rate 7.50%
Number of Payments 30
Which part of the formula will be negative this time? Why?
Formula given FV(Rate, Nper, Pmt, FV, Type)
b) You deposit $2,000 each year into your IRA account which will earn an average of 7.5% per year, how much will you have after 30 years? Do one for if paid in beginning and one for end excel formula for end and for beginning
=PMT(C5, C4, C2, -C3, 0)
to solve for PMT you make FV the negative value
Solving for an annuity payment
PMT(Rate, Nper, Pv, Fv, type)
Above is formula will be given
You want to set aside equal amount each year to save for the 10,000 downpayment, beginning one year from today. How much will you need to save each year, if your savings will earn a rate of 4% per year?
***make sure to recognize question for PMT and know which part needs to be the negative
*make sure to follow formula above exactly in order

=Nper(C6, -C5, -C3, C4, 0)
In this scenario you must make TWO inputs negative, Pmt and PV
Solving for N in an annuity
Will be given info and this formula
Nper(Rate, Pmt, Pv, Fv, Type)
which one(s) must you put as negative if you follow the formula to be correct?
There are no negatives for RATE
Solving for i in an Annuity
formula will be given
RATE(N, Pmt, Pv, Fv, Type)
When given a chart of info, which input should be the negative, if any in the formula?
1. PV(8%,10,-1500,0,0) =
10,065.12 < 10,500
2. IRR = 7.073% < 8%
Suppose that you are approached with an offer to purchase an investment which will provide cash flows of $1,500 per year for ten years. The cost of purchasing this investment is $10,500. If you have an alternative investment opportunity which will yield 8% per year, which should you accept?
1. Compare PV with the cost.
2. Compute IRR (rate of return) and compare with 8%.
a) PV formula using during retirement stats
b) PV formula using before retirement stats
c) PMT formula using before retirement stats
In an example we are given a chart of info titled Retirement Worksheet
given stats for before retirement and during retirement
What excel formula would you use for:
a) Savings required at retirement?
b) Investment required today?
c) Annual investment required?

a) =NPV(C9, C4:C8)
b) =FV(C9, 5, 0, -NPV(C9, C4:C8))
***NOTICE how you can use real numbers for this one because you are given a chart with 5 years and no pmt info*** also remember for FV that PV needs to be the negative
*for part B remember how you answer FV AFTER finding NPV by using NPV as PV, that is exactly what is shown above
*for some reason dont put an input for type in part B
Uneven cash flow streams example Q (NPV)
NPV excel equation given
NPV function
NPV(rate, value1, value2,..)
and FV(Rate, Nper, Pmt, PV, Type)
Year/Csh flow
1/ 1000 (C4)
2/ 2000 (C5)
3/ 3000 (C6)
4/ 4000 (C7)
5/ 5000 (C8)
Interest Rate 11.00% (C9)
a) Find the present value of the 5 cash flows
b) Find the future value for the 5 cash flows
a) where the initial rate is arbitrary
b) =IRR(C3:C8, 10%)
Uneven cash flow streams example Q (IRR)
formula will be given is
=IRR(cash flows, initial rate)
a) what part of the formula is arbitrary?
b) here is the info given, use this to find the Yield %, What are we solving for when asked to find Yield%?
Year/Csh flow
0/ (10,319.90) (C3)
1/ 1000 (C4)
2/ 2000 (C5)
3/ 3000 (C6)
4/ 4000 (C7)
5/ 5000 (C8)
K = D1/Vcs + G
Where D1 is the Dividend
Vcs is the current market price
G is the growth rate.
Dividend discount model formula (not excel formula) what does each variable stand for
=SUM(F9:F11 X G9:G11)
Array Sum excel formula that would be the answer (from notebook)
Fama-French
-Regress the excess return of a set of portfolios (Ri - Rf) against the excess market return, SMB and HML
-and see whether the average of the intercept estimates is close to zero.
-Ri = Rf + B1*(MKT) + B2*SMB + B3*HML
-Ri - Rf = B1*(MKT) + B2*SMB + B3*HML
FamaFrench model formula
=(Coupon rate*Redemption Value)/PV found
Current yield
Owner Earnings = NI + DEP - Capital Expenditures - WC
Formula for owner earnings
undervalued, undervalued, useless
-If the intrinsic price > market price, ____.
-If the expected return > the benchmark reuturn (CAPM),_____ .
-if B=0 regression model is ____
Alpha
1. A measure of performance on a risk-adjusted basis.
- gauges the performance of an investment against a market index used as a benchmark, which measures volatility or risk, and is also often referred to as "excess return" or "abnormal rate of return."
2. The abnormal rate of return on a security or portfolio in excess of what would be predicted by an equilibrium model like the capital asset pricing model (CAPM).
Beta
1. a measure of the volatility, or systematic risk, of a security or a portfolio in comparison to the market as a whole.
2. calculated using regression analysis. ___ represents the tendency of a security's returns to respond to swings in the market.
3. A security's ___ should only be used when a security has a high R-squared value in relation to the benchmark.
4.A ___ of 1 indicates that the security's price moves with the market. A ____ of less than 1 means that the security is theoretically less volatile than the market. A ___ of greater than 1 indicates that the security's price is theoretically more volatile than the market.
CAPM
A model that describes the relationship between systematic risk and expected return for assets
Geometric Mean
excel example: =GEOMEAN(A1:F1)-1
or :(return 1 x return 2)^1/n
1.The geometric mean is the average of a set of products, the calculation of which is commonly used to determine the performance results of an investment
AM>GM
Arithmetic Mean
excel: =Average(A1:F1)
or: return 1+ return 2+ return 3/3
A mathematical representation of the typical value of a series of numbers, computed as the sum of all the numbers in the series divided by the count of all numbers in the series.
Percent of Sales Method
Example:
2014 COGS/2014 Sales,
2013 COGS/2013 Sales,
average the two
Two year average x 2015 Sales
=Percent of sales
Trend Analysis
An analysis that focuses on aggregate sales data over a period of many years to determine general trends in annual sales
Trend Function
TREND(known Ys, Known Xs, New Xs, Const)
Constant: True or False
True:non zero intercept
False: zero intercept
Regression
Statistical measure that attempts to determine the strength of the relationship between one dependent variable (usually denoted by Y) and a series of other changing variables (known as independent variables).
Linear Regression (simple regression)
Y= a + Bx +u
Y: variable you try to predict
X: Variable that you are using to predict Y
a: the intercept
B: the slope
u: the regression residual
Multiple Regression
Y= a + b1 * X1 + b2 * X2 + b3 * X3 +u
Coefficient example
located under the constant.
:For example if the Coefficient is labeled 'Height' 106 then fore every unit added to height then the wieght will go up by 106 pounds
R-Squared
1. statistical measure that represents the percentage of a fund or security's movements that can be explained by movements in a benchmark index.
2. An ___ of 100% means all movements of a security are completely explained by movements in the index. A fund with a low ____, at 70% or less, indicates the security does not act much like the index.
3. ___ indicates how useful the (beta) is.
So a low ___ and a low beta means that stock's performance is UNRELATED to its benchmark
T- Value
1. measure of the statistical significance of an independent variable b in explaining the dependent variable y.
2. this statistic measures how many standard errors the coefficient is away from zero. Generally, any ___ greater than +2 or less than - 2 is acceptable.
3. The higher the ___, the greater the confidence we have in the coefficient as a predictor. Low ___ are indications of low reliability of the predictive power of that coefficient.
Moneyball Hypothesis
1. Using statistical analysis, small-market teams can compete by buying assets that are undervalued by other teams and selling ones that are overvalued by other teams.
2. on-base percentage was an undervalued asset and sluggers were overvalued.
Dividend Discount Model
is a quantitative method used to estimate a stock's intrinsic value by calculating the present value of all its expected future dividend payments
Value of Stock = Dividend per share/ (Discount rate - Dividend grown rate)
If DDM > current stock price then stock is undervalued
Gordon Growth Model
A simple formula used to find the true value of a stock based on a steady stream of dividends that grow at the same rate forever
price per share= D(1) / (r-g)
D(1): estimated val of next year div
r: cost of equity capital
g: constant grown rate for div
Time Value of Money in Excel
=PV(RATE, NPER, PMT, FV, Type)
=FV(RATE, NPER, PMT, PV, Type)
=PMT(RATE, NPER, PV, FV, Type) =NPER(RATE, PMT, PV, FV, Type) =RATE(NPER, PMT, PV, FV, Type)
Type is a binary variable, indicating the timing of the
cashflows: 1 for the beginning; 0 for the end.
=NPV(rate, value1, value2, , ,)
=IRR(Values, Guess)
Stock Valuation
k' = D1/Po' +g
k': expected returns
D1: Div at year one
Po: Price right now
g: groth rate
1. Undervalued stocks if (k) are above the CAPM benchmark returns
Coca Cola model
Warren Buffet used 2 stage growth model to make 3 Billion off stock
How to Find PV of Bond (excel)
=PV(RATE, NPER, PMT, FV, Type)
=PV
(Req/Frequency
Maturit * Frequency
- Coupon *Face / Frequency
-Face val)
=Net Income / Sales
Net Profit Margin % formula
=GEOMEAN(all % change in sales)-1
Sales Growth formula
Net income growth
Same thing different cells
Percent Change in Sales
Later year sales/ Earlier Year
=IF( ,”GOOD”)
IF the current ratio is greater than the previous one AND greater than industry average
=IF ( , “BAD”)
IF the current ratio is less than the previous one AND less than industry average
=IF( ,”OK”)
IF the current ratio is greater than the previous one OR greater than industry average
Yes
Can PMT be 0?
no
Do you have to have anything for ‘type’ in an excel formula
True
True/False: Solving for N in an Annuity, if there are 2 diff cash flows you have to make one of them negative
True
True/False: Solving for N in an Annuity, if PV has $ amount, PV and annual payment must have same sign
Type
A binary (0 or 1) variable which controls whether Excel assumes the payment occurs at the end (0) or the beginning (1) of the period.
Annutities
A series of nominally equal cash flows, equally spaced in time. (car payment, mortgage payment)
Ri - Rf = a + B1*(MKT) + B2*SMB + B3*HML
Regression formula
Ho:a = 0.
Testable implication formula
Y variable
This is the part you measure or observe. It changes as a result of the x variable. On a graph, it goes on the vertical side line
X variable
This is the part you change or control. It acts as the cause. On a graph, it goes on the horizontal bottom line
Absolute value > Slope Coefficient
How do you know when there is a significant relationship
For every 1 year in age, bottles a week increase by 6%
Males drink 47% more bottles a week than females
What is the interpretation of the beta? (hint: there’s 2)

Yes, because the corresponding t value (6.6) is greater than or equal to 2
Is there a significant relation between wine consumption and age? Why?

Yes, because the absolute value of the corresponding t value (2) is greater than or equal to 2.
Is there a significant relation between wine consumption and gender? Why?

3
If there are 4 classes how many would you define when using a dummy variable?
True
True/False: If PV has a dollar amount then the annual payments must have the same sign?