ECO 100
 Call Kai
 Learn
Learn Practice Test
 Spaced Repetition
 Match
Match Flashcards
 Knowt Play
1/41

Earn XP
Description and Tags
Microeconomics -- Midterm Prep
Name | Mastery | Learn | Test | Matching | Spaced | Call with Kai | Chat |
|---|
No analytics yet
Send a link to your students to track their progress
42 Terms
How to find equilibrium?
Set QD(P)=QS(P), solve for equilibrium price P
Plug back into either supply or demand for the quantity Q
Example:
QD(P)=100−10P and QS(P)=15P
Setting equal gives: P=4
Plug back into supply or demand to get quantity 60.
Supply shifts right/increases when…?
Supply shifts to the right when suppliers are more willing to produce
input costs decrease
technology improves
Supply shifts left/decreases when…?
Supply shifts to the left when suppliers are less willing to produce
input costs increase
technology is damaged/worsened
Demand shifts right/increases when…?
Demand will shift right if consumers are more eager to buy
complement good gets cheaper
consumers anticipate/expect high/higher future value
a substitute good gets more expensive
Demand shifts left/decreases when…?
Demand will shift to the left when consumers are less eager or willing to buy
complement good gets more expensive
future value anticipated to be low
a substitute good becomes more affordable
Equilibrium price RISES when?
Equilibrium price FALLS when?
Equilibrium price RISES when demand shifts right or supply shifts left
Equilibrium price FALLS when demand shifts left or supply shifts right
A demand shift moves price and quantity the same direction
A supply shift moves them in opposite directions
e.g., if supply shifts right, then equilibrium price falls and quantity rises
What is a price floor?
A price floor is a minimum price
e.g., minimum wage
a price floor is binding if it is too high
i.e., above the equilibrium price
causes surpluses, as supply exceeds demand if the price is too high
the short side of the market (here, demand) determines quantity actually traded
suppliers who get the high price BENEFIT, consumers who pay this do NOT, sellers who previously managed to sell (but now cannot) are HARMED
e.g., workers who previously had their jobs, “sold their labor,” but now are unemployed)
When is a price floor BINDING? And what is the impact of a binding price floor?
a price floor is binding if it is too high
i.e., above the equilibrium price
binding price floors cause surpluses
BUT, sometimes, a regulating agency will buy up the surplus which results in:
higher prices for suppliers (here, farmers): good
higher prices for consumers: bad
high government costs: bad

Minimum wage is an example of what kind of price regulation?
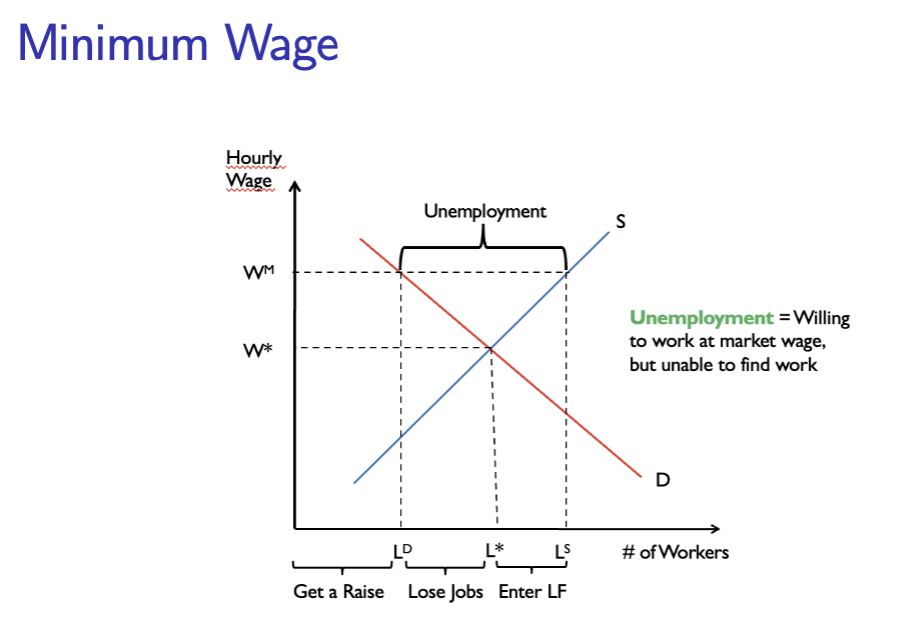
Bonus: Draw a graph which illustrates the impact of minimum wage on the supply and demand graph.
Multiple Choice: To help poor workers, the government imposes a minimum wage. Assuming that this is binding, our equilibrium supply/demand model predicts: wages and unemployment
A. rise, rises
B. rise, falls
C. fall, rises
D. fall, falls
A price floor.
**see the graph in the photo for the correct illustration
Your axis should be labeled:
Y-axis — Hourly Wage (price)
X-axis — Number of Workers (quantity)
Multiple Choice: To help poor workers, the government imposes a minimum wage. Assuming that this is binding, our equilibrium supply/demand model predicts: wages and unemployment
A. rise, rises
B. rise, falls
C. fall, rises
D. fall, falls
What is a PRICE CEILING?
A price ceiling is a maximum allowed price.
e.g., rent control
When is a price ceiling BINDING? What does this cause? What impact does this have?
Bonus: Draw a graph illustrating a binding price ceiling
A price ceiling (maximum allowed price) is binding when it is below the equilibrium price.
A price ceiling causes shortages which may result in:
long lines
reduction in quality of goods sold
black market sales
lotteries
Shortages are created because demand exceeds supply when the price is too low
The short side of the market, supply here, determines quantity actually traded

What is elasticity?
Write or recite the formula from memory.
Elasticity measures how responsive/sensitive quantity demanded or supplied is, in one of the things that influences it
Formula:
Price Elasticity =%ΔP%ΔQD=PΔPQΔQ=QP⋅ΔQΔP1
Define price elasticity of demand
Write or recite the formula from memory.
How responsive demand quantity is to price.
For demand, the slope is negative.
Formula:
ϵPD=%ΔP%ΔQD=QDP⋅∣slope∣1
Price elasticity of demand gets higher as we move to the top left of demand.
with higher P and lower Q
it also gets higher as |slope| falls, i.e. as demand gets flatter

Define inelastic demand
Inelastic demand means that if price falls → quantity barely rises → expenditures fall
Inelastic demand = fairly insensitive
∣ϵp∣<1 , meaning “quantity changes by a smaller proportion than price”
Define elastic demand
Elastic demand means that if price falls → expenditures are directly reduced →quantity rises by more than enough to compensate → meaning overall, expenditures rise
Elastic = highly sensitive
∣ϵp∣>1 meaning “quantity changes by a larger proportion than price”
more elastic ↔ less eager to trade
less elastic ↔ very eager to trade

Calculating a SHORTAGE
Write the formula.
QD(P)−QS(P)
calculated at ceiling price!


Calculating a SURPLUS
Write the formula.
QS(P)−QD(P)
calculated at the floor price!

Inelastic
Price elasticity of demand (∣ϵP∣ ) is inelastic when it is?
∣ϵP∣<1
Inelastic
Elastic
Price elasticity of demand (∣ϵP∣ ) is elastic when it is?
∣ϵP∣>1
Elastic
Unit Elastic
Price elasticity of demand (∣ϵP∣ ) is unit elastic when it is?
∣ϵP∣=1
Unit elastic means a percentage change in price causes an equally proportional percentage change in the quantity demanded or supplied
Perfectly Inelastic (vertical)
Price elasticity of demand (∣ϵP∣ ) is perfectly INELASTIC when it is?
Vertical
ϵP=0
Perfectly Elastic (horizontal)
Price elasticity of demand (∣ϵP∣ ) is perfectly ELASTIC when it is?
Horizontal
∣ϵP∣=∞
Formula for Expenditure
Bonus: What happens to expenditures in elastic vs. demand systems in response to changes in price?
expenditure =P⋅QD(P)
Elastic: price falls → expenditure rises
Inelastic: price falls → expenditure falls
What makes demand elastic?
Close substitutes and more time (long run). Necessities are inelastic. Supply is inelastic when quantity is hard to adjust (beachfront land). The elastic side is less eager to trade.
Marginal Benefit (MB)
Dollar valuation approach!
MB: Maximum willingness to pay
Can be used to determine individual demand

Marginal Cost (MC)
The minimum you’d sell one more unit for.
MB curve = demand
MC curve = supply
Producer Surplus
For a standard straight-line supply curve forming a triangle:
Producer Surplus = 21×Base×Height
Base=Equilibrium Quantity(Q∗)
Height=Equilibrium Price(P∗)−SupplyIntercept(Pmin)
Producer Surplus = 21×Q∗×(P∗−Pmin)
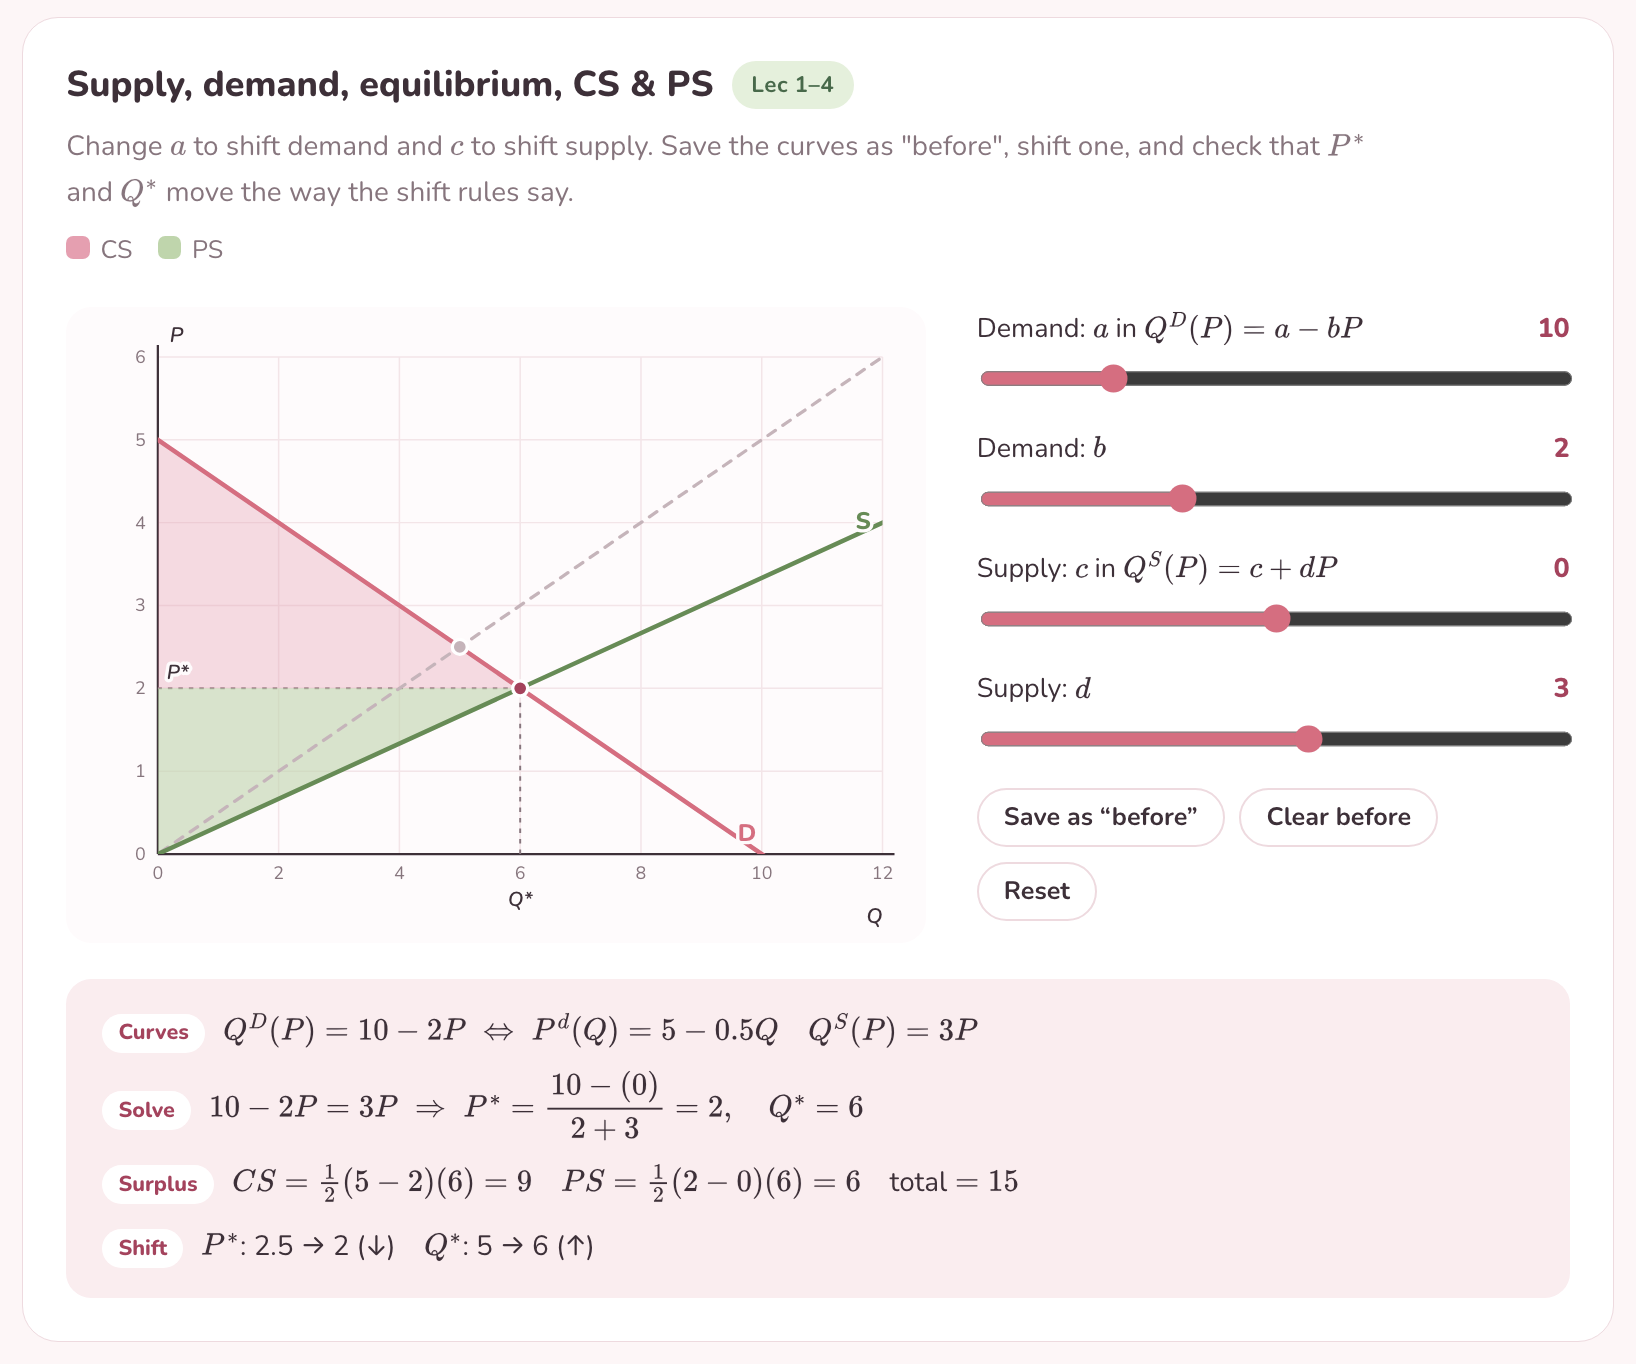
Formulas for PC and PS when consumers pay the tax directly
Bonus: what happens to demand when consumers pay directly?
PC=P+t
PS=P
demand decreases by t

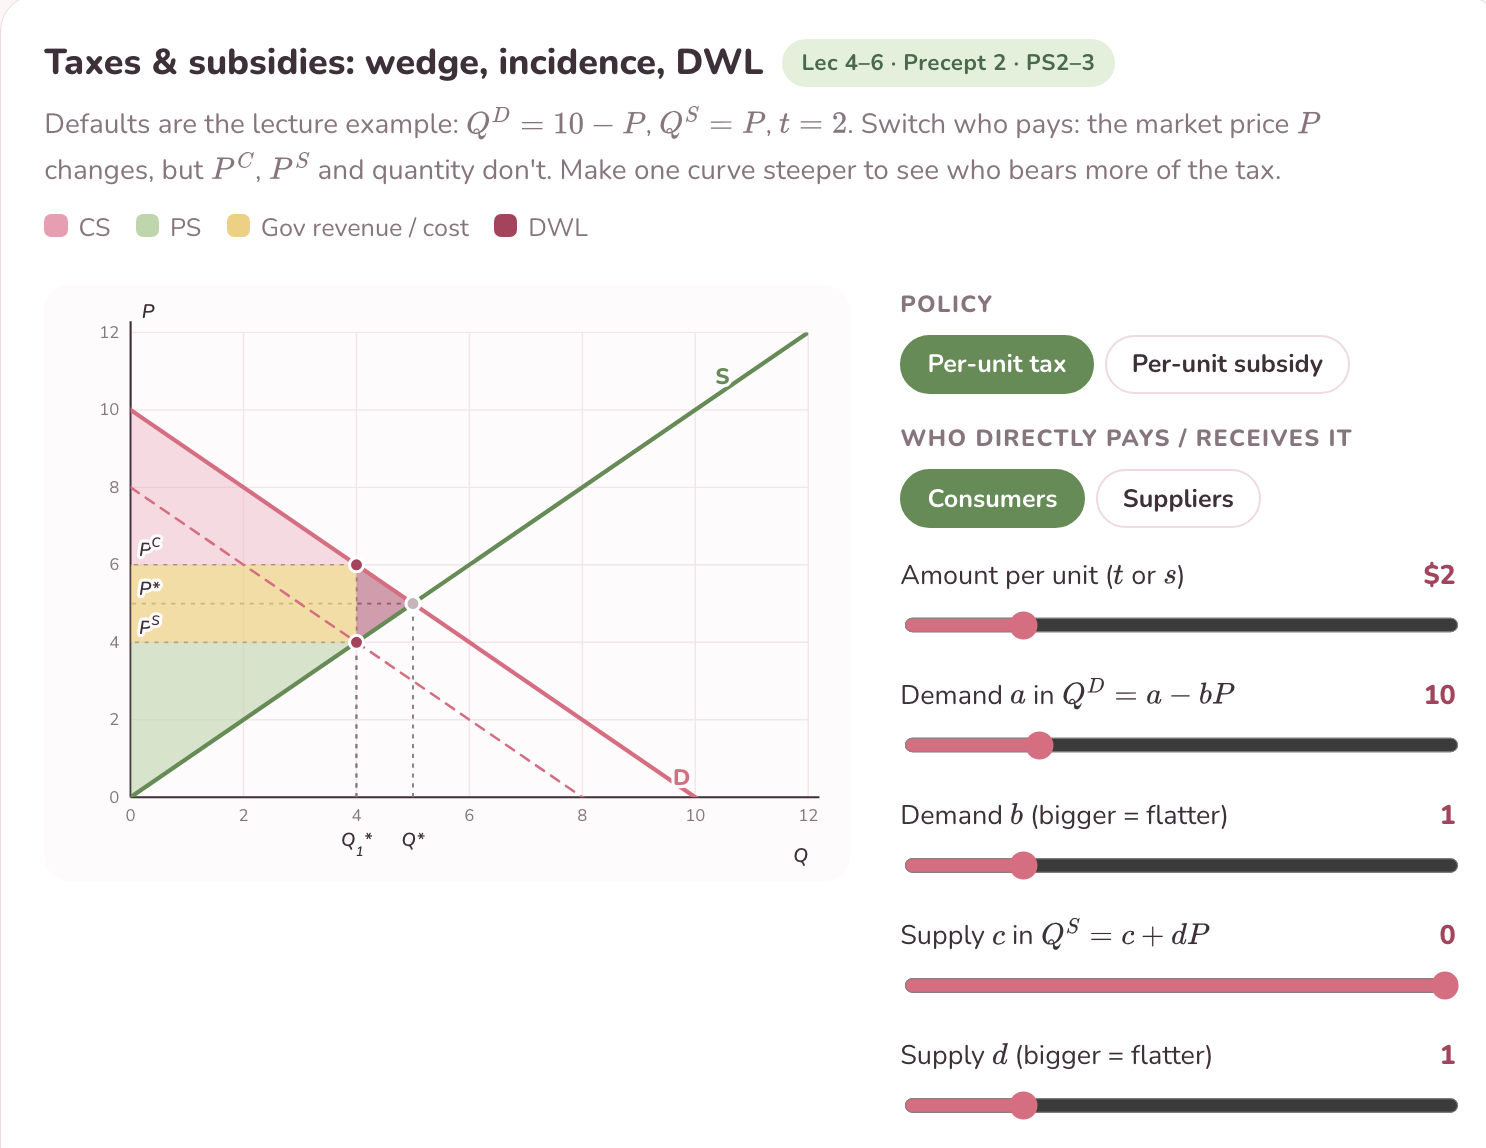
Formulas for PC and PS when suppliers pay the tax directly
Bonus: what happens to supply when suppliers pay directly?
PC=P
PS=P−t
supply increases by t


Equilibrium with a tax
QD(PC)=QS(PS)
Per-unit subsidies wedge
PC=PS−s
Per-unit subsidies when consumers receive it
PC=P−s
PS=P
Demand shifts up by s.


Per-unit subsidies when suppliers receive it
PS=P+s
PC=P
Supply shifts down by s.


Cost, total surplus, and DWL in response to subsidies
cost =sQ1∗
TS=CS+PS−cost
DWL=21s(Q1∗−Q∗)
CS and PS both rise, but the cost rises by more.
DWL = trades that happen but shouldn’t (MC > MB).
Draw a graph based on the following scenario, and answer the questions below (make sure they are visible on the graph too):
World price is less than domestic equilibrium, and the government institutes a tariff per unit.
World price pworld=$10
Tariff per unit (imports only) =$10
What is the PS gain/loss?
What is the CS gain/loss?
Is there a DWL? If so, what is it?
What is the total revenue?

What is the PS gain/loss? PS gain = 300
What is the CS gain/loss? CS loss = -750
Is there a DWL? If so, what is it? Yes, DWL = 150
What is the total revenue? Revenue = 300
You might not need to calculate all of these number values depending on how complex the graph is but it would be safe to familiarize yourself with them to make sure that you can read them easily off of a graph/interpret the numbers.

Formula for budget constraint and line
p1x1+p2x2≤m
p1x1+p2x2=m
The budget line is the bundles that use up exactly all your money.
Marginal Rate of Substitution (MRS)
MRS1,2=MU2MU1= |slope of indifference curve|
The rate you’re willing to give up good 2 for one more of good 1.
Formula for Optimal Bundle
MU2MU1=p2p1 & p1x1+p2x2=m
On the graph, the indifference curve just touches the budget line.
Bang per buck
p1MU1=p2MU2
Conditions (involving marginal utility) which are not optimal
MU2MU1>p2p1⇔p1MU1>p2MU2
If one good has a greater “bang-per-buck” than the other, then the bundle is not optimal.
Compare per dollar, not raw MU
What does the MRS look like at the optimum bundle?
MRS1,2=p2p1