Micro Exam 3
 Call Kai
 Learn
 Practice Test
 Spaced Repetition
 Match
 Flashcards
 Knowt Play
1/63

Earn XP
Description and Tags
11/12/26
64 Terms
Which of the following statements about a well-maintained yard best conveys the general nature of the externality?
A well-maintained yard conveys a positive externality because it increases the value of adjacent properties in the neighborhood.
A negative externality arises when a person engages in an activity that has
an adverse effect on a bystander who is not compensated by the person who causes the effect.
A positive externality arises when a person engages in an activity that has
a beneficial effect on a bystander who does not pay the person who causes the effect.

This market is characterized by
a negative externality.
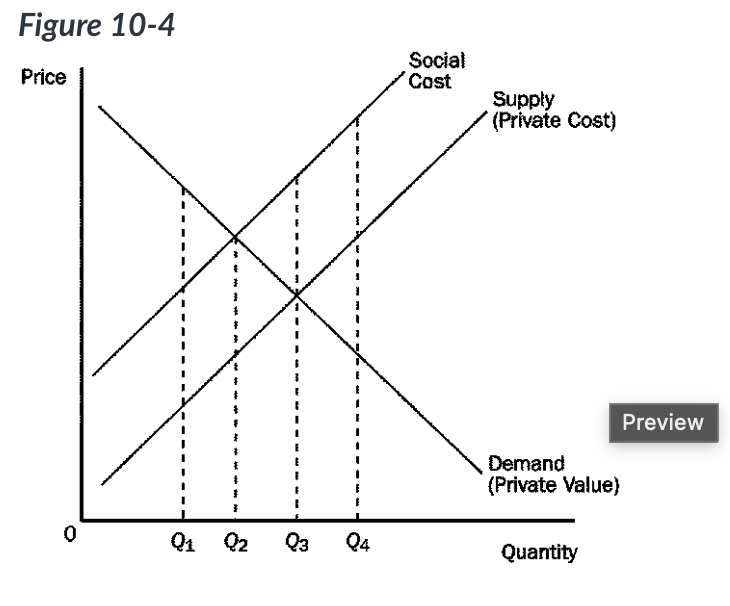
Without government intervention, the equilibrium quantity would be
Q3
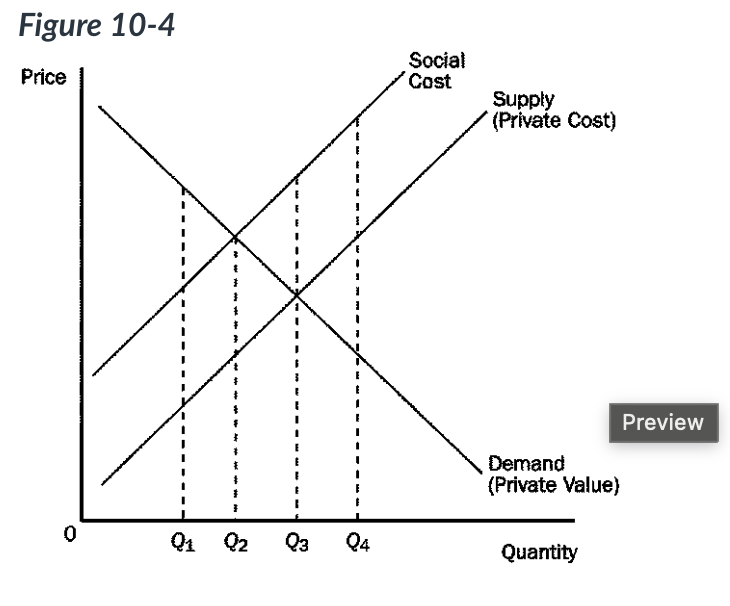
The socially optimal quantity would be
Q1
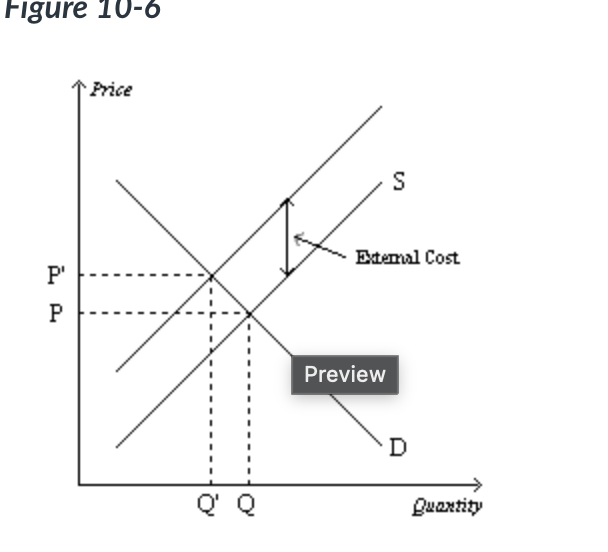
Which price represents the equilibrium price of the product in this market?
P
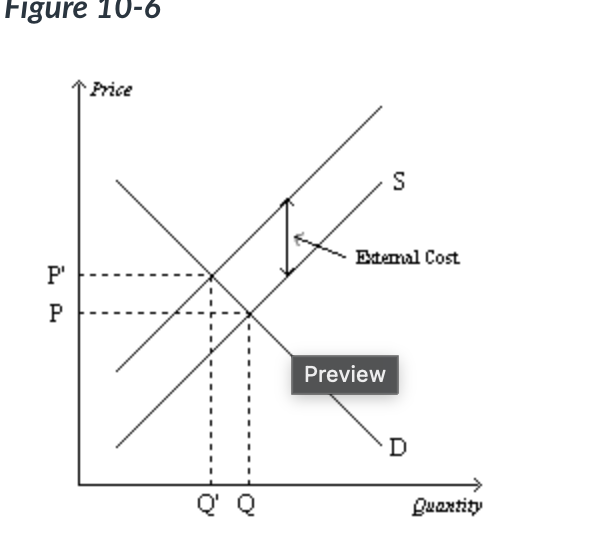
Which quantity represents the socially-optimal quantity of output in this market?
Q’
Which of the following would not be considered a negative externality?
You have an adverse reaction to a medication your doctor prescribed for you.
Suppose that meat producers create a negative externality. What is the relationship between the equilibrium quantity and the socially optimal quantity of meat to be produced?
The equilibrium quantity is greater than the socially optimal quantity.
A positive externality will cause a market to produce
less than is socially desirable.
If education produces positive externalities, we would expect
the government to subsidize education.
If education produces positive externalities and the government does not intervene in the market, we would expect
the equilibrium quantity to be lower than the optimal level.
Suppose that flu shots create a positive externality equal to $12 per shot. What is the relationship between the equilibrium quantity and the socially optimal quantity of flu shots produced?
The equilibrium quantity is less than the socially optimal quantity.

Which graph represents a market with no externality?
a
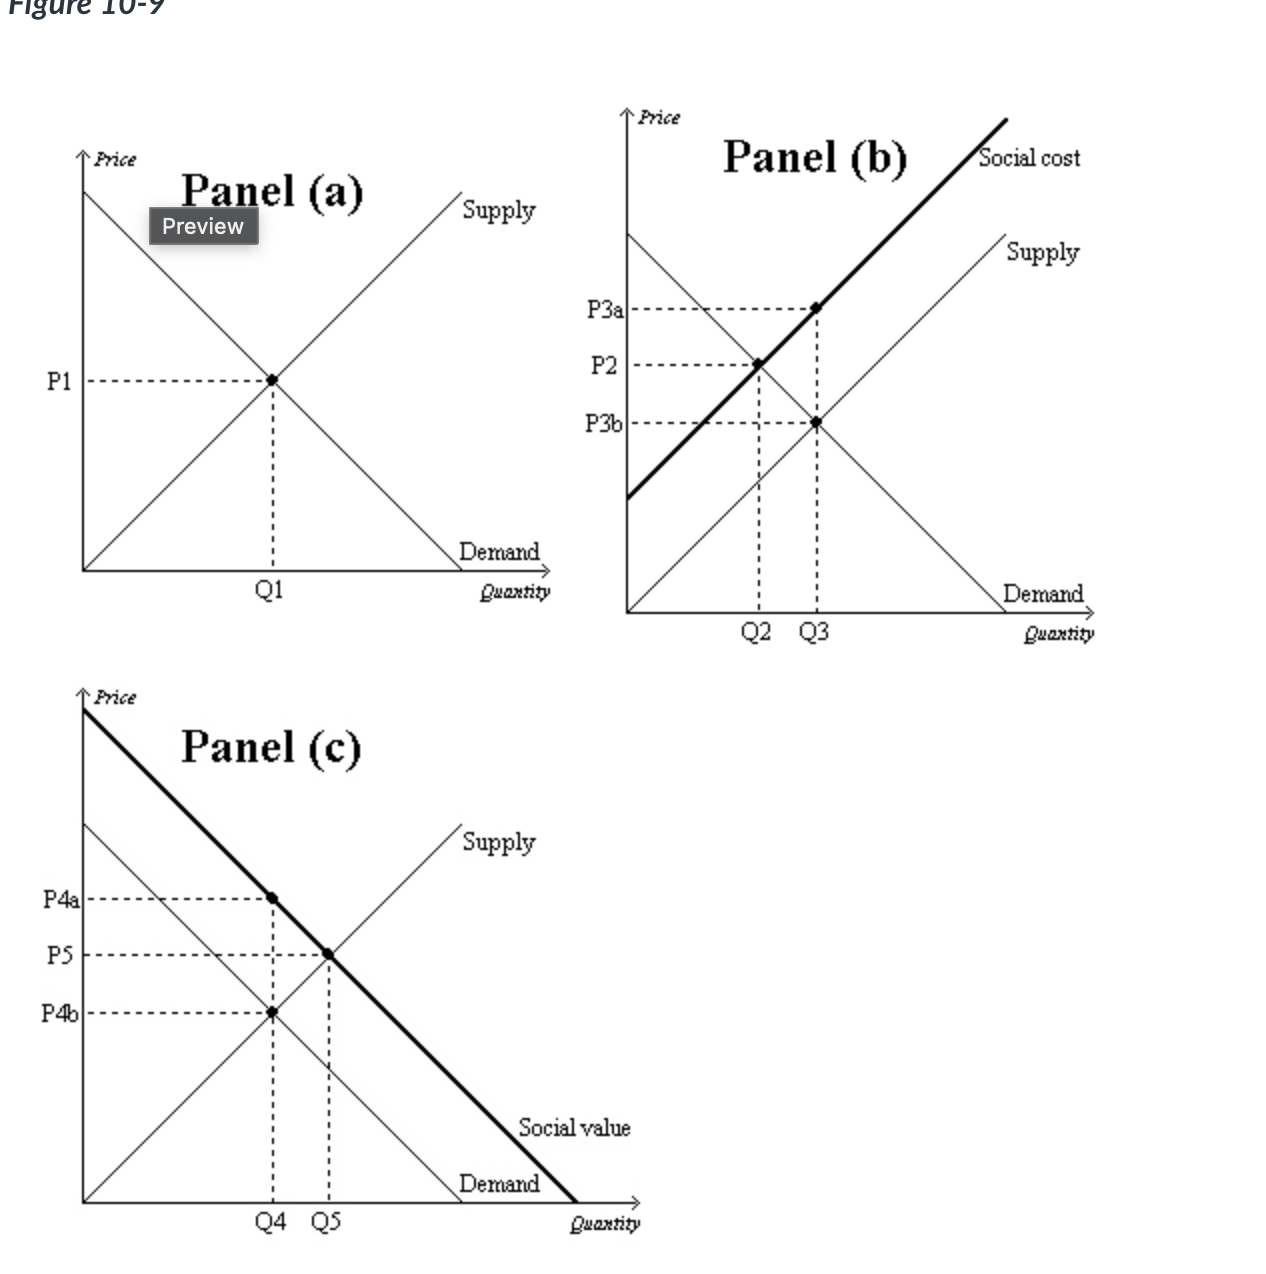
Which graph represents a market with a positive externality?
c

Which graph represents a market with a negative externality?
b

The market equilibrium quantity is
Q3, and the socially optimal quantity is Q2.

The market equilibrium price is
P3b

The market equilibrium quantity is
Q4, and the socially optimal quantity is Q5.

The market equilibrium price is
P4b