Exam 2
 Call Kai
 Learn
 Practice Test
 Spaced Repetition
 Match
 Flashcards
 Knowt Play
1/233

There's no tags or description
Looks like no tags are added yet.
234 Terms
How to add a new variable in jamovi
double click on an empty header cell then click new data variable
data visualization
puts your data into graphical form, easier to identify patterns and data
three types of graphs
histogram, bar graph/chart, dot plot
histogram
a graph showing how many of the cases in a batch of data scored each possible value or range of values on a continuous variable, can’t reorder bars, no gaps, area is proportional to data, numerical value, bin
bar graph/chart
a graph representing catgegorial data where the height of the bar is proportional to the value it represents reorder bars, categorical variable, length is proportional to data, category
dot plot
displays individual data points as a dot along a number line or axis
histogram vs bar graph
histogram cannot be reordered bar chart can, difference in spacing, area/ length, x axis
nomical or ordinal data
bar graph or frequency dot plot
interval or ratio data
histogram or dot plot
what is the goal of graphing data distributions
what values are most common for a variable answered with measures of central tendency, how much variety or variability is there in the values are there extreme outliers
when reporting results what should accompany a measure of central tendency
a measure of variability
when to use mean
data are continuous, normally distributed and contain no outliers
when to us median
data are ordinal, data are continuous but not normally distributed, have outliers
when to use mode
data are nominal, data are continuous but you want to know the most common value
when to us range
not commonly used or reported, you want a quick shorthand for variability that gives you and indication of outliers
when to use IQR or interquartile range
always report with median, data are ordinal, data are continuous but not normally distributed (skewed) or have outliers
when to use mean average deviation M.A.D.
not commonly used or reported, small dataset that you want a quick shorthand for variability
when to use variance (sample)
data are continuous and normally distributed, you have to use it in a. formula to calculate something else (otherwise report SD)
when to use Standard deviation (sample)
you’re reporting a mean, data are continuous and normally distributed, you want the variability to be interpretable in your original units
outliers in jamavoi
gives you the row not the outlier itself
how to get a z-score from a percentage
convert percentage to proportion (move decimal two places) go to z-table use column c to report z-score
frequency table
in order with number of occurrences, uses interval or ratio type variables
grouped frequency distribution tables help to
see patterns and detect weird values
steps to making a grouped frequency table
put scores in order, combine nearby items into bins that represent a range of values (need to be an equal number of values in each bin), count frequency of each score in each bin
bins are
exclusive - each item fits in no more than one bin, equal sized - each bin has the same range, exhaustive - every item fits in a bin, outliers are included in bins, use between 5-20 bins
raw frequency tables
reflect sample size, can make it hard to compare across studies with different sample size
relative frequency tables express
frequency in proportions or percentages
formula for proportion
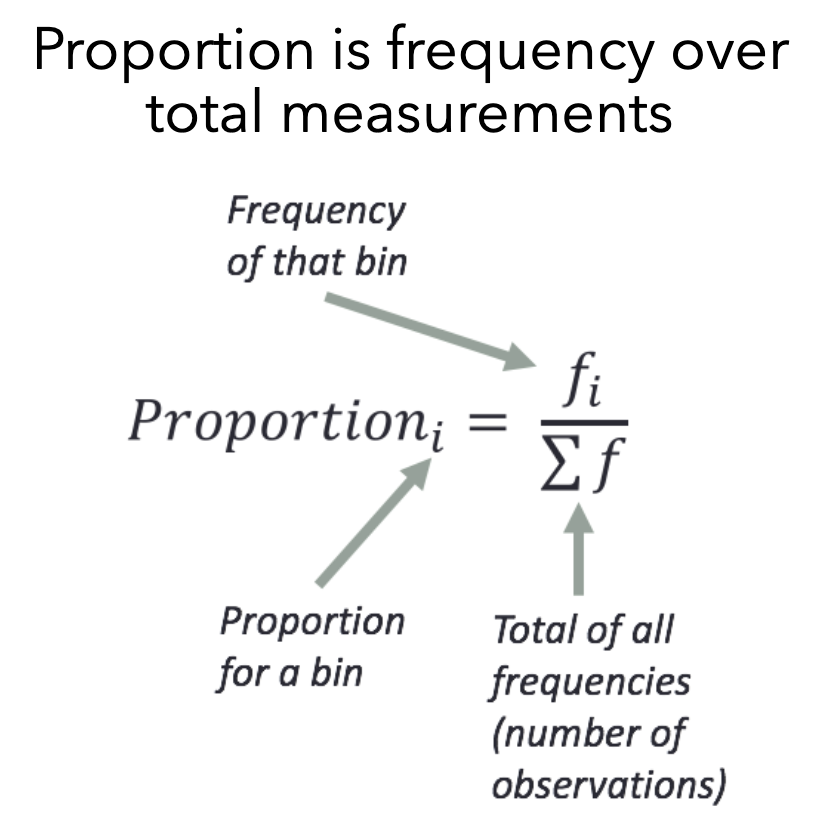
steps for creating a relative frequency table
put scores in order, combine nearby items into bins , count frequency of each score in each bin, take the frequency of each score in each bin, take the frequency count for each bin and divide by the total observation count to get proportions, multiple proportion column by 100 to get percentages
cumulative frequency counts
accumulated scores across bins, useful for counting scores below or above a threshold value
cumulative frequencies can also be counted in
relative proportion or percentages
cumulative frerquinces don’t make as much sense for which variable type
nominal, less helpful because you can’t say above or below
steps for creating a cumulative frequency table
put scores in order, combine items into bins, count frequency of each score in each, for the cummulative column count the frequency in the current bin, plus all those below it (running total)
histogram
is a graphical depiction of a frequency table by showing how often values in the data occur
expectations for a histogram
x-axis has all possible values, y-axis reflects frequency, increment of values on the y0axis should be equal-sized, if using bins bins should be equal, exclusive and exhaustive e
why are bins helpful for histograms
it is hard to visualize not binned data
normal distribution
a symmetrical distribution of data with a single peak and a bell shape, standard bell curve, mean median and mode are all in the same spot
skewed distribution
have many observations clumped on one-end with a tail of extreme values on the other end, mean median and mode don’t line up, skew = which way the tail points
outliers
scores that are much different from the majority of scores
graphs with more than one peak
bi-modal or multi-modal
bi-modal
two peaks
multi-modal
3 or more peaks
uni-modal
one peak
comparing distribution shapes
what do you notice, what do you wonder, what is going on
central tendency
a single number that describes the center or typical point of a distribution, the value that scores in a distribution center on
measures of central tendency
summarize the middle or most typical values for a variable mode, median, mean
what factors guide choice of what measure of central tendency to use
variable type and shape of distribution
mode
the most common value of the variable
median
the middle value in a frequency distribution
mean
the arithmetic average of all values for a variable
mode
the most common value of the variable, the only and best measure for nominal variables, complement with frequencies of each category, does not require comparison between variable values or calculation of average, could use for ordinal interval and ratio variables
modes used for describing distributions
one mode, two modes, uniform (mode not helpful), multimodal two modes
is mode the absolute peak
mode is not always the absolute peak, sometimes there is another peak that it misses
if quantitative and multimodal consider why
were different versions of a measure used, was there some procedural difference that could have created unintended groupings in the data, are there naturally occurring groups in the data that should be examined seperatley
median
the middle value in a frequency distribution the point that falls in the middle of all points when putting the data in order, the median is higher than half of the scores and lower than half the scores, does not use all of the values in the data, could use for ordinal interval and ratio scales, best for ordinal, not applicable to nominal data
what to do if there are an odd number of data points for the median
put the points in order, count the points (n+1)/2
what to do if there are an even number of data points for the median
put the points in order, count the points,, take points surrounding (n+1)/2, median is the midpoint of those two points
median is best for when
ordinal measurement, or for interval and ratio if the variable is skewed
mean
the arithmetic average of all values for a variable, does use all of the values in the data highly influenced by outliers, could use for interval and ratio scales
mean equation
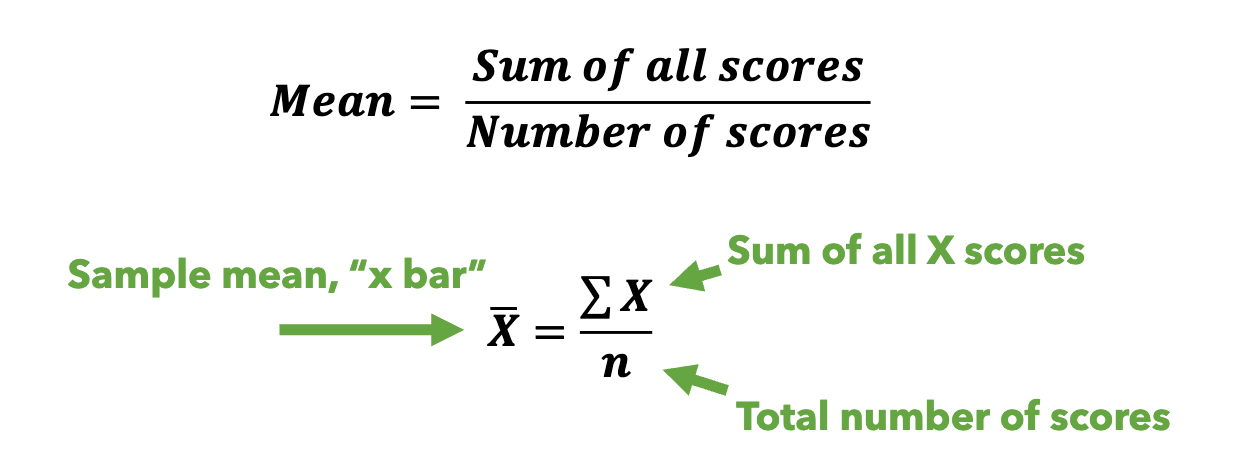
we can compute mean from frequency distribution

when is mean best used
shape of the distribution for interval/ratio variable is symmetrical (not skewed) and unimodal
negative skew
mean<median<mode
positively skewed
mode<median<mean
symmetric
median=mean=mode
if nominal use
mode
if ordinal
use median
if interval or ratio
use median if distribution is skewed use mean if distribution is symmetrical
variability
how spread out a distribution is aka how different (people) are from each other
distributions with the same central tendency can have
different degrees of variability
central tendency alone is not enough
discussing only central tendency gives us an incomplete picture of the data
sources of variability
participant variability, measurement variability
participant variability
between-subject, within-subject
measurement variability
random, systematic
participant variability between different participants
students will score differently from each other on a self-report measure of extraversion ex. quarterbacks in the big ten will all have different level of average pre-game anxiety
participant variability within a given participant
the same student may fluctuate slightly in how extraverted they feel they are throughout the year ex. the same quaterback will fluctuate in their pre-game anxiety across games in the season
measurement variability/error random
the measure of a construct is randomly off from the true score of the variable so sometimes its higher and other times lower, only affects the variability around the average
measurement variability/error systematic
the measure of a construct is consistently offset from the true score so it is systemically biased, does affect the average
range
a measure of variability that says how wide the distribution is - spread, high minus low
absolute range
the difference between the smallest and largest observed values
range and distribution
range can be calculated no matter the shape of the distribution, finding the min and max values is independent of the rest of the distribution
outliers and range
range is highly susceptible to outliers
interquartile range IQR
the range of the middle 50% of values; the values between the 25% (Q1) and the 75% (Q3)
What does IQR tell us
how widespread are the observations in the middle of the distribution so it is less effected by outliers, anytime you report a median you want to report IQR
how to find the IQR
put the dataset in order, split them into 2 halves divided at the median, find the middle of each half for Q1 and Q3 IQR= Q3-Q1
IQR and normal distributions
IQR is symmetrical such that a range of Q1 to Q2 is equal to range of Q2 to Q3
skewed distributions and IQR
IQR may be asymmetric such that the range of Q1 to Q2 is different than Q2 to Q3
box and whisker plot
a graph of IQR and range which helps visualize variability and skew
whiskers on a box and whisker plot
absolute range or outlier
how to calculate an outlier on a box and whisker plot
value<Q1 - IQR*1.5 value>Q3+IQR*1.5
deviation from mean
variability can be conceptualized as how much each point deviates from the mean, how spread the data are around the mean
deviation from mean formula
observed scores - mean = deviation from mean
greater deviation from the mean means
greater spread of scores, greater variability
negative deviation or positive deviation from mean
negative=score less than mean positive=score greater than mean
deviation from mean formula
deviation = xi-x(with a line on top)
what can’t you take from a deviation from mean
can’t average to quantify overall variability because it will equal zero, mean of all deviation scores will always be zero
mean as a balance point
the points are evenly distributed around the mean, the total negative deviation will always be the same amount as the total positive deviation
how do we quantify deviation from the mean
one option is to take the absolute value of all deviation scores
absolute value
dropping the sign
mean absolute deviation
quantifies the mean of the absolute deviation, gives a metric for comparing variability, distributions with higher m.a.d. have greater spread of scores